Table I Summary of provisional cases of selected notifiable diseases, United States, cumulative, week ending February 15, 2014 (7th Week)
Figure I Selected notifiable disease reports, United States, comparison of provisional 4-week totals ending February 15, 2014, with historical data
Table II Provisional cases of selected notifiable diseases, United States, weeks ending February 15, 2014 and February 16, 2013 (7th Week)
Table III Deaths in 122 U.S. cities, week ending February 15, 2014 (7th Week)
TABLE I. Provisional cases of infrequently reported notifiable diseases (<1,000 cases reported during the preceding year) — United States, week ending February 15, 2014 (7th week)* (Export data)
TABLE I. (Continued) Provisional cases of infrequently reported notifiable diseases (<1,000 cases reported during the preceding year) — United States, week ending February 15, 2014 (7th week)*
—: No reported cases. N: Not reportable. NN: Not Nationally Notifiable. Cum: Cumulative year-to-date counts.
† Calculated by summing the incidence counts for the current week, the 2 weeks preceding the current week, and the 2 weeks following the current week, for a total of 5 preceding years. Additional information is available at http://wwwn.cdc.gov/nndss/document/5yearweeklyaverage.pdf.
§ Not reportable in all states. Data from states where the condition is not reportable are excluded from this table except starting in 2007 for the arboviral diseases, STD data, TB data, and influenza-associated pediatric mortality, and in 2003 for SARS-CoV. Reporting exceptions are available at http://wwwn.cdc.gov/nndss/document/SRCA_FINAL_REPORT_2006-2012_final.xlsx.
¶ Includes both neuroinvasive and nonneuroinvasive. Updated weekly from reports to the Division of Vector-Borne Infectious Diseases, National Center for Zoonotic, Vector-Borne, and Enteric Diseases (ArboNET Surveillance). Data for West Nile virus are available in Table II.
** Data for H. influenzae (all ages, all serotypes) are available in Table II.
†† Updated weekly from reports to the Influenza Division, National Center for Immunization and Respiratory Diseases. Since September 29, 2013, 52 influenza-associated pediatric deaths occurring during the 2013-14 influenza season have been reported.
§§ The two measles cases reported for the current week were imported.
¶¶ Data for meningococcal disease (all serogroups) are available in Table II.
*** CDC discontinued reporting of individual confirmed and probable cases of influenza A (H1N1)pdm09 virus infections on July 24, 2009. During 2009, four cases of human infection with novel influenza A viruses, different from the influenza A (H1N1)pdm09 virus, were reported to CDC. The four cases of novel influenza A virus infection reported to CDC during 2010, the fourteen cases reported during 2011, the 313 cases reported in 2012, and the 21 cases reported during 2013 are different from the influenza A (H1N1)pdm09 virus. Total case counts are provided by the Influenza Division, National Center for Immunization and Respiratory Diseases (NCIRD).
††† No rubella cases were reported for the current week.
§§§ Updated weekly from reports to the Division of STD Prevention, National Center for HIV/AIDS, Viral Hepatitis, STD, and TB Prevention.
¶¶¶ There were no cases of viral hemorrhagic fever reported during the current week. See Table II for dengue hemorrhagic fever.
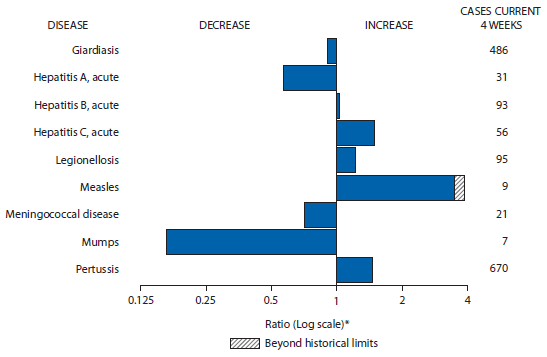
FIGURE I. Selected notifiable disease reports, United States, comparison of provisional 4-week totals February 15, 2014, with historical data
* Ratio of current 4-week total to mean of 15 4-week totals (from previous, comparable, and subsequent 4-week periods for the past 5 years). The point where the hatched area begins is based on the mean and two standard deviations of these 4-week totals.
Alternate Text: The figure above shows selected notifiable disease reports for the United States, with comparison of provisional 4-week totals through February 15, 2014, with historical data. Reports of acute hepatitis B, acute hepatitis C, legionellosis, measles, and pertussis all increased, with measles increasing beyond historical limits. Reports of giardiasis, acute hepatitis A, meningococcal disease, and mumps all decreased.
TABLE II. Provisional cases of selected notifiable diseases, United States, weeks ending February 15, 2014, and February 16, 2013 (7th week)* (Export data)
Reporting area
Babesiosis
Chlamydia trachomatis infection
Coccidioidomycosis
Current week
Previous 52 weeks
Cum 2014
Cum 2013
Current week
Previous 52 weeks
Cum 2014
Cum 2013
Current week
Previous 52 weeks
Cum 2014
Cum 2013
Med
Max
Med
Max
Med
Max
United States
1
15
139
6
12
11,336
27,697
29,767
140,386
196,058
38
200
308
834
1,624
New England
—
4
75
5
8
521
911
1,155
4,247
6,492
—
0
0
—
1
Connecticut
—
1
33
1
3
76
237
379
1,046
1,650
N
0
0
N
N
Maine
—
0
6
1
—
82
69
110
490
426
N
0
0
N
N
Massachusetts
—
2
48
3
4
324
429
680
2,172
3,036
—
0
0
—
—
New Hampshire
—
0
1
—
1
—
56
73
27
481
—
0
0
—
1
Rhode Island
—
0
26
—
—
—
81
160
310
545
—
0
0
—
—
Vermont
—
0
1
—
—
39
33
96
202
354
N
0
0
N
N
Mid. Atlantic
1
7
56
1
3
1,928
3,410
3,740
20,395
22,701
—
0
0
—
—
New Jersey
—
0
24
—
2
134
558
676
3,247
3,816
N
0
0
N
N
New York (Upstate)
—
3
41
—
1
677
745
1,674
3,820
3,923
N
0
0
N
N
New York City
1
0
12
1
—
379
1,083
1,261
6,628
7,982
N
0
0
N
N
Pennsylvania
N
0
0
N
N
738
1,006
1,327
6,700
6,980
N
0
0
N
N
E.N. Central
—
0
11
—
—
1,371
4,842
5,583
18,455
37,768
—
0
3
9
3
Illinois
—
0
0
—
—
25
2,039
2,503
2,724
17,188
N
0
0
N
N
Indiana
—
0
1
—
—
236
559
793
2,860
3,797
N
0
0
N
N
Michigan
—
0
0
—
—
392
845
1,091
4,367
6,012
—
0
3
6
1
Ohio
N
0
0
N
N
478
1,025
1,151
5,627
7,472
—
0
2
3
—
Wisconsin
—
0
11
—
—
240
433
517
2,877
3,299
—
0
0
—
2
W.N. Central
—
0
1
—
—
306
1,566
1,819
6,902
10,874
—
1
7
3
—
Iowa
N
0
0
N
N
21
204
243
1,261
1,389
N
0
0
N
N
Kansas
N
0
0
N
N
—
209
246
789
1,454
N
0
0
N
N
Minnesota
—
0
0
—
—
—
353
419
390
2,631
—
0
5
—
—
Missouri
N
0
0
N
N
98
527
632
2,851
3,461
—
0
3
3
—
Nebraska
—
0
1
—
—
151
140
227
877
941
—
0
1
—
—
North Dakota
—
0
1
—
—
7
51
78
296
411
—
0
2
—
—
South Dakota
—
0
0
—
—
29
73
95
438
587
N
0
0
N
N
S. Atlantic
—
0
2
—
—
3,427
5,375
6,543
31,115
37,856
—
0
1
1
1
Delaware
—
0
1
—
—
85
85
220
364
955
—
0
1
—
—
District of Columbia
N
0
0
N
N
—
118
284
—
1,019
—
0
0
—
—
Florida
N
0
0
N
N
936
1,553
1,729
9,971
10,395
N
0
0
N
N
Georgia
N
0
0
N
N
741
969
1,193
5,266
6,609
N
0
0
N
N
Maryland
—
0
2
—
—
138
465
878
1,623
2,602
—
0
1
1
1
North Carolina
N
0
0
N
N
689
947
1,384
6,638
7,161
N
0
0
N
N
South Carolina
—
0
0
—
—
161
502
927
3,597
3,686
N
0
0
N
N
Virginia
N
0
0
N
N
628
625
940
3,100
4,770
N
0
0
N
N
West Virginia
—
0
1
—
—
49
100
127
556
659
N
0
0
N
N
E.S. Central
—
0
0
—
—
1,160
1,789
2,216
9,080
12,312
—
0
0
—
—
Alabama
—
0
0
—
—
—
555
874
1,634
3,592
N
0
0
N
N
Kentucky
N
0
0
N
N
328
326
471
2,073
2,260
N
0
0
N
N
Mississippi
N
0
0
N
N
636
326
987
2,697
2,558
N
0
0
N
N
Tennessee
—
0
0
—
—
196
579
844
2,676
3,902
N
0
0
N
N
W.S. Central
—
0
1
—
—
394
3,611
4,326
16,227
26,156
—
0
1
—
1
Arkansas
N
0
0
N
N
347
288
421
1,604
2,231
N
0
0
N
N
Louisiana
—
0
1
—
—
—
513
986
343
1,742
—
0
1
—
1
Oklahoma
N
0
0
N
N
47
273
599
1,201
4,310
N
0
0
N
N
Texas
N
0
0
N
N
—
2,507
3,002
13,079
17,873
N
0
0
N
N
Mountain
—
0
0
—
—
466
1,704
2,293
12,579
10,959
7
128
230
628
1,157
Arizona
N
0
0
N
N
—
531
1,118
5,428
2,180
7
126
221
621
1,139
Colorado
N
0
0
N
N
349
389
586
2,867
2,795
N
0
0
N
N
Idaho
N
0
0
N
N
—
103
233
498
581
N
0
0
N
N
Montana
—
0
0
—
—
56
76
104
509
492
—
0
1
1
—
Nevada
N
0
0
N
N
—
216
323
1,167
1,437
—
1
6
3
6
New Mexico
N
0
0
N
N
—
211
374
1,031
2,364
—
0
3
—
5
Utah
—
0
0
—
—
61
146
166
935
917
—
1
4
3
6
Wyoming
—
0
0
—
—
—
27
64
144
193
—
0
1
—
1
Pacific
—
0
2
—
1
1,763
4,175
4,583
21,386
30,940
31
67
91
193
461
Alaska
N
0
0
N
N
76
108
145
641
837
—
0
0
—
—
California
—
0
2
—
1
1,004
3,203
3,527
15,787
24,061
31
67
91
193
460
Hawaii
N
0
0
N
N
—
126
158
419
929
N
0
0
N
N
Oregon
—
0
0
—
—
314
283
475
2,004
1,723
—
0
1
—
1
Washington
—
0
0
—
—
369
451
582
2,535
3,390
N
0
0
N
N
Territories
American Samoa
N
—
—
N
N
—
—
—
—
—
N
—
—
N
N
C.N.M.I.
—
—
—
—
—
—
—
—
—
—
—
—
—
—
—
Guam
—
0
0
—
—
—
0
0
—
—
—
0
0
—
—
Puerto Rico
N
0
0
N
N
—
109
279
229
729
N
0
0
N
N
U.S. Virgin Islands
N
0
0
N
N
—
15
25
—
99
—
0
0
—
—
C.N.M.I.: Commonwealth of Northern Mariana Islands.
U: Unavailable. —: No reported cases. N: Not reportable. NN: Not Nationally Notifiable. Cum: Cumulative year-to-date counts. Med: Median. Max: Maximum.
TABLE II. (Continued) Provisional cases of selected notifiable diseases, United States, weeks ending February 15, 2014, and February 16, 2013 (7th week)* (Export data)
Reporting area
Cryptosporidiosis
Dengue Virus Infection
Dengue Fever†
Dengue Hemorrhagic Fever§
Current week
Previous 52 weeks
Cum 2014
Cum 2013
Current week
Previous 52 weeks
Cum 2014
Cum 2013
Current week
Previous 52 weeks
Cum 2014
Cum 2013
Med
Max
Med
Max
Med
Max
United States
44
104
440
463
639
—
9
43
9
89
—
0
2
—
1
New England
3
4
14
23
17
—
0
3
1
6
—
0
0
—
—
Connecticut
—
0
5
3
3
—
0
2
—
3
—
0
0
—
—
Maine
1
0
4
6
2
—
0
0
—
1
—
0
0
—
—
Massachusetts
2
2
7
11
8
—
0
0
—
—
—
0
0
—
—
New Hampshire
—
0
2
1
2
—
0
1
—
1
—
0
0
—
—
Rhode Island
—
0
2
—
—
—
0
1
—
—
—
0
0
—
—
Vermont
—
0
2
2
2
—
0
1
1
1
—
0
0
—
—
Mid. Atlantic
5
12
42
49
74
—
3
12
2
28
—
0
1
—
—
New Jersey
—
0
5
—
6
—
0
0
—
—
—
0
0
—
—
New York (Upstate)
4
4
16
21
16
—
0
3
—
10
—
0
1
—
—
New York City
—
1
6
7
7
—
2
9
—
12
—
0
1
—
—
Pennsylvania
1
6
30
21
45
—
0
3
2
6
—
0
0
—
—
E.N. Central
6
24
64
73
147
—
1
5
3
8
—
0
0
—
—
Illinois
—
4
16
3
20
—
0
3
—
2
—
0
0
—
—
Indiana
—
2
7
5
19
—
0
1
—
1
—
0
0
—
—
Michigan
1
4
15
14
29
—
0
3
—
2
—
0
0
—
—
Ohio
5
6
17
29
41
—
0
2
3
2
—
0
0
—
—
Wisconsin
—
7
25
22
38
—
0
1
—
1
—
0
0
—
—
W.N. Central
2
16
171
39
71
—
1
3
2
3
—
0
1
—
1
Iowa
—
5
155
8
21
—
0
0
—
—
—
0
1
—
1
Kansas
—
2
6
1
3
—
0
1
—
1
—
0
0
—
—
Minnesota
—
0
0
—
—
—
0
2
—
2
—
0
0
—
—
Missouri
2
3
11
17
27
—
0
2
2
—
—
0
0
—
—
Nebraska
—
2
11
7
10
—
0
0
—
—
—
0
0
—
—
North Dakota
—
1
7
2
3
—
0
1
—
—
—
0
0
—
—
South Dakota
—
3
17
4
7
—
0
1
—
—
—
0
0
—
—
S. Atlantic
18
20
58
162
151
—
1
9
1
28
—
0
1
—
—
Delaware
—
0
2
1
1
—
0
1
—
—
—
0
0
—
—
District of Columbia
N
0
0
N
N
—
0
0
—
—
—
0
0
—
—
Florida
12
8
23
66
39
—
0
6
—
19
—
0
0
—
—
Georgia
—
4
16
31
30
—
0
2
—
—
—
0
0
—
—
Maryland
1
1
4
8
7
—
0
1
1
2
—
0
0
—
—
North Carolina
2
0
28
33
39
—
0
2
—
2
—
0
0
—
—
South Carolina
—
1
7
6
15
—
0
4
—
1
—
0
0
—
—
Virginia
3
2
9
17
16
—
0
3
—
4
—
0
1
—
—
West Virginia
—
0
2
—
4
—
0
1
—
—
—
0
0
—
—
E.S. Central
—
6
18
31
24
—
0
2
—
3
—
0
0
—
—
Alabama
—
2
8
16
12
—
0
2
—
1
—
0
0
—
—
Kentucky
—
1
5
6
3
—
0
0
—
—
—
0
0
—
—
Mississippi
—
1
5
2
2
—
0
0
—
1
—
0
0
—
—
Tennessee
—
1
6
7
7
—
0
2
—
1
—
0
0
—
—
W.S. Central
2
11
39
24
58
—
1
11
—
2
—
0
0
—
—
Arkansas
—
1
12
2
3
—
0
1
—
—
—
0
0
—
—
Louisiana
—
3
31
6
31
—
0
1
—
—
—
0
0
—
—
Oklahoma
1
1
4
3
4
—
0
2
—
—
—
0
0
—
—
Texas
1
5
21
13
20
—
0
11
—
2
—
0
0
—
—
Mountain
2
8
51
23
41
—
0
1
—
—
—
0
0
—
—
Arizona
—
1
6
3
3
—
0
0
—
—
—
0
0
—
—
Colorado
—
0
4
1
6
—
0
0
—
—
—
0
0
—
—
Idaho
2
2
16
8
6
—
0
1
—
—
—
0
0
—
—
Montana
—
1
20
2
3
—
0
1
—
—
—
0
0
—
—
Nevada
—
0
2
—
1
—
0
1
—
—
—
0
0
—
—
New Mexico
—
1
3
5
3
—
0
0
—
—
—
0
0
—
—
Utah
—
1
7
3
18
—
0
0
—
—
—
0
0
—
—
Wyoming
—
0
25
1
1
—
0
1
—
—
—
0
0
—
—
Pacific
6
9
75
39
56
—
2
8
—
11
—
0
0
—
—
Alaska
—
0
1
—
—
—
0
0
—
1
—
0
0
—
—
California
5
5
15
30
38
—
1
8
—
7
—
0
0
—
—
Hawaii
—
0
1
—
—
—
0
2
—
1
—
0
0
—
—
Oregon
1
3
58
8
15
—
0
0
—
—
—
0
0
—
—
Washington
—
1
12
1
3
—
0
2
—
2
—
0
0
—
—
Territories
American Samoa
N
—
—
N
N
—
—
—
—
—
—
—
—
—
—
C.N.M.I.
—
—
—
—
—
—
—
—
—
—
—
—
—
—
—
Guam
—
0
0
—
—
—
0
0
—
—
—
0
0
—
—
Puerto Rico
N
0
0
N
N
—
93
424
56
1,630
—
0
5
1
4
U.S. Virgin Islands
—
0
0
—
—
—
0
0
—
—
—
0
0
—
—
C.N.M.I.: Commonwealth of Northern Mariana Islands.
U: Unavailable. —: No reported cases. N: Not reportable. NN: Not Nationally Notifiable. Cum: Cumulative year-to-date counts. Med: Median. Max: Maximum.
† Dengue Fever includes cases that meet criteria for Dengue Fever with hemorrhage, other clinical and unknown case classifications.
§ DHF includes cases that meet criteria for dengue shock syndrome (DSS), a more severe form of DHF.
TABLE II. (Continued) Provisional cases of selected notifiable diseases, United States, weeks ending February 15, 2014, and February 16, 2013 (7th week)* (Export data)
Reporting area
Ehrlichiosis/Anaplasmosis†
Ehrlichia chaffeensis
Anaplasma phagocytophilum
Undetermined
Current week
Previous 52 weeks
Cum 2014
Cum 2013
Current week
Previous 52 weeks
Cum 2014
Cum 2013
Current week
Previous 52 weeks
Cum 2014
Cum 2013
Med
Max
Med
Max
Med
Max
United States
—
15
98
3
12
1
26
97
10
18
—
2
22
—
2
New England
—
0
8
—
1
—
4
24
2
3
—
0
1
—
—
Connecticut
—
0
0
—
—
—
0
10
—
2
—
0
0
—
—
Maine
—
0
1
—
—
—
1
8
2
—
—
0
1
—
—
Massachusetts
—
0
0
—
—
—
0
0
—
—
—
0
0
—
—
New Hampshire
—
0
1
—
1
—
1
7
—
1
—
0
1
—
—
Rhode Island
—
0
8
—
—
—
0
14
—
—
—
0
0
—
—
Vermont
—
0
1
—
—
—
0
3
—
—
—
0
0
—
—
Mid. Atlantic
—
2
10
1
2
1
7
31
5
3
—
0
3
—
—
New Jersey
—
0
1
—
—
—
0
4
—
1
—
0
1
—
—
New York (Upstate)
—
1
9
1
1
1
7
28
5
1
—
0
3
—
—
New York City
—
0
5
—
1
—
0
4
—
1
—
0
1
—
—
Pennsylvania
—
0
1
—
—
—
0
0
—
—
—
0
0
—
—
E.N. Central
—
1
8
—
1
—
10
44
1
9
—
1
17
—
2
Illinois
—
0
7
—
—
—
0
2
—
1
—
0
0
—
—
Indiana
—
0
0
—
—
—
0
0
—
—
—
1
12
—
1
Michigan
—
0
0
—
—
—
0
0
—
—
—
0
3
—
—
Ohio
—
0
1
—
1
—
0
1
—
—
—
0
1
—
—
Wisconsin
—
0
6
—
—
—
10
43
1
8
—
0
5
—
1
W.N. Central
—
2
45
—
1
—
0
4
1
—
—
0
2
—
—
Iowa
N
0
0
N
N
N
0
0
N
N
N
0
0
N
N
Kansas
—
1
8
—
1
—
0
1
—
—
—
0
0
—
—
Minnesota
—
0
0
—
—
—
0
0
—
—
—
0
0
—
—
Missouri
—
1
39
—
—
—
0
2
1
—
—
0
2
—
—
Nebraska
—
0
1
—
—
—
0
1
—
—
—
0
0
—
—
North Dakota
—
0
0
—
—
—
0
2
—
—
—
0
1
—
—
South Dakota
—
0
1
—
—
—
0
0
—
—
—
0
0
—
—
S. Atlantic
—
3
28
1
5
—
1
5
1
2
—
0
2
—
—
Delaware
—
0
2
—
—
—
0
1
1
—
—
0
1
—
—
District of Columbia
N
0
0
N
N
N
0
0
N
N
N
0
0
N
N
Florida
—
0
3
—
—
—
0
1
—
—
—
0
0
—
—
Georgia
—
0
2
—
4
—
0
1
—
1
—
0
0
—
—
Maryland
—
0
5
1
—
—
0
1
—
1
—
0
1
—
—
North Carolina
—
0
12
—
—
—
0
3
—
—
—
0
0
—
—
South Carolina
—
0
2
—
—
—
0
0
—
—
—
0
0
—
—
Virginia
—
1
8
—
1
—
0
3
—
—
—
0
1
—
—
West Virginia
—
0
1
—
—
—
0
1
—
—
—
0
1
—
—
E.S. Central
—
1
14
1
2
—
0
1
—
1
—
0
3
—
—
Alabama
—
0
2
1
—
—
0
1
—
—
—
0
1
—
—
Kentucky
—
1
7
—
1
—
0
0
—
—
—
0
0
—
—
Mississippi
—
0
1
—
—
—
0
0
—
—
—
0
1
—
—
Tennessee
—
0
9
—
1
—
0
1
—
1
—
0
3
—
—
W.S. Central
—
2
37
—
—
—
0
1
—
—
—
0
0
—
—
Arkansas
—
2
17
—
—
—
0
1
—
—
—
0
0
—
—
Louisiana
—
0
1
—
—
—
0
1
—
—
—
0
0
—
—
Oklahoma
—
0
34
—
—
—
0
1
—
—
—
0
0
—
—
Texas
—
0
1
—
—
—
0
0
—
—
—
0
0
—
—
Mountain
—
0
1
—
—
—
0
1
—
—
—
0
1
—
—
Arizona
—
0
0
—
—
—
0
0
—
—
—
0
1
—
—
Colorado
N
0
0
N
N
N
0
0
N
N
N
0
0
N
N
Idaho
N
0
0
N
N
N
0
0
N
N
N
0
0
N
N
Montana
—
0
0
—
—
—
0
0
—
—
—
0
0
—
—
Nevada
—
0
0
—
—
—
0
1
—
—
—
0
0
—
—
New Mexico
N
0
0
N
N
N
0
0
N
N
N
0
0
N
N
Utah
—
0
1
—
—
—
0
0
—
—
—
0
0
—
—
Wyoming
—
0
0
—
—
—
0
0
—
—
—
0
0
—
—
Pacific
—
0
0
—
—
—
0
1
—
—
—
0
1
—
—
Alaska
N
0
0
N
N
N
0
0
N
N
N
0
0
N
N
California
—
0
0
—
—
—
0
0
—
—
—
0
1
—
—
Hawaii
N
0
0
N
N
N
0
0
N
N
N
0
0
N
N
Oregon
—
0
0
—
—
—
0
1
—
—
—
0
0
—
—
Washington
—
0
0
—
—
—
0
0
—
—
—
0
0
—
—
Territories
American Samoa
N
—
—
N
N
N
—
—
N
N
N
—
—
N
N
C.N.M.I.
—
—
—
—
—
—
—
—
—
—
—
—
—
—
—
Guam
N
0
0
N
N
N
0
0
N
N
N
0
0
N
N
Puerto Rico
N
0
0
N
N
N
0
0
N
N
N
0
0
N
N
U.S. Virgin Islands
—
0
0
—
—
—
0
0
—
—
—
0
0
—
—
C.N.M.I.: Commonwealth of Northern Mariana Islands.
U: Unavailable. —: No reported cases. N: Not reportable. NN: Not Nationally Notifiable. Cum: Cumulative year-to-date counts. Med: Median. Max: Maximum.
† Cumulative total E. ewingii cases reported for year 2013 = 27, and 0 cases reported for 2014.
TABLE II. (Continued) Provisional cases of selected notifiable diseases, United States, weeks ending February 15, 2014, and February 16, 2013 (7th week)* (Export data)
Reporting area
Giardiasis
Gonorrhea
Haemophilus influenzae, invasive† All ages, all serotypes
Current week
Previous 52 weeks
Cum 2014
Cum 2013
Current week
Previous 52 weeks
Cum 2014
Cum 2013
Current week
Previous 52 weeks
Cum 2014
Cum 2013
Med
Max
Med
Max
Med
Max
United States
121
248
416
1,149
1,624
2,841
6,519
7,129
34,376
46,380
35
66
90
401
637
New England
3
23
56
96
146
88
130
192
785
811
—
4
11
24
40
Connecticut
—
4
11
9
23
3
53
112
234
312
—
1
4
—
9
Maine
—
4
12
17
24
9
5
10
41
40
—
0
2
2
7
Massachusetts
2
11
26
61
85
76
61
100
437
384
—
2
8
17
19
New Hampshire
—
1
7
2
4
—
2
8
18
23
—
0
3
3
3
Rhode Island
—
0
7
—
1
—
5
42
52
38
—
0
9
—
—
Vermont
1
2
14
7
9
—
1
8
3
14
—
0
2
2
2
Mid. Atlantic
43
49
89
256
287
456
770
915
4,589
5,254
7
11
21
69
101
New Jersey
—
5
12
4
35
30
134
167
741
946
—
2
7
12
22
New York (Upstate)
21
18
51
92
77
133
120
304
591
742
—
3
15
14
18
New York City
13
14
24
85
87
106
250
309
1,492
1,893
4
2
7
17
21
Pennsylvania
9
14
27
75
88
187
271
327
1,765
1,673
3
4
9
26
40
E.N. Central
15
36
66
131
227
334
1,216
1,411
4,660
10,058
—
11
17
60
104
Illinois
—
6
23
10
29
9
497
638
561
4,426
—
3
6
6
29
Indiana
—
3
11
6
25
65
145
209
763
923
—
3
6
11
23
Michigan
3
10
27
31
54
89
190
276
1,032
1,690
—
2
5
9
14
Ohio
9
9
25
54
68
130
317
386
1,758
2,390
—
3
8
23
23
Wisconsin
3
7
15
30
51
41
82
122
546
629
—
1
4
11
15
W.N. Central
1
16
41
61
104
59
332
425
1,561
2,258
2
4
9
25
39
Iowa
1
4
15
19
20
3
28
41
147
223
—
0
0
—
—
Kansas
—
2
6
2
10
—
39
66
181
222
—
0
3
1
7
Minnesota
—
0
0
—
—
—
74
107
240
498
—
1
5
—
11
Missouri
—
5
15
18
38
22
150
184
768
967
—
2
6
20
14
Nebraska
—
3
9
17
22
32
25
48
146
207
1
0
3
3
5
North Dakota
—
0
3
1
3
2
8
15
40
58
1
0
2
1
2
South Dakota
—
2
9
4
11
—
14
27
39
83
—
0
1
—
—
S. Atlantic
29
46
101
263
283
865
1,383
1,754
8,400
9,877
13
17
27
116
179
Delaware
—
0
2
—
1
34
24
65
150
173
—
0
1
2
5
District of Columbia
—
0
3
1
12
—
47
85
—
234
—
0
2
1
3
Florida
17
20
56
123
138
219
397
493
2,642
2,811
10
5
13
52
40
Georgia
6
11
45
82
67
194
265
325
1,410
1,997
1
2
8
20
39
Maryland
4
4
9
36
29
32
111
174
411
567
1
2
5
11
18
North Carolina
N
0
0
N
N
200
266
460
2,003
1,978
1
3
8
21
28
South Carolina
—
2
7
9
13
46
143
279
1,091
1,017
—
1
7
1
31
Virginia
2
5
11
10
18
135
120
237
590
977
—
2
6
5
11
West Virginia
—
1
4
2
5
5
20
34
103
123
—
0
3
3
4
E.S. Central
—
3
8
18
23
309
452
600
2,370
3,624
4
4
12
28
54
Alabama
—
3
8
18
23
—
150
257
437
1,092
—
1
4
13
24
Kentucky
N
0
0
N
N
80
82
126
514
633
—
0
4
—
7
Mississippi
N
0
0
N
N
172
97
278
760
778
1
0
2
4
4
Tennessee
N
0
0
N
N
57
140
210
659
1,121
3
1
6
11
19
W.S. Central
1
6
15
26
29
113
984
1,164
4,536
6,868
5
3
11
25
22
Arkansas
1
2
7
9
5
104
71
108
491
591
—
0
3
8
—
Louisiana
—
4
11
17
24
—
151
328
98
485
—
0
6
4
9
Oklahoma
—
0
0
—
—
9
82
177
377
1,087
4
2
9
12
13
Texas
N
0
0
N
N
—
659
820
3,570
4,705
1
0
1
1
—
Mountain
2
17
37
71
128
49
282
396
2,016
1,619
2
5
14
35
64
Arizona
1
2
7
3
10
—
108
201
1,012
511
—
2
6
13
27
Colorado
—
3
18
30
38
40
56
90
410
419
—
1
4
6
17
Idaho
—
2
9
6
16
—
3
15
15
14
—
0
2
3
2
Montana
1
2
6
7
6
4
4
10
33
23
—
0
1
1
1
Nevada
—
1
6
5
8
—
51
85
268
316
—
0
1
1
3
New Mexico
—
2
6
3
14
—
36
78
120
245
1
1
3
5
9
Utah
—
4
9
15
24
5
21
31
152
88
1
1
2
6
4
Wyoming
—
0
6
2
12
—
1
3
6
3
—
0
1
—
1
Pacific
27
52
125
227
397
568
891
1,104
5,459
6,011
2
3
8
19
34
Alaska
—
1
7
4
4
8
21
39
162
124
1
0
3
2
3
California
25
31
102
185
323
446
749
950
4,513
4,894
1
1
2
6
11
Hawaii
—
1
3
3
5
—
13
21
43
134
—
0
2
1
2
Oregon
2
6
17
29
46
32
33
59
275
261
—
1
5
10
17
Washington
—
10
57
6
19
82
77
113
466
598
—
0
2
—
1
Territories
American Samoa
—
—
—
—
—
—
—
—
—
—
—
—
—
—
—
C.N.M.I.
—
—
—
—
—
—
—
—
—
—
—
—
—
—
—
Guam
—
0
0
—
—
—
0
0
—
—
—
0
0
—
—
Puerto Rico
—
0
4
—
3
—
6
21
24
36
—
0
0
—
—
U.S. Virgin Islands
—
0
0
—
—
—
1
5
—
8
—
0
0
—
—
C.N.M.I.: Commonwealth of Northern Mariana Islands.
U: Unavailable. —: No reported cases. N: Not reportable. NN: Not Nationally Notifiable. Cum: Cumulative year-to-date counts. Med: Median. Max: Maximum.
† Data for H. influenzae (age <5 yrs for serotype b, nonserotype b, and unknown serotype) are available in Table I.
TABLE II. (Continued) Provisional cases of selected notifiable diseases, United States, weeks ending February 15, 2014, and February 16, 2013 (7th week)* (Export data)
Reporting area
Hepatitis (viral, acute), by type
A
B
C
Current week
Previous 52 weeks
Cum 2014
Cum 2013
Current week
Previous 52 weeks
Cum 2014
Cum 2013
Current week
Previous 52 weeks
Cum 2014
Cum 2013
Med
Max
Med
Max
Med
Max
United States
9
29
56
86
176
16
55
74
223
364
12
34
57
108
209
New England
—
2
5
4
8
—
1
5
—
8
—
3
8
3
28
Connecticut
—
0
2
1
1
—
0
1
—
—
—
0
0
—
—
Maine
—
0
2
—
—
—
0
1
—
3
—
0
1
2
1
Massachusetts
—
0
3
1
6
—
1
4
—
5
—
3
7
1
26
New Hampshire
—
0
1
—
—
—
0
2
—
—
N
0
0
N
N
Rhode Island
—
0
1
1
—
U
0
0
U
U
U
0
0
U
U
Vermont
—
0
2
1
1
—
0
1
—
—
—
0
1
—
1
Mid. Atlantic
3
4
12
10
25
2
4
10
23
32
5
4
11
16
30
New Jersey
—
0
2
—
4
—
0
3
—
7
—
0
3
—
8
New York (Upstate)
—
1
5
2
7
—
1
3
5
5
4
2
9
7
8
New York City
3
1
7
7
8
1
1
4
6
11
—
0
1
—
1
Pennsylvania
—
1
4
1
6
1
1
4
12
9
1
1
6
9
13
E.N. Central
—
5
12
13
42
8
9
15
51
57
3
7
30
32
35
Illinois
—
1
5
3
9
—
1
4
1
14
—
0
4
1
5
Indiana
—
0
2
—
2
—
2
6
6
7
—
3
8
1
10
Michigan
—
1
7
4
13
—
1
5
2
12
—
2
7
3
11
Ohio
—
1
4
6
15
8
4
11
41
22
3
1
24
27
4
Wisconsin
—
1
3
—
3
—
0
2
1
2
—
1
3
—
5
W.N. Central
2
1
6
8
6
—
2
5
8
10
—
0
5
2
4
Iowa
—
0
3
1
1
—
0
2
—
1
—
0
0
—
—
Kansas
—
0
3
—
1
—
0
3
—
1
—
0
3
—
—
Minnesota
—
0
0
—
—
—
0
0
—
—
—
0
0
—
—
Missouri
2
0
2
5
1
—
1
4
6
8
—
0
4
2
4
Nebraska
—
0
2
1
2
—
0
2
1
—
—
0
1
—
—
North Dakota
—
0
2
1
1
—
0
1
1
—
—
0
1
—
—
South Dakota
—
0
1
—
—
—
0
1
—
—
—
0
1
—
—
S. Atlantic
1
5
15
19
37
4
17
26
76
113
2
7
21
25
38
Delaware
—
0
1
—
—
—
0
1
—
3
U
0
0
U
U
District of Columbia
—
0
0
—
—
—
0
0
—
—
—
0
0
—
—
Florida
—
2
7
11
4
2
6
13
34
40
1
2
7
7
14
Georgia
—
1
3
3
11
—
2
6
8
17
—
0
3
1
3
Maryland
—
0
4
1
2
—
1
4
2
6
—
1
3
2
12
North Carolina
—
0
4
—
8
—
0
16
5
5
—
1
15
10
2
South Carolina
—
0
1
—
2
—
1
5
1
3
—
0
0
—
—
Virginia
1
0
3
3
10
—
1
5
4
11
1
0
5
4
1
West Virginia
—
0
1
1
—
2
3
8
22
28
—
0
6
1
6
E.S. Central
—
1
4
8
13
2
12
17
47
80
2
6
14
20
50
Alabama
—
0
2
1
—
—
1
5
12
10
—
0
5
3
1
Kentucky
—
0
2
2
7
—
4
8
7
24
—
3
10
9
35
Mississippi
—
0
1
2
1
—
1
4
3
10
U
0
0
U
U
Tennessee
—
0
2
3
5
2
5
11
25
36
2
2
7
8
14
W.S. Central
3
2
6
8
8
—
5
10
10
28
—
2
8
3
7
Arkansas
—
0
2
—
—
—
1
3
1
8
—
0
3
—
—
Louisiana
—
0
2
—
3
—
1
8
2
7
—
0
2
—
3
Oklahoma
—
0
4
1
—
—
0
4
1
1
—
0
5
3
—
Texas
3
2
5
7
5
—
3
7
6
12
—
0
4
—
4
Mountain
—
2
16
4
10
—
1
4
2
14
—
1
5
3
5
Arizona
—
1
6
—
6
—
0
3
—
6
U
0
0
U
U
Colorado
—
0
8
1
3
—
0
1
—
2
—
0
1
2
1
Idaho
—
0
2
—
—
—
0
2
—
1
—
0
2
1
1
Montana
—
0
1
—
—
—
0
1
—
—
—
0
2
—
1
Nevada
—
0
3
1
—
—
0
3
2
4
—
0
2
—
1
New Mexico
—
0
2
1
1
—
0
1
—
1
—
0
1
—
—
Utah
—
0
2
1
—
—
0
1
—
—
—
0
1
—
1
Wyoming
—
0
0
—
—
—
0
0
—
—
—
0
0
—
—
Pacific
—
6
18
12
27
—
3
11
6
22
—
2
7
4
12
Alaska
—
0
1
—
—
—
0
1
—
—
—
0
0
—
—
California
—
3
17
10
21
—
2
5
4
18
—
1
5
1
10
Hawaii
—
0
4
—
1
—
0
1
—
—
—
0
0
—
—
Oregon
—
0
3
2
3
—
0
4
1
4
—
0
1
—
—
Washington
—
0
4
—
2
—
0
9
1
—
—
1
6
3
2
Territories
American Samoa
—
—
—
—
—
—
—
—
—
—
—
—
—
—
—
C.N.M.I.
—
—
—
—
—
—
—
—
—
—
—
—
—
—
—
Guam
—
0
0
—
—
—
0
0
—
—
—
0
0
—
—
Puerto Rico
—
0
2
1
—
—
0
6
—
5
N
0
0
N
N
U.S. Virgin Islands
—
0
0
—
—
—
0
0
—
—
—
0
0
—
—
C.N.M.I.: Commonwealth of Northern Mariana Islands.
U: Unavailable. —: No reported cases. N: Not reportable. NN: Not Nationally Notifiable. Cum: Cumulative year-to-date counts. Med: Median. Max: Maximum.
TABLE II. (Continued) Provisional cases of selected notifiable diseases, United States, weeks ending February 15, 2014, and February 16, 2013 (7th week)* (Export data)
Reporting area
Invasive Pneumococcal disease†
Legionellosis
All ages
Age <5
Current week
Previous 52 weeks
Cum 2014
Cum 2013
Current week
Previous 52 weeks
Cum 2014
Cum 2013
Current week
Previous 52 weeks
Cum 2014
Cum 2013
Med
Max
Med
Max
Med
Max
United States
206
282
556
2,118
3,432
8
20
40
98
164
25
70
267
262
369
New England
3
10
33
46
145
—
0
3
1
5
1
5
25
23
19
Connecticut
—
4
14
2
86
—
0
2
—
1
—
1
10
3
2
Maine
3
2
6
23
24
—
0
1
—
1
—
0
3
2
2
Massachusetts
—
0
2
2
3
—
0
2
1
3
1
2
20
15
10
New Hampshire
—
1
5
7
15
—
0
1
—
—
—
0
3
1
—
Rhode Island
—
0
18
4
—
—
0
0
—
—
—
0
9
1
3
Vermont
—
1
4
8
17
—
0
0
—
—
—
0
2
1
2
Mid. Atlantic
28
33
74
207
492
—
2
6
4
25
8
16
122
55
74
New Jersey
—
6
21
—
142
—
0
2
—
7
—
2
20
—
17
New York (Upstate)
16
18
37
105
184
—
1
4
2
10
1
6
40
14
14
New York City
12
11
25
102
166
—
0
3
2
8
3
3
47
13
14
Pennsylvania
N
—
—
N
N
N
0
0
N
N
4
7
26
28
29
E.N. Central
28
53
107
343
664
2
3
9
10
16
3
17
104
59
68
Illinois
N
0
0
N
N
—
1
3
2
3
—
4
32
5
10
Indiana
—
11
28
31
128
—
0
3
—
—
—
3
11
9
22
Michigan
3
12
28
78
151
—
1
4
4
5
—
3
21
5
3
Ohio
23
21
47
173
279
1
1
4
3
6
3
6
66
37
30
Wisconsin
2
8
15
61
106
1
0
3
1
2
—
2
11
3
3
W.N. Central
7
14
29
68
224
2
1
4
6
16
—
2
13
6
14
Iowa
N
0
0
N
N
N
0
0
N
N
—
0
2
—
—
Kansas
—
2
6
14
47
N
0
0
N
N
—
0
3
—
1
Minnesota
—
4
16
—
105
—
0
2
—
7
—
0
2
—
4
Missouri
N
0
0
N
N
—
0
3
1
5
—
1
11
4
5
Nebraska
4
2
8
30
27
2
0
1
4
3
—
0
3
—
3
North Dakota
—
1
5
8
20
—
0
1
1
1
—
0
1
1
—
South Dakota
3
2
5
16
25
N
0
0
N
N
—
0
1
1
1
S. Atlantic
63
60
126
572
732
—
5
14
30
43
5
12
43
61
59
Delaware
—
0
3
3
4
—
0
1
—
—
—
0
4
—
—
District of Columbia
3
1
7
13
9
—
0
1
—
—
N
0
0
N
N
Florida
42
18
42
203
242
—
1
5
7
14
3
4
16
30
27
Georgia
3
16
44
150
222
—
1
5
9
13
—
1
5
2
7
Maryland
10
8
26
86
87
—
1
4
8
3
1
2
14
10
9
North Carolina
—
0
0
—
—
N
0
0
N
N
—
2
9
7
8
South Carolina
5
7
27
94
81
—
0
2
4
2
—
0
3
3
1
Virginia
—
0
3
2
6
—
0
3
2
6
—
2
9
7
6
West Virginia
—
4
14
21
81
—
0
2
—
5
1
0
4
2
1
E.S. Central
26
24
59
247
303
—
2
5
14
12
—
3
13
11
13
Alabama
3
3
9
34
44
—
0
2
2
4
—
0
10
—
1
Kentucky
3
4
11
42
53
—
0
1
1
—
—
1
4
5
2
Mississippi
7
4
13
46
47
—
0
2
5
3
—
0
2
—
3
Tennessee
13
13
37
125
159
—
1
5
6
5
—
1
7
6
7
W.S. Central
23
34
264
247
366
2
3
17
19
21
6
3
16
21
21
Arkansas
—
3
21
17
46
—
0
2
—
—
2
0
3
3
2
Louisiana
—
5
16
58
56
—
0
2
3
4
—
0
3
2
6
Oklahoma
—
0
1
2
2
—
0
1
2
2
—
0
3
—
—
Texas
23
24
241
170
262
2
2
17
14
15
4
3
16
16
13
Mountain
26
32
80
366
479
1
2
7
11
22
—
2
9
6
23
Arizona
18
14
43
199
216
—
0
3
6
10
—
1
4
—
8
Colorado
—
6
24
88
111
—
0
2
2
5
—
0
3
—
4
Idaho
N
0
0
N
N
—
0
1
—
1
—
0
2
1
1
Montana
—
0
3
7
5
—
0
1
—
1
—
0
2
2
1
Nevada
—
2
7
21
29
—
0
1
—
—
—
0
3
—
1
New Mexico
8
5
13
48
73
1
0
1
3
3
—
0
2
—
4
Utah
—
2
8
—
41
—
0
2
—
2
—
0
3
3
4
Wyoming
—
0
3
3
4
—
0
1
—
—
—
0
0
—
—
Pacific
2
4
7
22
27
1
0
2
3
4
2
5
12
20
78
Alaska
2
2
6
12
16
1
0
2
2
3
—
0
1
—
—
California
N
0
0
N
N
N
0
0
N
N
2
4
11
18
73
Hawaii
—
1
4
10
11
—
0
1
1
1
—
0
1
—
1
Oregon
N
0
0
N
N
N
0
0
N
N
—
0
3
2
3
Washington
N
0
0
N
N
N
0
0
N
N
—
0
6
—
1
Territories
American Samoa
N
—
—
N
N
—
—
—
—
—
N
—
—
N
N
C.N.M.I.
—
—
—
—
—
—
—
—
—
—
—
—
—
—
—
Guam
—
0
0
—
—
—
0
0
—
—
—
0
0
—
—
Puerto Rico
—
0
0
—
—
—
0
0
—
—
—
0
2
—
2
U.S. Virgin Islands
—
0
0
—
—
—
0
0
—
—
—
0
0
—
—
C.N.M.I.: Commonwealth of Northern Mariana Islands.
U: Unavailable. —: No reported cases. N: Not reportable. NN: Not Nationally Notifiable. Cum: Cumulative year-to-date counts. Med: Median. Max: Maximum.
† Includes drug resistant and susceptible cases of Invasive Pneumococcal Disease. This condition was previously named Streptococcus pneumoniae invasive disease and cases were reported to CDC using different event codes to specify whether the cases were drug resistant or in a defined age group, such as <5 years. Since 2010, case notifications for this condition were consolidated under one event code for Invasive pneumococcal disease
TABLE II. (Continued) Provisional cases of selected notifiable diseases, United States, weeks ending February 15, 2014, and February 16, 2013 (7th week)* (Export data)
Reporting area
Lyme disease
Malaria
Meningococcal disease, invasive† All serogroups
Current week
Previous 52 weeks
Cum 2014
Cum 2013
Current week
Previous 52 weeks
Cum 2014
Cum 2013
Current week
Previous 52 weeks
Cum 2014
Cum 2013
Med
Max
Med
Max
Med
Max
United States
27
397
2,256
441
1,437
10
26
51
103
143
3
9
22
58
110
New England
—
126
912
66
422
—
2
8
6
9
—
0
3
1
6
Connecticut
—
30
251
7
170
—
0
0
—
—
—
0
1
—
1
Maine
—
15
99
17
25
—
0
2
2
—
—
0
1
—
1
Massachusetts
—
45
471
21
170
—
1
4
2
7
—
0
3
1
2
New Hampshire
—
6
91
—
36
—
0
2
1
2
—
0
1
—
1
Rhode Island
—
9
54
—
3
—
0
8
1
—
—
0
0
—
1
Vermont
—
8
93
21
18
—
0
3
—
—
—
0
1
—
—
Mid. Atlantic
19
191
1,004
282
706
3
8
21
34
27
—
1
7
3
11
New Jersey
—
45
224
26
298
—
1
5
—
7
—
0
2
—
3
New York (Upstate)
6
46
258
53
44
—
1
5
6
7
—
0
3
1
3
New York City
3
2
40
3
3
3
4
13
21
11
—
0
2
1
3
Pennsylvania
10
79
539
200
361
—
1
5
7
2
—
0
3
1
2
E.N. Central
—
19
223
16
48
3
2
8
10
16
—
0
4
1
6
Illinois
—
2
30
—
5
—
1
5
1
5
—
0
2
—
2
Indiana
—
1
13
—
—
—
0
2
—
3
—
0
1
—
3
Michigan
—
2
14
3
3
1
0
2
3
3
—
0
1
1
1
Ohio
—
1
7
1
5
2
1
3
6
4
—
0
2
—
—
Wisconsin
—
15
184
12
35
—
0
3
—
1
—
0
1
—
—
W.N. Central
—
3
31
3
4
—
0
3
7
7
—
0
3
4
8
Iowa
—
2
27
1
1
—
0
2
3
1
—
0
1
1
—
Kansas
—
0
4
—
2
—
0
1
—
2
—
0
1
—
—
Minnesota
—
0
0
—
—
—
0
0
—
—
—
0
2
—
3
Missouri
—
0
3
—
1
—
0
1
2
1
—
0
2
2
3
Nebraska
—
0
3
2
—
—
0
2
1
1
—
0
1
—
—
North Dakota
—
0
5
—
—
—
0
1
1
1
—
0
1
—
—
South Dakota
—
0
1
—
—
—
0
3
—
1
—
0
1
1
2
S. Atlantic
8
46
258
69
234
3
6
17
24
52
—
1
6
17
31
Delaware
1
7
23
18
43
—
0
2
1
—
—
0
1
1
—
District of Columbia
N
0
0
N
N
—
0
2
—
2
—
0
1
—
1
Florida
2
2
14
9
11
—
1
3
6
11
—
1
3
9
14
Georgia
—
0
2
—
5
—
1
5
—
9
—
0
2
2
4
Maryland
4
18
76
25
155
3
2
10
12
24
—
0
1
1
2
North Carolina
—
1
32
3
—
—
0
6
1
—
—
0
2
3
5
South Carolina
—
0
2
—
—
—
0
2
—
—
—
0
1
—
—
Virginia
1
17
221
12
17
—
1
6
4
6
—
0
2
1
3
West Virginia
—
1
19
2
3
—
0
1
—
—
—
0
0
—
2
E.S. Central
—
1
9
2
5
—
1
4
6
6
—
0
2
2
3
Alabama
—
0
3
—
2
—
0
1
—
1
—
0
1
—
—
Kentucky
—
0
9
1
2
—
0
1
2
3
—
0
1
1
1
Mississippi
—
0
0
—
—
—
0
1
—
—
—
0
1
—
2
Tennessee
—
0
3
1
1
—
0
3
4
2
—
0
1
1
—
W.S. Central
—
1
7
—
3
—
1
7
1
7
1
1
3
6
4
Arkansas
—
0
0
—
—
—
0
1
—
—
—
0
1
—
1
Louisiana
—
0
0
—
—
—
0
1
—
1
—
0
1
1
—
Oklahoma
—
0
1
—
—
—
0
3
—
—
—
0
2
2
—
Texas
—
1
7
—
3
—
1
7
1
6
1
0
3
3
3
Mountain
—
2
9
1
5
—
1
6
2
8
1
0
4
5
4
Arizona
—
0
3
—
—
—
0
3
2
4
—
0
3
3
2
Colorado
—
0
0
—
—
—
0
2
—
2
—
0
1
1
1
Idaho
—
0
2
1
4
—
0
1
—
—
—
0
1
—
—
Montana
—
0
3
—
1
—
0
0
—
—
1
0
1
1
—
Nevada
—
0
2
—
—
—
0
1
—
2
—
0
1
—
—
New Mexico
—
0
3
—
—
—
0
0
—
—
—
0
1
—
—
Utah
—
0
3
—
—
—
0
2
—
—
—
0
2
—
—
Wyoming
—
0
1
—
—
—
0
0
—
—
—
0
1
—
1
Pacific
—
3
9
2
10
1
3
9
13
11
1
2
8
19
37
Alaska
—
0
4
1
1
—
0
1
—
—
—
0
0
—
—
California
—
1
6
—
7
1
2
8
13
10
1
2
6
7
31
Hawaii
N
0
0
N
N
—
0
1
—
—
—
0
1
1
—
Oregon
—
1
3
1
2
—
0
1
—
—
—
0
3
8
3
Washington
—
0
3
—
—
—
0
3
—
1
—
0
5
3
3
Territories
American Samoa
N
—
—
N
N
—
—
—
—
—
—
—
—
—
—
C.N.M.I.
—
—
—
—
—
—
—
—
—
—
—
—
—
—
—
Guam
—
0
0
—
—
—
0
0
—
—
—
0
0
—
—
Puerto Rico
N
0
0
N
N
—
0
0
—
—
—
0
1
1
—
U.S. Virgin Islands
N
0
0
N
N
—
0
0
—
—
—
0
0
—
—
C.N.M.I.: Commonwealth of Northern Mariana Islands.
U: Unavailable. —: No reported cases. N: Not reportable. NN: Not Nationally Notifiable. Cum: Cumulative year-to-date counts. Med: Median. Max: Maximum.
† Data for meningococcal disease, invasive caused by serogroups A, C, Y, and W-135; serogroup B; other serogroup; and unknown serogroup are available in Table I.
TABLE II. (Continued) Provisional cases of selected notifiable diseases, United States, weeks ending February 15, 2014, and February 16, 2013 (7th week)* (Export data)
Reporting area
Mumps
Pertussis
Rabies, animal
Current week
Previous 52 weeks
Cum 2014
Cum 2013
Current week
Previous 52 weeks
Cum 2014
Cum 2013
Current week
Previous 52 weeks
Cum 2014
Cum 2013
Med
Max
Med
Max
Med
Max
United States
—
7
54
28
35
132
506
731
2,048
2,917
9
64
131
133
310
New England
—
0
25
—
2
3
18
38
40
191
—
5
12
11
31
Connecticut
—
0
2
—
1
—
1
6
—
4
—
3
12
4
12
Maine
—
0
0
—
1
2
5
12
25
70
—
1
4
2
6
Massachusetts
—
0
25
—
—
—
6
22
7
29
—
0
0
—
—
New Hampshire
—
0
0
—
—
—
1
9
2
22
—
0
3
1
3
Rhode Island
—
0
1
—
—
—
1
16
4
21
—
0
4
1
2
Vermont
—
0
1
—
—
1
1
8
2
45
—
1
4
3
8
Mid. Atlantic
—
1
20
5
6
13
31
51
148
328
1
6
19
28
34
New Jersey
—
0
19
1
—
—
5
13
—
90
—
0
0
—
—
New York (Upstate)
—
0
2
1
—
9
13
37
73
112
1
6
19
28
34
New York City
—
0
4
3
3
—
2
10
2
19
—
0
0
—
—
Pennsylvania
—
0
5
—
3
4
12
20
73
107
—
0
0
—
—
E.N. Central
—
1
6
13
6
42
95
193
598
540
—
2
24
—
4
Illinois
—
0
4
5
3
—
13
35
46
96
—
0
6
—
3
Indiana
—
0
1
1
—
—
10
29
17
48
—
0
1
—
—
Michigan
—
0
1
1
1
4
20
38
84
66
—
0
5
—
1
Ohio
—
0
2
6
2
37
25
104
383
114
—
0
19
—
—
Wisconsin
—
0
1
—
—
1
22
53
68
216
N
0
0
N
N
W.N. Central
—
0
2
2
1
7
41
87
120
303
1
2
9
4
9
Iowa
—
0
1
—
—
—
4
12
11
68
—
0
0
—
—
Kansas
—
0
1
1
—
—
6
20
7
26
—
1
5
1
5
Minnesota
—
0
2
—
—
—
11
37
—
110
—
0
0
—
—
Missouri
—
0
2
1
1
3
10
33
53
66
—
0
3
1
4
Nebraska
—
0
0
—
—
4
5
13
40
24
—
0
0
—
—
North Dakota
—
0
1
—
—
—
1
7
1
2
—
0
0
—
—
South Dakota
—
0
0
—
—
—
1
8
8
7
1
0
4
2
—
S. Atlantic
—
1
37
4
1
20
49
92
347
229
4
17
31
38
181
Delaware
—
0
0
—
—
3
0
30
81
8
—
0
0
—
—
District of Columbia
—
0
1
—
—
1
0
4
4
7
—
0
0
—
—
Florida
—
0
1
—
—
6
14
63
107
46
4
0
5
14
98
Georgia
—
0
4
4
—
—
4
11
22
50
—
0
0
—
—
Maryland
—
0
26
—
—
1
3
10
15
30
—
7
17
23
28
North Carolina
—
0
1
—
—
6
11
29
82
30
—
0
0
—
—
South Carolina
—
0
1
—
—
1
4
8
10
26
—
0
0
—
—
Virginia
—
0
18
—
1
2
7
22
21
30
—
7
15
—
50
West Virginia
—
0
0
—
—
—
0
3
5
2
—
1
6
1
5
E.S. Central
—
0
3
1
3
5
15
36
107
117
—
1
4
6
3
Alabama
—
0
1
—
1
1
3
8
22
26
—
1
3
4
3
Kentucky
—
0
0
—
1
2
6
28
46
44
—
0
3
2
—
Mississippi
—
0
0
—
—
—
1
4
4
8
—
0
2
—
—
Tennessee
—
0
3
1
1
2
5
10
35
39
—
0
0
—
—
W.S. Central
—
0
3
1
3
30
82
335
168
136
3
17
77
46
42
Arkansas
—
0
1
—
—
1
8
24
23
43
—
1
34
11
10
Louisiana
—
0
1
—
1
—
3
11
6
5
—
0
0
—
—
Oklahoma
—
0
1
—
—
—
0
36
1
5
—
0
31
3
—
Texas
—
0
3
1
2
29
68
311
138
83
3
16
50
32
32
Mountain
—
0
2
2
2
7
92
175
347
731
—
0
9
—
—
Arizona
—
0
1
1
—
—
21
70
34
186
N
0
0
N
N
Colorado
—
0
1
1
1
—
20
46
166
175
—
0
0
—
—
Idaho
—
0
0
—
—
5
4
14
30
30
—
0
4
—
—
Montana
—
0
0
—
—
1
11
27
30
89
N
0
0
N
N
Nevada
—
0
2
—
—
1
2
12
19
12
—
0
3
—
—
New Mexico
—
0
1
—
—
—
9
23
20
107
—
0
1
—
—
Utah
—
0
1
—
1
—
22
41
48
132
—
0
4
—
—
Wyoming
—
0
0
—
—
—
1
12
—
—
—
0
0
—
—
Pacific
—
0
2
—
11
5
62
112
173
342
—
3
12
—
6
Alaska
—
0
1
—
—
—
5
12
4
99
—
0
2
—
1
California
—
0
2
—
11
5
35
67
140
140
—
3
11
—
4
Hawaii
—
0
1
—
—
—
1
4
—
1
—
0
0
—
—
Oregon
—
0
1
—
—
—
8
26
28
54
—
0
2
—
1
Washington
—
0
1
—
—
—
12
52
1
48
—
0
0
—
—
Territories
American Samoa
—
—
—
—
—
—
—
—
—
—
N
—
—
N
N
C.N.M.I.
—
—
—
—
—
—
—
—
—
—
—
—
—
—
—
Guam
—
0
0
—
—
—
0
0
—
—
—
0
0
—
—
Puerto Rico
—
0
1
—
1
—
0
6
2
1
—
0
0
—
—
U.S. Virgin Islands
—
0
0
—
—
—
0
0
—
—
—
0
0
—
—
C.N.M.I.: Commonwealth of Northern Mariana Islands.
U: Unavailable. —: No reported cases. N: Not reportable. NN: Not Nationally Notifiable. Cum: Cumulative year-to-date counts. Med: Median. Max: Maximum.
TABLE II. (Continued) Provisional cases of selected notifiable diseases, United States, weeks ending February 15, 2014, and February 16, 2013 (7th week)* (Export data)
Reporting area
Salmonellosis
Shiga toxin-producing E. coli (STEC)†
Shigellosis
Current week
Previous 52 weeks
Cum 2014
Cum 2013
Current week
Previous 52 weeks
Cum 2014
Cum 2013
Current week
Previous 52 weeks
Cum 2014
Cum 2013
Med
Max
Med
Max
Med
Max
United States
210
914
1,547
2,655
3,355
26
116
269
242
390
96
227
407
1,249
982
New England
2
39
80
131
124
1
4
12
9
15
1
4
94
24
24
Connecticut
—
7
21
19
32
—
1
7
2
3
—
1
5
4
3
Maine
—
2
11
6
6
—
0
4
—
—
1
0
1
2
—
Massachusetts
1
21
55
77
60
—
2
8
4
9
—
2
11
17
18
New Hampshire
—
3
11
8
12
—
0
2
1
3
—
0
1
1
1
Rhode Island
1
2
13
5
5
—
0
2
—
—
—
0
86
—
—
Vermont
—
1
6
16
9
1
0
3
2
—
—
0
1
—
2
Mid. Atlantic
29
96
197
237
370
2
14
38
22
44
9
15
28
70
118
New Jersey
—
18
46
8
80
—
2
8
—
11
—
2
7
6
14
New York (Upstate)
7
25
50
79
73
1
4
10
9
10
6
4
14
27
41
New York City
17
20
52
87
98
1
2
8
4
7
2
6
14
28
46
Pennsylvania
5
28
64
63
119
—
5
19
9
16
1
2
9
9
17
E.N. Central
20
100
171
232
463
4
15
47
21
90
3
22
39
82
276
Illinois
—
31
65
53
166
—
4
32
8
19
—
5
16
3
15
Indiana
—
14
27
7
56
—
2
7
—
16
—
2
8
3
9
Michigan
2
18
42
44
84
—
3
14
3
18
—
3
8
7
30
Ohio
18
23
42
119
82
4
3
15
10
13
3
10
28
66
215
Wisconsin
—
13
29
9
75
—
2
12
—
24
—
0
3
3
7
W.N. Central
4
46
93
112
184
1
10
38
16
50
2
7
74
160
28
Iowa
—
10
36
33
42
—
2
14
2
10
—
3
43
33
7
Kansas
—
7
18
12
27
—
1
6
—
7
—
0
4
1
5
Minnesota
—
0
0
—
—
—
0
0
—
—
—
0
0
—
—
Missouri
4
18
38
41
75
1
4
18
9
26
—
2
9
20
4
Nebraska
—
5
20
12
16
—
1
7
3
4
1
1
4
2
9
North Dakota
—
2
7
6
8
—
0
3
1
—
—
0
2
3
3
South Dakota
—
3
10
8
16
—
0
5
1
3
1
0
29
101
—
S. Atlantic
77
241
446
1,089
901
5
11
20
48
46
45
50
160
454
141
Delaware
—
1
7
5
9
—
0
2
—
—
—
0
2
4
1
District of Columbia
—
0
3
—
6
—
0
1
—
1
—
0
2
—
2
Florida
50
105
226
516
420
4
3
7
22
10
34
20
46
160
43
Georgia
3
34
101
118
149
—
2
10
6
12
3
16
36
86
56
Maryland
14
16
37
86
85
1
1
8
9
9
2
2
6
22
8
North Carolina
8
37
136
228
97
—
1
8
8
5
6
2
119
160
11
South Carolina
1
20
52
62
75
—
0
2
1
—
—
3
6
10
11
Virginia
1
19
42
64
45
—
2
7
2
5
—
2
8
12
8
West Virginia
—
3
9
10
15
—
0
3
—
4
—
0
2
—
1
E.S. Central
10
58
138
168
225
—
5
18
15
26
8
20
66
178
57
Alabama
2
17
69
38
70
—
1
3
1
5
3
5
14
30
16
Kentucky
—
9
21
31
47
—
2
9
7
8
1
1
6
8
13
Mississippi
—
13
41
40
48
—
0
4
1
1
—
4
13
22
21
Tennessee
8
16
36
59
60
—
2
6
6
12
4
10
50
118
7
W.S. Central
28
119
361
201
308
12
13
34
66
32
15
46
220
129
154
Arkansas
3
13
35
21
30
1
1
6
7
2
4
5
23
24
9
Louisiana
—
19
43
30
71
—
0
2
—
3
—
5
21
8
18
Oklahoma
5
12
49
44
32
1
1
10
3
2
3
3
13
10
22
Texas
20
72
345
106
175
10
10
29
56
25
8
27
192
87
105
Mountain
3
50
248
150
200
1
10
59
16
37
—
11
39
56
54
Arizona
3
18
33
49
69
—
2
45
—
13
—
6
28
27
29
Colorado
—
6
27
38
39
—
0
11
—
11
—
1
5
9
6
Idaho
—
2
9
11
8
1
2
6
8
5
—
0
3
3
—
Montana
—
2
9
10
8
—
1
5
1
—
—
0
10
1
—
Nevada
—
4
205
3
24
—
1
3
1
5
—
0
7
5
7
New Mexico
—
6
14
15
29
—
0
3
4
—
—
1
5
3
7
Utah
—
6
14
22
20
—
1
9
2
3
—
0
2
6
4
Wyoming
—
1
4
2
3
—
0
7
—
—
—
0
2
2
1
Pacific
37
114
217
335
580
—
18
51
29
50
13
21
47
96
130
Alaska
1
2
5
10
—
—
0
0
—
—
—
0
1
1
—
California
36
87
171
258
512
—
10
27
19
40
13
17
47
82
108
Hawaii
—
7
13
38
21
—
0
5
2
1
—
0
6
2
8
Oregon
—
6
25
21
19
—
3
14
6
5
—
1
4
3
6
Washington
—
10
59
8
28
—
3
36
2
4
—
1
10
8
8
Territories
American Samoa
—
—
—
—
—
—
—
—
—
—
—
—
—
—
—
C.N.M.I.
—
—
—
—
—
—
—
—
—
—
—
—
—
—
—
Guam
—
0
0
—
—
—
0
0
—
—
—
0
0
—
—
Puerto Rico
1
7
43
9
47
—
0
6
2
—
—
0
1
—
—
U.S. Virgin Islands
—
0
0
—
—
—
0
0
—
—
—
0
0
—
—
C.N.M.I.: Commonwealth of Northern Mariana Islands.
U: Unavailable. —: No reported cases. N: Not reportable. NN: Not Nationally Notifiable. Cum: Cumulative year-to-date counts. Med: Median. Max: Maximum.
† Includes E. coli O157:H7; Shiga toxin-positive, serogroup non-O157; and Shiga toxin-positive, not serogrouped.
TABLE II. (Continued) Provisional cases of selected notifiable diseases, United States, weeks ending February 15, 2014, and February 16, 2013 (7th week)* (Export data)
Reporting area
Spotted Fever Rickettsiosis (including RMSF)†
Syphilis, primary and secondary
Confirmed
Probable
Current week
Previous 52 weeks
Cum 2014
Cum 2013
Current week
Previous 52 weeks
Cum 2014
Cum 2013
Current week
Previous 52 weeks
Cum 2014
Cum 2013
Med
Max
Med
Max
Med
Max
United States
—
2
10
5
17
2
40
183
35
68
80
324
470
1,429
2,075
New England
—
0
1
—
—
—
0
2
—
1
1
9
19
36
69
Connecticut
—
0
0
—
—
—
0
0
—
—
—
1
6
6
8
Maine
—
0
0
—
—
—
0
1
—
—
—
0
1
2
—
Massachusetts
—
0
0
—
—
—
0
1
—
—
1
6
18
21
51
New Hampshire
—
0
1
—
—
—
0
1
—
1
—
0
3
2
4
Rhode Island
—
0
0
—
—
—
0
2
—
—
—
1
5
5
4
Vermont
—
0
0
—
—
—
0
0
—
—
—
0
1
—
2
Mid. Atlantic
—
0
1
1
2
1
1
6
1
11
13
39
58
187
273
New Jersey
—
0
1
—
1
—
0
4
—
8
—
3
9
6
33
New York (Upstate)
—
0
1
1
—
1
0
3
1
—
6
5
36
33
30
New York City
—
0
1
—
—
—
0
1
—
1
3
21
35
108
150
Pennsylvania
—
0
1
—
1
—
0
3
—
2
4
9
16
40
60
E.N. Central
—
0
2
—
—
1
2
14
3
7
2
35
57
87
261
Illinois
—
0
1
—
—
—
1
8
—
1
—
11
29
12
117
Indiana
—
0
1
—
—
—
0
4
—
4
2
4
10
12
22
Michigan
—
0
1
—
—
—
0
1
—
—
—
8
17
16
55
Ohio
—
0
1
—
—
1
0
2
3
1
—
8
14
39
55
Wisconsin
—
0
1
—
—
—
0
2
—
1
—
1
5
8
12
W.N. Central
—
0
1
1
—
—
3
26
2
2
—
13
25
60
82
Iowa
—
0
0
—
—
—
0
2
—
—
—
1
6
2
10
Kansas
—
0
0
—
—
—
0
0
—
—
—
1
4
3
4
Minnesota
—
0
0
—
—
—
0
0
—
—
—
3
10
23
24
Missouri
—
0
1
1
—
—
3
25
2
2
—
5
10
25
34
Nebraska
—
0
1
—
—
—
0
2
—
—
—
1
3
4
7
North Dakota
—
0
0
—
—
—
0
1
—
—
—
0
2
—
—
South Dakota
—
0
1
—
—
—
0
1
—
—
—
0
3
3
3
S. Atlantic
—
2
7
3
14
—
13
69
11
23
28
77
153
417
386
Delaware
—
0
0
—
—
—
0
2
2
2
—
0
9
5
3
District of Columbia
—
0
1
—
—
—
0
0
—
—
—
3
8
—
30
Florida
—
0
2
—
—
—
0
4
2
1
4
27
46
165
179
Georgia
—
1
7
3
13
—
0
0
—
—
6
15
49
91
62
Maryland
—
0
1
—
—
—
0
4
—
3
3
8
16
45
47
North Carolina
—
0
2
—
—
—
1
47
—
—
7
8
31
50
5
South Carolina
—
0
1
—
1
—
1
3
2
7
1
5
13
27
29
Virginia
—
0
2
—
—
—
4
21
4
10
7
5
18
34
29
West Virginia
—
0
1
—
—
—
0
2
1
—
—
0
2
—
2
E.S. Central
—
0
3
—
—
—
11
49
11
10
3
11
29
72
61
Alabama
—
0
1
—
—
—
3
17
5
2
—
4
8
8
17
Kentucky
—
0
1
—
—
—
1
6
3
2
2
2
8
16
7
Mississippi
—
0
1
—
—
—
0
4
—
—
1
1
26
32
10
Tennessee
—
0
2
—
—
—
7
30
3
6
—
4
8
16
27
W.S. Central
—
0
4
—
—
—
8
104
6
6
4
41
67
171
302
Arkansas
—
0
2
—
—
—
5
28
4
2
3
3
10
16
21
Louisiana
—
0
0
—
—
—
0
1
—
—
—
7
20
18
42
Oklahoma
—
0
4
—
—
—
0
88
—
1
1
2
9
8
17
Texas
—
0
1
—
—
—
1
5
2
3
—
29
41
129
222
Mountain
—
0
3
—
1
—
1
7
1
7
1
15
26
79
97
Arizona
—
0
3
—
1
—
1
7
1
7
—
5
12
14
26
Colorado
—
0
0
—
—
—
0
0
—
—
1
3
9
18
30
Idaho
—
0
1
—
—
—
0
0
—
—
—
0
2
—
1
Montana
—
0
0
—
—
—
0
1
—
—
—
0
1
—
1
Nevada
—
0
0
—
—
—
0
1
—
—
—
4
14
40
20
New Mexico
—
0
1
—
—
—
0
1
—
—
—
1
5
3
11
Utah
—
0
0
—
—
—
0
1
—
—
—
1
5
4
7
Wyoming
—
0
0
—
—
—
0
1
—
—
—
0
0
—
1
Pacific
—
0
1
—
—
—
0
1
—
1
28
76
110
320
544
Alaska
N
0
0
N
N
N
0
0
N
N
—
0
3
4
4
California
—
0
1
—
—
—
0
1
—
1
24
66
94
274
449
Hawaii
N
0
0
N
N
N
0
0
N
N
—
1
3
2
4
Oregon
—
0
1
—
—
—
0
1
—
—
1
5
9
19
51
Washington
—
0
0
—
—
—
0
0
—
—
3
4
14
21
36
Territories
American Samoa
N
—
—
N
N
N
—
—
N
N
—
—
—
—
—
C.N.M.I.
—
—
—
—
—
—
—
—
—
—
—
—
—
—
—
Guam
N
0
0
N
N
N
0
0
N
N
—
0
0
—
—
Puerto Rico
N
0
0
N
N
N
0
0
N
N
—
6
30
24
40
U.S. Virgin Islands
N
0
0
N
N
N
0
0
N
N
—
0
1
—
—
C.N.M.I.: Commonwealth of Northern Mariana Islands.
U: Unavailable. —: No reported cases. N: Not reportable. NN: Not Nationally Notifiable. Cum: Cumulative year-to-date counts. Med: Median. Max: Maximum.
† Illnesses with similar clinical presentation that result from Spotted fever group rickettsia infections are reported as Spotted fever rickettsioses. Rocky Mountain spotted fever (RMSF) caused by Rickettsia rickettsii, is the most common and well-known spotted fever.
TABLE II. (Continued) Provisional cases of selected notifiable diseases, United States, weeks ending February 15, 2014, and February 16, 2013 (7th week)* (Export data)
Reporting area
Varicella (chickenpox)
West Nile virus disease†
Neuroinvasive
Nonneuroinvasive§
Current week
Previous 52 weeks
Cum 2014
Cum 2013
Current week
Previous 52 weeks
Cum 2014
Cum 2013
Current week
Previous 52 weeks
Cum 2014
Cum 2013
Med
Max
Med
Max
Med
Max
United States
74
205
291
768
1,344
—
1
160
1
—
—
1
162
—
1
New England
4
19
43
80
132
—
0
3
—
—
—
0
2
—
—
Connecticut
—
4
9
16
38
—
0
1
—
—
—
0
1
—
—
Maine
1
3
7
22
18
—
0
0
—
—
—
0
0
—
—
Massachusetts
2
10
20
34
59
—
0
2
—
—
—
0
1
—
—
New Hampshire
—
1
4
—
10
—
0
1
—
—
—
0
0
—
—
Rhode Island
—
0
4
2
1
—
0
1
—
—
—
0
0
—
—
Vermont
1
1
27
6
6
—
0
1
—
—
—
0
1
—
—
Mid. Atlantic
10
20
39
80
169
—
0
7
—
—
—
0
6
—
—
New Jersey
—
3
21
—
57
—
0
4
—
—
—
0
2
—
—
New York (Upstate)
N
0
0
N
N
—
0
2
—
—
—
0
4
—
—
New York City
—
0
0
—
—
—
0
2
—
—
—
0
1
—
—
Pennsylvania
10
15
27
80
112
—
0
1
—
—
—
0
1
—
—
E.N. Central
24
63
104
244
414
—
0
26
—
—
—
0
14
—
—
Illinois
2
12
32
39
108
—
0
21
—
—
—
0
8
—
—
Indiana
2
5
14
36
46
—
0
6
—
—
—
0
1
—
—
Michigan
2
20
44
50
88
—
0
5
—
—
—
0
4
—
—
Ohio
8
12
26
73
123
—
0
3
—
—
—
0
2
—
—
Wisconsin
10
6
23
46
49
—
0
3
—
—
—
0
1
—
—
W.N. Central
—
5
15
17
46
—
0
51
—
—
—
0
68
—
—
Iowa
N
0
0
N
N
—
0
10
—
—
—
0
5
—
—
Kansas
—
0
0
—
—
—
0
8
—
—
—
0
16
—
—
Minnesota
—
0
0
—
—
—
0
7
—
—
—
0
8
—
—
Missouri
—
3
13
10
36
—
0
6
—
—
—
0
1
—
—
Nebraska
—
0
2
1
—
—
0
14
—
—
—
0
29
—
—
North Dakota
—
0
4
1
8
—
0
11
—
—
—
0
9
—
—
South Dakota
—
1
4
5
2
—
0
10
—
—
—
0
12
—
—
S. Atlantic
18
26
51
125
167
—
0
8
—
—
—
0
3
—
1
Delaware
—
0
2
—
2
—
0
1
—
—
—
0
0
—
—
District of Columbia
—
0
2
—
4
—
0
0
—
—
—
0
1
—
—
Florida
17
12
25
68
97
—
0
1
—
—
—
0
1
—
—
Georgia
—
0
5
1
10
—
0
1
—
—
—
0
1
—
—
Maryland
N
0
0
N
N
—
0
4
—
—
—
0
3
—
—
North Carolina
—
0
0
—
—
—
0
2
—
—
—
0
0
—
—
South Carolina
1
2
13
14
9
—
0
1
—
—
—
0
1
—
1
Virginia
—
6
19
24
38
—
0
2
—
—
—
0
0
—
—
West Virginia
—
3
8
18
7
—
0
0
—
—
—
0
0
—
—
E.S. Central
—
3
9
12
16
—
0
6
1
—
—
0
7
—
—
Alabama
—
3
8
12
16
—
0
0
—
—
—
0
3
—
—
Kentucky
N
0
0
N
N
—
0
1
—
—
—
0
1
—
—
Mississippi
—
0
1
—
—
—
0
5
1
—
—
0
3
—
—
Tennessee
N
0
0
N
N
—
0
3
—
—
—
0
2
—
—
W.S. Central
12
37
104
95
212
—
0
29
—
—
—
0
17
—
—
Arkansas
—
3
17
6
16
—
0
3
—
—
—
0
1
—
—
Louisiana
—
1
7
2
8
—
0
7
—
—
—
0
3
—
—
Oklahoma
N
0
0
N
N
—
0
9
—
—
—
0
5
—
—
Texas
12
32
103
87
188
—
0
16
—
—
—
0
12
—
—
Mountain
6
17
41
110
179
—
0
29
—
—
—
0
53
—
—
Arizona
—
5
19
24
67
—
0
4
—
—
—
0
2
—
—
Colorado
6
3
20
39
46
—
0
17
—
—
—
0
34
—
—
Idaho
N
0
0
N
N
—
0
5
—
—
—
0
7
—
—
Montana
—
1
6
7
16
—
0
5
—
—
—
0
7
—
—
Nevada
N
0
0
N
N
—
0
4
—
—
—
0
1
—
—
New Mexico
—
1
5
11
10
—
0
4
—
—
—
0
3
—
—
Utah
—
4
13
29
38
—
0
1
—
—
—
0
1
—
—
Wyoming
—
0
2
—
2
—
0
4
—
—
—
0
6
—
—
Pacific
—
2
6
5
9
—
0
27
—
—
—
0
18
—
—
Alaska
—
1
6
3
7
—
0
0
—
—
—
0
0
—
—
California
—
0
2
1
1
—
0
27
—
—
—
0
18
—
—
Hawaii
—
0
4
1
1
—
0
0
—
—
—
0
0
—
—
Oregon
N
0
0
N
N
—
0
2
—
—
—
0
3
—
—
Washington
N
0
0
N
N
—
0
0
—
—
—
0
1
—
—
Territories
American Samoa
N
—
—
N
N
—
—
—
—
—
—
—
—
—
—
C.N.M.I.
—
—
—
—
—
—
—
—
—
—
—
—
—
—
—
Guam
—
0
0
—
—
—
0
0
—
—
—
0
0
—
—
Puerto Rico
—
4
14
16
28
—
0
0
—
—
—
0
0
—
—
U.S. Virgin Islands
—
0
0
—
—
—
0
0
—
—
—
0
0
—
—
C.N.M.I.: Commonwealth of Northern Mariana Islands.
U: Unavailable. —: No reported cases. N: Not reportable. NN: Not Nationally Notifiable. Cum: Cumulative year-to-date counts. Med: Median. Max: Maximum.
† Updated weekly from reports to the Division of Vector-Borne Infectious Diseases, National Center for Zoonotic, Vector-Borne, and Enteric Diseases (ArboNET Surveillance). Data for California serogroup, eastern equine, Powassan, St. Louis, and western equine diseases are available in Table I.
§ Not reportable in all states. Data from states where the condition is not reportable are excluded from this table, except starting in 2007 for the domestic arboviral diseases and influenza-associated pediatric mortality, and in 2003 for SARS-CoV. Reporting exceptions are available at http://wwwn.cdc.gov/nndss/document/SRCA_FINAL_REPORT_2006-2012_final.xlsx.
TABLE III. Deaths in 122 U.S. cities,* week ending February 15, 2014 (7th week)
Reporting area
All causes, by age (years)
P&I† Total
Reporting area (Continued)
All causes, by age (years)
P&I† Total
All Ages
=65
45–64
25–44
1–24
<1
All Ages
=65
45–64
25–44
1–24
<1
New England
520
360
120
28
9
3
43
S. Atlantic
1,108
728
271
62
32
15
86
Boston, MA
159
102
39
11
5
2
11
Atlanta, GA
73
38
23
7
5
—
2
Bridgeport, CT
34
23
9
2
—
—
2
Baltimore, MD
175
102
53
15
3
2
17
Cambridge, MA
8
7
—
1
—
—
1
Charlotte, NC
114
88
14
6
4
2
15
Fall River, MA
29
22
5
2
—
—
3
Jacksonville, FL
169
115
41
8
2
3
11
Hartford, CT
48
31
14
3
—
—
3
Miami, FL
83
69
11
2
1
—
3
Lowell, MA
26
16
6
1
3
—
1
Norfolk, VA
57
37
15
2
1
2
3
Lynn, MA
16
9
6
1
—
—
—
Richmond, VA
63
34
19
6
3
1
2
New Bedford, MA
34
25
8
1
—
—
1
Savannah, GA
90
51
29
7
1
2
5
New Haven, CT
37
26
9
1
1
—
6
St. Petersburg, FL
70
52
13
2
1
2
8
Providence, RI
U
U
U
U
U
U
U
Tampa, FL
126
80
31
6
8
1
9
Somerville, MA
3
2
1
—
—
—
—
Washington, D.C.
69
46
20
—
3
—
8
Springfield, MA
33
28
5
—
—
—
3
Wilmington, DE
19
16
2
1
—
—
3
Waterbury, CT
25
19
4
2
—
—
1
E.S. Central
925
606
236
51
18
14
108
Worcester, MA
68
50
14
3
—
1
11
Birmingham, AL
204
132
53
11
5
3
29
Mid. Atlantic
1,866
1,322
404
104
18
16
98
Chattanooga, TN
58
42
11
4
1
—
4
Albany, NY
50
32
12
4
1
—
3
Knoxville, TN
85
56
21
4
1
3
15
Allentown, PA
36
29
5
1
—
1
1
Lexington, KY
78
45
25
5
1
2
2
Buffalo, NY
112
81
24
6
1
—
3
Memphis, TN
181
123
42
7
5
4
28
Camden, NJ
24
13
9
1
1
—
1
Mobile, AL
123
84
32
6
1
—
12
Elizabeth, NJ
9
5
4
—
—
—
1
Montgomery, AL
39
27
9
3
—
—
4
Erie, PA
44
29
11
4
—
—
1
Nashville, TN
157
97
43
11
4
2
14
Jersey City, NJ
U
U
U
U
U
U
U
W.S. Central
1,627
1,062
382
118
40
24
95
New York City, NY
1,130
782
262
61
13
11
46
Austin, TX
116
77
27
6
3
3
13
Newark, NJ
40
21
12
7
—
—
4
Baton Rouge, LA
127
87
29
8
1
2
6
Paterson, NJ
16
15
1
—
—
—
2
Corpus Christi, TX
U
U
U
U
U
U
U
Philadelphia, PA
U
U
U
U
U
U
U
Dallas, TX
246
153
64
16
7
6
20
Pittsburgh, PA§
50
38
8
4
—
—
8
El Paso, TX
148
108
32
3
3
1
—
Reading, PA
37
28
7
—
—
2
—
Fort Worth, TX
U
U
U
U
U
U
U
Rochester, NY
161
125
23
11
—
2
11
Houston, TX
365
229
89
33
12
2
13
Schenectady, NY
35
30
4
1
—
—
7
Little Rock, AR
117
73
29
11
3
1
8
Scranton, PA
15
12
3
—
—
—
1
New Orleans, LA
91
49
22
12
4
4
3
Syracuse, NY
63
49
12
1
1
—
8
San Antonio, TX
285
189
61
24
7
4
24
Trenton, NJ
14
8
4
2
—
—
—
Shreveport, LA
76
52
20
3
—
1
5
Utica, NY
16
15
1
—
—
—
—
Tulsa, OK
56
45
9
2
—
—
3
Yonkers, NY
14
10
2
1
1
—
1
Mountain
1,288
849
313
74
31
18
108
E.N. Central
2,103
1,373
533
119
45
33
186
Albuquerque, NM
149
95
35
8
6
4
12
Akron, OH
48
34
12
2
—
—
6
Boise, ID
46
38
7
1
—
—
4
Canton, OH
41
25
10
5
1
—
1
Colorado Springs, CO
94
71
17
4
1
1
5
Chicago, IL
317
210
77
20
5
5
35
Denver, CO
121
76
30
5
4
6
8
Cincinnati, OH
84
47
21
10
4
2
9
Las Vegas, NV
297
191
79
16
9
2
22
Cleveland, OH
263
191
51
16
4
1
24
Ogden, UT
38
19
13
5
—
1
6
Columbus, OH
257
148
79
17
6
7
21
Phoenix, AZ
175
111
41
17
4
—
28
Dayton, OH
155
104
40
8
1
2
13
Pueblo, CO
28
18
7
2
1
—
2
Detroit, MI
126
71
41
8
3
3
10
Salt Lake City, UT
142
91
37
6
4
4
11
Evansville, IN
54
41
8
3
1
1
4
Tucson, AZ
198
139
47
10
2
—
10
Fort Wayne, IN
69
45
20
2
2
—
5
Pacific
1,979
1,336
458
118
36
30
217
Gary, IN
14
8
6
—
—
—
—
Berkeley, CA
15
10
2
1
1
1
3
Grand Rapids, MI
58
40
15
—
1
2
9
Fresno, CA
147
107
27
10
1
2
21
Indianapolis, IN
212
118
59
18
11
6
16
Glendale, CA
41
29
8
2
1
1
6
Lansing, MI
59
45
12
1
—
1
5
Honolulu, HI
80
54
21
2
2
1
14
Milwaukee, WI
81
49
28
2
2
—
7
Long Beach, CA
62
44
16
1
—
1
5
Peoria, IL
U
U
U
U
U
U
U
Los Angeles, CA
283
168
83
22
7
3
28
Rockford, IL
67
48
16
1
1
1
5
Pasadena, CA
38
27
7
2
—
1
4
South Bend, IN
47
36
6
3
—
2
8
Portland, OR
150
107
29
10
3
1
13
Toledo, OH
107
78
24
3
2
—
7
Sacramento, CA
247
157
68
18
3
1
37
Youngstown, OH
44
35
8
—
1
—
1
San Diego, CA
187
129
35
14
2
7
22
W.N. Central
728
465
190
47
14
9
60
San Francisco, CA
131
75
45
8
1
2
19
Des Moines, IA
75
46
24
4
—
1
8
San Jose, CA
218
163
34
10
7
4
22
Duluth, MN
25
16
8
1
—
—
1
Santa Cruz, CA
51
38
10
2
1
—
2
Kansas City, KS
29
20
7
1
1
—
5
Seattle, WA
117
71
29
8
5
4
6
Kansas City, MO
109
66
32
6
2
1
9
Spokane, WA
76
55
15
5
—
1
3
Lincoln, NE
68
51
12
5
—
—
3
Tacoma, WA
136
102
29
3
2
—
12
Minneapolis, MN
66
37
23
4
2
—
5
Total¶
12,144
8,101
2,907
721
243
162
1,001
Omaha, NE
129
86
29
9
3
2
13
St. Louis, MO
95
49
31
9
4
1
6
St. Paul, MN
50
36
7
4
1
2
1
Wichita, KS
82
58
17
4
1
2
9
U: Unavailable. —: No reported cases.
* Mortality data in this table are voluntarily reported from 122 cities in the United States, most of which have populations of >100,000. A death is reported by the place of its occurrence and by the week that the death certificate was filed. Fetal deaths are not included.
† Pneumonia and influenza.
§ Because of changes in reporting methods in this Pennsylvania city, these numbers are partial counts for the current week. Complete counts will be available in 4 to 6 weeks.