Table I Summary of provisional cases of selected notifiable diseases, United States, cumulative, week ending April 19, 2014 (16th Week)
Figure I Selected notifiable disease reports, United States, comparison of provisional 4-week totals ending April 19, 2014, with historical data
Table II Provisional cases of selected notifiable diseases, United States, weeks ending April 19, 2014 and April 20, 2013 (16th Week)
Table III Deaths in 122 U.S. cities, week ending April 19, 2014 (16th Week)
TABLE I. Provisional cases of infrequently reported notifiable diseases (<1,000 cases reported during the preceding year) — United States, week ending April 19, 2014 (16th week)* (Export data)
NYC (1), PA (2), OH (1), MD (1), FL (1), AR (1), WA (1), OR (1)
Measles§§
—
120
4
189
55
220
63
71
Meningococcal disease, invasive¶¶:
A, C, Y, and W-135
—
39
5
126
161
257
280
301
serogroup B
—
20
3
89
110
159
135
174
other serogroup
—
4
0
15
20
20
12
23
unknown serogroup
—
93
8
311
260
323
406
482
Novel influenza A virus infections***
—
—
123
21
313
14
4
43,774
Plague
—
—
0
4
4
3
2
8
Poliomyelitis, paralytic
—
—
—
1
—
—
—
1
Polio virus Infection, nonparalytic§
—
—
—
—
—
—
—
—
Psittacosis§
—
—
0
6
2
2
4
9
Q fever, total§
—
21
3
162
135
134
131
113
acute
—
14
2
123
113
110
106
93
chronic
—
7
0
39
22
24
25
20
Rabies, human
—
—
0
—
1
6
2
4
Rubella†††
—
—
0
10
9
4
5
3
Rubella, congenital syndrome
—
—
—
1
3
—
—
2
SARS-CoV§
—
—
—
—
—
—
—
—
Smallpox§
—
—
—
—
—
—
—
—
Streptococcal toxic-shock syndrome§
1
44
4
144
194
168
142
161
NC (1)
Syphilis, congenital (age <1 yr)§§§
—
29
6
248
322
360
377
423
Tetanus
—
5
1
24
37
36
26
18
Toxic-shock syndrome (staphylococcal)§
—
16
1
70
65
78
82
74
Trichinellosis
—
1
0
19
18
15
7
13
Tularemia
1
4
2
200
149
166
124
93
TX (1)
Typhoid fever
4
68
7
336
354
390
467
397
RI (1), NYC (2), NC (1)
Vancomycin-intermediate Staphylococcus aureus§
2
60
3
227
134
82
91
78
NY (2)
Vancomycin-resistant Staphylococcus aureus§
—
—
—
—
2
—
2
1
Vibriosis (noncholera Vibrio species infections)§
3
84
10
1,182
1,111
832
846
789
FL (2), TX (1)
Viral hemorrhagic fever¶¶¶
—
—
—
—
—
—
1
NN
Yellow fever
—
—
—
—
—
—
—
—
TABLE I. (Continued) Provisional cases of infrequently reported notifiable diseases (<1,000 cases reported during the preceding year) — United States, week ending April 19, 2014 (16th week)*
—: No reported cases. N: Not reportable. NN: Not Nationally Notifiable. Cum: Cumulative year-to-date counts.
† Calculated by summing the incidence counts for the current week, the 2 weeks preceding the current week, and the 2 weeks following the current week, for a total of 5 preceding years. Additional information is available at http://wwwn.cdc.gov/nndss/document/5yearweeklyaverage.pdf.
§ Not reportable in all states. Data from states where the condition is not reportable are excluded from this table except starting in 2007 for the arboviral diseases, STD data, TB data, and influenza-associated pediatric mortality, and in 2003 for SARS-CoV. Reporting exceptions are available at http://wwwn.cdc.gov/nndss/document/SRCA_FINAL_REPORT_2006-2012_final.xlsx.
¶ Includes both neuroinvasive and nonneuroinvasive. Updated weekly from reports to the Division of Vector-Borne Infectious Diseases, National Center for Zoonotic, Vector-Borne, and Enteric Diseases (ArboNET Surveillance). Data for West Nile virus are available in Table II.
** Data for H. influenzae (all ages, all serotypes) are available in Table II.
†† Updated weekly from reports to the Influenza Division, National Center for Immunization and Respiratory Diseases. Since September 29, 2013, 89 influenza-associated pediatric deaths occurring during the 2013-14 influenza season have been reported.
§§ No measles cases were reported for the current week.
¶¶ Data for meningococcal disease (all serogroups) are available in Table II.
*** CDC discontinued reporting of individual confirmed and probable cases of influenza A (H1N1)pdm09 virus infections on July 24, 2009. During 2009, four cases of human infection with novel influenza A viruses, different from the influenza A (H1N1)pdm09 virus, were reported to CDC. The four cases of novel influenza A virus infection reported to CDC during 2010, the fourteen cases reported during 2011, the 313 cases reported in 2012, and the 21 cases reported during 2013 are different from the influenza A (H1N1)pdm09 virus. Total case counts are provided by the Influenza Division, National Center for Immunization and Respiratory Diseases (NCIRD).
††† No rubella cases were reported for the current week.
§§§ Updated weekly from reports to the Division of STD Prevention, National Center for HIV/AIDS, Viral Hepatitis, STD, and TB Prevention.
¶¶¶ There were no cases of viral hemorrhagic fever reported during the current week. See Table II for dengue hemorrhagic fever.
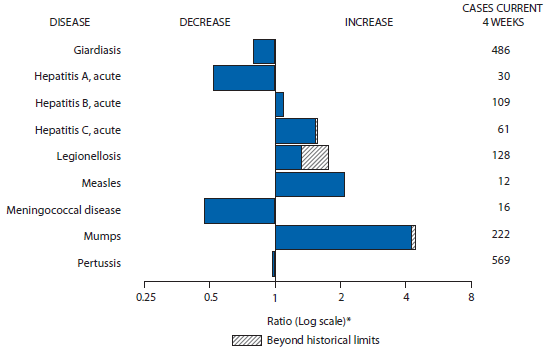
FIGURE I. Selected notifiable disease reports, United States, comparison of provisional 4-week totals April 19, 2014, with historical data
* Ratio of current 4-week total to mean of 15 4-week totals (from previous, comparable, and subsequent 4-week periods for the past 5 years). The point where the hatched area begins is based on the mean and two standard deviations of these 4-week totals.
Alternate Text: The figure above shows selected notifiable disease reports for the United States, with comparison of provisional 4-week totals through April 19, 2014, with historical data. Reports of acute hepatitis B, acute hepatitis C, legionellosis, measles, and mumps increased, with acute hepatitis C, legionellosis, and mumps increasing beyond historical limits. Reports of giardiasis, acute hepatitis A, meningococcal disease, and pertussis all decreased.
TABLE II. Provisional cases of selected notifiable diseases, United States, weeks ending April 19, 2014, and April 20, 2013 (16th week)* (Export data)
Reporting area
Babesiosis
Chlamydia trachomatis infection
Coccidioidomycosis
Current week
Previous 52 weeks
Cum 2014
Cum 2013
Current week
Previous 52 weeks
Cum 2014
Cum 2013
Current week
Previous 52 weeks
Cum 2014
Cum 2013
Med
Max
Med
Max
Med
Max
United States
—
17
146
23
36
12,436
26,755
29,187
366,414
432,898
36
174
294
1,651
2,809
New England
—
5
82
14
22
495
889
1,156
11,811
14,998
—
0
0
—
1
Connecticut
—
1
36
2
13
30
235
387
3,779
4,086
N
0
0
N
N
Maine
—
0
6
1
—
—
69
110
878
927
N
0
0
N
N
Massachusetts
—
2
48
6
8
365
427
679
5,278
6,916
—
0
0
—
—
New Hampshire
—
0
1
3
1
—
53
75
119
1,004
—
0
0
—
1
Rhode Island
—
0
27
2
—
80
80
147
1,271
1,385
—
0
0
—
—
Vermont
—
0
2
—
—
20
32
96
486
680
N
0
0
N
N
Mid. Atlantic
—
7
56
8
8
1,708
3,355
3,743
49,017
53,599
—
0
0
—
—
New Jersey
—
0
24
2
2
143
562
689
8,164
8,603
N
0
0
N
N
New York (Upstate)
—
3
53
3
5
574
728
1,866
10,646
10,562
N
0
0
N
N
New York City
—
0
12
3
1
309
1,079
1,243
15,708
18,171
N
0
0
N
N
Pennsylvania
N
0
0
N
N
682
983
1,324
14,499
16,263
N
0
0
N
N
E.N. Central
—
0
11
—
1
1,224
4,004
4,493
50,270
66,445
—
1
3
14
6
Illinois
—
0
0
—
—
18
1,182
1,482
10,461
19,779
N
0
0
N
N
Indiana
—
0
0
—
1
202
566
777
8,070
8,690
N
0
0
N
N
Michigan
—
0
1
—
—
401
838
1,098
11,019
13,985
—
0
3
11
2
Ohio
N
0
0
N
N
363
1,032
1,163
14,299
16,635
—
0
1
3
2
Wisconsin
—
0
11
—
—
240
425
513
6,421
7,356
—
0
1
—
2
W.N. Central
—
0
10
—
3
349
1,592
1,817
20,002
24,694
—
2
8
23
11
Iowa
N
0
0
N
N
20
211
254
3,041
3,137
N
0
0
N
N
Kansas
N
0
0
N
N
—
217
282
2,546
3,273
N
0
0
N
N
Minnesota
—
0
10
—
3
—
341
419
2,363
5,900
—
1
7
15
6
Missouri
N
0
0
N
N
138
543
627
7,725
8,123
—
0
3
3
2
Nebraska
—
0
1
—
—
177
147
225
2,336
2,100
—
0
1
1
—
North Dakota
—
0
1
—
—
6
59
80
898
861
—
0
2
4
3
South Dakota
—
0
1
—
—
8
74
98
1,093
1,300
N
0
0
N
N
S. Atlantic
—
0
2
—
1
3,845
5,316
6,759
78,804
87,787
—
0
1
1
2
Delaware
—
0
1
—
1
53
85
220
1,156
1,754
—
0
1
—
—
District of Columbia
N
0
0
N
N
—
88
192
—
2,436
—
0
1
—
—
Florida
N
0
0
N
N
939
1,577
1,762
22,864
24,410
N
0
0
N
N
Georgia
N
0
0
N
N
998
972
2,030
14,060
15,465
N
0
0
N
N
Maryland
—
0
1
—
—
—
462
881
5,078
7,379
—
0
1
1
2
North Carolina
N
0
0
N
N
569
948
1,835
16,086
15,857
N
0
0
N
N
South Carolina
—
0
1
—
—
523
497
927
7,912
8,309
N
0
0
N
N
Virginia
N
0
0
N
N
721
637
1,267
10,312
10,658
N
0
0
N
N
West Virginia
—
0
0
—
—
42
99
127
1,336
1,519
N
0
0
N
N
E.S. Central
—
0
0
—
—
1,153
1,812
2,217
26,376
29,488
—
0
0
—
—
Alabama
—
0
0
—
—
734
553
874
8,195
9,090
N
0
0
N
N
Kentucky
N
0
0
N
N
275
327
471
4,974
5,139
N
0
0
N
N
Mississippi
N
0
0
N
N
—
330
989
5,518
6,024
N
0
0
N
N
Tennessee
—
0
0
—
—
144
584
845
7,689
9,235
N
0
0
N
N
W.S. Central
—
0
1
—
—
447
3,486
4,388
45,135
60,812
—
0
1
—
2
Arkansas
N
0
0
N
N
383
279
421
4,532
5,113
N
0
0
N
N
Louisiana
—
0
1
—
—
64
507
1,331
5,015
7,200
—
0
1
—
2
Oklahoma
N
0
0
N
N
—
259
599
1,585
6,763
N
0
0
N
N
Texas
N
0
0
N
N
—
2,423
2,992
34,003
41,736
N
0
0
N
N
Mountain
—
0
0
—
—
1,116
1,700
2,386
28,065
26,395
—
100
210
1,115
1,779
Arizona
N
0
0
N
N
457
537
1,153
11,437
6,831
—
97
209
1,079
1,742
Colorado
N
0
0
N
N
347
372
584
5,983
6,395
N
0
0
N
N
Idaho
N
0
0
N
N
80
102
233
1,558
1,598
N
0
0
N
N
Montana
—
0
0
—
—
52
76
104
1,182
1,141
—
0
1
1
—
Nevada
N
0
0
N
N
—
207
325
2,116
3,362
—
2
6
22
15
New Mexico
N
0
0
N
N
73
207
352
3,116
4,255
—
0
2
1
11
Utah
—
0
0
—
—
100
148
175
2,311
2,326
—
1
4
12
10
Wyoming
—
0
0
—
—
7
25
64
362
487
—
0
1
—
1
Pacific
—
0
2
1
1
2,099
4,161
4,635
56,934
68,680
36
65
92
498
1,008
Alaska
N
0
0
N
N
29
110
146
1,683
1,822
—
0
0
—
—
California
—
0
2
1
1
1,348
3,204
3,528
43,682
52,698
36
65
92
498
1,007
Hawaii
N
0
0
N
N
—
130
158
1,602
2,027
N
0
0
N
N
Oregon
—
0
0
—
—
387
284
473
4,685
4,289
—
0
1
—
1
Washington
—
0
0
—
—
335
459
596
5,282
7,844
N
0
0
N
N
Territories
American Samoa
N
—
—
N
N
—
—
—
—
—
N
—
—
N
N
C.N.M.I.
—
—
—
—
—
—
—
—
—
—
—
—
—
—
—
Guam
—
—
—
—
—
—
—
—
—
—
—
—
—
—
—
Puerto Rico
N
0
0
N
N
93
107
277
1,649
1,882
N
0
0
N
N
U.S. Virgin Islands
N
0
0
N
N
—
15
25
68
208
—
0
0
—
—
C.N.M.I.: Commonwealth of Northern Mariana Islands.
U: Unavailable. —: No reported cases. N: Not reportable. NN: Not Nationally Notifiable. Cum: Cumulative year-to-date counts. Med: Median. Max: Maximum.
TABLE II. (Continued) Provisional cases of selected notifiable diseases, United States, weeks ending April 19, 2014, and April 20, 2013 (16th week)* (Export data)
Reporting area
Cryptosporidiosis
Dengue Virus Infection
Dengue Fever†
Dengue Hemorrhagic Fever§
Current week
Previous 52 weeks
Cum 2014
Cum 2013
Current week
Previous 52 weeks
Cum 2014
Cum 2013
Current week
Previous 52 weeks
Cum 2014
Cum 2013
Med
Max
Med
Max
Med
Max
United States
48
111
459
1,272
1,563
—
10
48
35
173
—
0
2
—
1
New England
—
4
14
53
55
—
0
3
3
9
—
0
0
—
—
Connecticut
—
0
5
9
7
—
0
2
—
3
—
0
0
—
—
Maine
—
0
4
16
6
—
0
0
—
1
—
0
0
—
—
Massachusetts
—
2
7
20
30
—
0
0
—
—
—
0
0
—
—
New Hampshire
—
0
2
5
8
—
0
1
—
3
—
0
0
—
—
Rhode Island
—
0
2
1
1
—
0
1
1
1
—
0
0
—
—
Vermont
—
0
3
2
3
—
0
2
2
1
—
0
0
—
—
Mid. Atlantic
9
12
42
134
158
—
2
12
11
54
—
0
1
—
—
New Jersey
—
0
5
3
19
—
0
0
—
—
—
0
0
—
—
New York (Upstate)
2
4
16
40
37
—
0
3
—
22
—
0
1
—
—
New York City
1
2
6
21
14
—
2
9
6
22
—
0
1
—
—
Pennsylvania
6
5
30
70
88
—
0
3
5
10
—
0
0
—
—
E.N. Central
9
21
64
257
353
—
1
6
5
21
—
0
0
—
—
Illinois
—
4
16
36
52
—
0
3
1
5
—
0
0
—
—
Indiana
—
2
7
20
38
—
0
1
—
3
—
0
0
—
—
Michigan
—
4
15
42
68
—
0
3
—
6
—
0
0
—
—
Ohio
8
6
17
89
100
—
0
2
3
3
—
0
0
—
—
Wisconsin
1
7
25
70
95
—
0
1
1
4
—
0
0
—
—
W.N. Central
—
21
187
123
249
—
1
3
2
7
—
0
1
—
1
Iowa
—
5
155
38
62
—
0
0
—
—
—
0
1
—
1
Kansas
—
1
7
7
25
—
0
1
—
1
—
0
0
—
—
Minnesota
—
5
17
—
57
—
0
2
—
5
—
0
1
—
—
Missouri
—
3
11
31
47
—
0
2
2
—
—
0
0
—
—
Nebraska
—
3
11
18
21
—
0
0
—
—
—
0
0
—
—
North Dakota
—
1
7
7
10
—
0
1
—
—
—
0
0
—
—
South Dakota
—
3
17
22
27
—
0
1
—
1
—
0
0
—
—
S. Atlantic
13
20
59
319
298
—
2
16
10
49
—
0
1
—
—
Delaware
—
0
2
2
3
—
0
1
—
—
—
0
0
—
—
District of Columbia
N
0
0
N
N
—
0
0
—
—
—
0
0
—
—
Florida
10
8
23
130
86
—
1
13
1
35
—
0
0
—
—
Georgia
2
4
16
62
80
—
0
2
1
1
—
0
0
—
—
Maryland
—
1
4
15
17
—
0
2
3
2
—
0
0
—
—
North Carolina
—
0
28
48
45
—
0
2
—
5
—
0
0
—
—
South Carolina
—
1
8
22
27
—
0
4
—
1
—
0
0
—
—
Virginia
1
3
8
40
32
—
0
3
5
5
—
0
1
—
—
West Virginia
—
0
2
—
8
—
0
1
—
—
—
0
0
—
—
E.S. Central
2
7
19
80
77
—
0
2
1
4
—
0
0
—
—
Alabama
2
2
9
25
33
—
0
2
—
1
—
0
0
—
—
Kentucky
—
1
5
15
18
—
0
0
—
—
—
0
0
—
—
Mississippi
—
1
5
12
11
—
0
1
1
1
—
0
0
—
—
Tennessee
—
2
6
28
15
—
0
2
—
2
—
0
0
—
—
W.S. Central
2
12
44
104
141
—
1
11
1
5
—
0
0
—
—
Arkansas
—
1
12
5
5
—
0
1
—
—
—
0
0
—
—
Louisiana
1
3
31
33
54
—
0
1
—
1
—
0
0
—
—
Oklahoma
—
1
4
10
18
—
0
2
—
—
—
0
0
—
—
Texas
1
6
36
56
64
—
1
11
1
4
—
0
0
—
—
Mountain
2
9
60
79
109
—
0
1
1
1
—
0
0
—
—
Arizona
—
1
6
14
10
—
0
1
—
—
—
0
0
—
—
Colorado
—
1
7
7
14
—
0
0
—
—
—
0
0
—
—
Idaho
1
2
22
17
25
—
0
1
—
—
—
0
0
—
—
Montana
—
1
23
10
15
—
0
1
—
—
—
0
0
—
—
Nevada
—
0
2
2
7
—
0
1
1
1
—
0
0
—
—
New Mexico
—
1
3
14
8
—
0
0
—
—
—
0
0
—
—
Utah
1
1
8
14
29
—
0
0
—
—
—
0
0
—
—
Wyoming
—
0
25
1
1
—
0
1
—
—
—
0
0
—
—
Pacific
11
11
75
123
123
—
1
8
1
23
—
0
0
—
—
Alaska
—
0
1
1
—
—
0
0
—
1
—
0
0
—
—
California
8
6
15
88
76
—
1
8
—
16
—
0
0
—
—
Hawaii
—
0
1
—
—
—
0
2
—
3
—
0
0
—
—
Oregon
—
3
58
24
32
—
0
0
—
—
—
0
0
—
—
Washington
3
1
13
10
15
—
0
2
1
3
—
0
0
—
—
Territories
American Samoa
N
—
—
N
N
—
—
—
—
—
—
—
—
—
—
C.N.M.I.
—
—
—
—
—
—
—
—
—
—
—
—
—
—
—
Guam
—
—
—
—
—
—
—
—
—
—
—
—
—
—
—
Puerto Rico
N
0
0
N
N
—
66
424
268
2,548
—
0
5
2
18
U.S. Virgin Islands
—
0
0
—
—
—
0
0
—
—
—
0
0
—
—
C.N.M.I.: Commonwealth of Northern Mariana Islands.
U: Unavailable. —: No reported cases. N: Not reportable. NN: Not Nationally Notifiable. Cum: Cumulative year-to-date counts. Med: Median. Max: Maximum.
† Dengue Fever includes cases that meet criteria for Dengue Fever with hemorrhage, other clinical and unknown case classifications.
§ DHF includes cases that meet criteria for dengue shock syndrome (DSS), a more severe form of DHF.
TABLE II. (Continued) Provisional cases of selected notifiable diseases, United States, weeks ending April 19, 2014, and April 20, 2013 (16th week)* (Export data)
Reporting area
Ehrlichiosis/Anaplasmosis†
Ehrlichia chaffeensis
Anaplasma phagocytophilum
Undetermined
Current week
Previous 52 weeks
Cum 2014
Cum 2013
Current week
Previous 52 weeks
Cum 2014
Cum 2013
Current week
Previous 52 weeks
Cum 2014
Cum 2013
Med
Max
Med
Max
Med
Max
United States
3
16
103
27
28
2
35
156
40
62
—
2
17
1
6
New England
—
0
9
—
1
—
7
32
9
13
—
0
1
—
—
Connecticut
—
0
0
—
—
—
1
17
—
10
—
0
0
—
—
Maine
—
0
1
—
—
—
1
8
5
—
—
0
1
—
—
Massachusetts
—
0
0
—
—
—
0
0
—
—
—
0
0
—
—
New Hampshire
—
0
1
—
1
—
1
8
—
3
—
0
1
—
—
Rhode Island
—
0
9
—
—
—
0
16
2
—
—
0
0
—
—
Vermont
—
0
1
—
—
—
1
4
2
—
—
0
1
—
—
Mid. Atlantic
1
2
16
4
3
2
8
30
14
14
—
0
3
—
—
New Jersey
—
0
1
—
—
—
0
4
2
5
—
0
1
—
—
New York (Upstate)
1
1
16
4
1
2
7
27
12
7
—
0
3
—
—
New York City
—
0
5
—
2
—
0
4
—
2
—
0
1
—
—
Pennsylvania
—
0
1
—
—
—
0
0
—
—
—
0
0
—
—
E.N. Central
—
1
9
1
3
—
10
48
7
21
—
0
12
1
4
Illinois
—
0
7
—
1
—
0
2
1
1
—
0
0
—
—
Indiana
—
0
0
—
—
—
0
0
—
—
—
0
8
—
1
Michigan
—
0
0
—
—
—
0
0
—
—
—
0
3
—
2
Ohio
—
0
1
—
1
—
0
1
—
—
—
0
1
—
—
Wisconsin
—
0
6
1
1
—
10
48
6
20
—
0
5
1
1
W.N. Central
—
2
48
4
4
—
4
57
2
4
—
0
6
—
—
Iowa
N
0
0
N
N
N
0
0
N
N
N
0
0
N
N
Kansas
—
1
11
—
3
—
0
2
—
—
—
0
0
—
—
Minnesota
—
0
2
—
—
—
4
57
—
4
—
0
4
—
—
Missouri
—
1
39
4
—
—
0
2
2
—
—
0
2
—
—
Nebraska
—
0
1
—
—
—
0
1
—
—
—
0
0
—
—
North Dakota
—
0
0
—
—
—
0
2
—
—
—
0
1
—
—
South Dakota
—
0
0
—
1
—
0
0
—
—
—
0
0
—
—
S. Atlantic
2
3
28
17
11
—
1
5
7
8
—
0
2
—
—
Delaware
—
0
2
1
—
—
0
1
1
—
—
0
1
—
—
District of Columbia
N
0
0
N
N
N
0
0
N
N
N
0
0
N
N
Florida
1
0
3
3
1
—
0
1
—
1
—
0
0
—
—
Georgia
1
0
5
11
7
—
0
0
—
2
—
0
0
—
—
Maryland
—
0
5
2
—
—
0
2
5
1
—
0
1
—
—
North Carolina
—
0
12
—
2
—
0
3
1
1
—
0
0
—
—
South Carolina
—
0
2
—
—
—
0
0
—
—
—
0
0
—
—
Virginia
—
1
8
—
1
—
0
3
—
1
—
0
1
—
—
West Virginia
—
0
1
—
—
—
0
1
—
2
—
0
1
—
—
E.S. Central
—
1
15
1
3
—
0
1
—
1
—
0
3
—
—
Alabama
—
0
2
1
—
—
0
1
—
—
—
0
1
—
—
Kentucky
—
0
7
—
2
—
0
0
—
—
—
0
0
—
—
Mississippi
—
0
1
—
—
—
0
0
—
—
—
0
1
—
—
Tennessee
—
0
10
—
1
—
0
1
—
1
—
0
3
—
—
W.S. Central
—
2
38
—
3
—
0
2
1
1
—
0
0
—
—
Arkansas
—
2
18
—
2
—
0
2
1
—
—
0
0
—
—
Louisiana
—
0
1
—
—
—
0
1
—
—
—
0
0
—
—
Oklahoma
—
0
34
—
1
—
0
0
—
1
—
0
0
—
—
Texas
—
0
1
—
—
—
0
0
—
—
—
0
0
—
—
Mountain
—
0
1
—
—
—
0
1
—
—
—
0
1
—
—
Arizona
—
0
0
—
—
—
0
0
—
—
—
0
1
—
—
Colorado
N
0
0
N
N
N
0
0
N
N
N
0
0
N
N
Idaho
N
0
0
N
N
N
0
0
N
N
N
0
0
N
N
Montana
—
0
1
—
—
—
0
0
—
—
—
0
0
—
—
Nevada
—
0
0
—
—
—
0
1
—
—
—
0
0
—
—
New Mexico
N
0
0
N
N
N
0
0
N
N
N
0
0
N
N
Utah
—
0
1
—
—
—
0
0
—
—
—
0
0
—
—
Wyoming
—
0
0
—
—
—
0
0
—
—
—
0
0
—
—
Pacific
—
0
0
—
—
—
0
1
—
—
—
0
1
—
2
Alaska
N
0
0
N
N
N
0
0
N
N
N
0
0
N
N
California
—
0
0
—
—
—
0
0
—
—
—
0
1
—
2
Hawaii
N
0
0
N
N
N
0
0
N
N
N
0
0
N
N
Oregon
—
0
0
—
—
—
0
1
—
—
—
0
0
—
—
Washington
—
0
0
—
—
—
0
0
—
—
—
0
0
—
—
Territories
American Samoa
N
—
—
N
N
N
—
—
N
N
N
—
—
N
N
C.N.M.I.
—
—
—
—
—
—
—
—
—
—
—
—
—
—
—
Guam
N
—
—
N
N
N
—
—
N
N
N
—
—
N
N
Puerto Rico
N
0
0
N
N
N
0
0
N
N
N
0
0
N
N
U.S. Virgin Islands
—
0
0
—
—
—
0
0
—
—
—
0
0
—
—
C.N.M.I.: Commonwealth of Northern Mariana Islands.
U: Unavailable. —: No reported cases. N: Not reportable. NN: Not Nationally Notifiable. Cum: Cumulative year-to-date counts. Med: Median. Max: Maximum.
† Cumulative total E. ewingii cases reported for year 2013 = 29, and 0 cases reported for 2014.
TABLE II. (Continued) Provisional cases of selected notifiable diseases, United States, weeks ending April 19, 2014, and April 20, 2013 (16th week)* (Export data)
Reporting area
Giardiasis
Gonorrhea
Haemophilus influenzae, invasive† All ages, all serotypes
Current week
Previous 52 weeks
Cum 2014
Cum 2013
Current week
Previous 52 weeks
Cum 2014
Cum 2013
Current week
Previous 52 weeks
Cum 2014
Cum 2013
Med
Max
Med
Max
Med
Max
United States
135
243
456
3,006
3,827
3,053
6,301
7,009
86,222
99,692
31
64
93
985
1,308
New England
3
24
57
308
304
68
131
192
1,811
1,857
—
4
11
50
77
Connecticut
—
5
11
46
53
4
50
114
707
745
—
1
5
7
17
Maine
3
4
12
56
38
—
5
10
69
83
—
0
2
5
10
Massachusetts
—
13
26
156
163
49
62
100
846
837
—
2
7
27
38
New Hampshire
—
1
7
13
16
—
2
8
43
41
—
0
3
6
7
Rhode Island
—
0
7
14
11
15
6
42
135
114
—
0
9
2
—
Vermont
—
2
15
23
23
—
1
6
11
37
—
0
2
3
5
Mid. Atlantic
38
50
90
649
680
355
764
917
10,608
12,169
10
11
25
156
206
New Jersey
—
4
12
22
95
30
131
167
1,810
2,097
—
2
7
37
38
New York (Upstate)
12
18
60
245
204
76
119
339
1,637
1,863
3
3
19
41
43
New York City
14
14
24
209
198
62
246
313
3,488
4,216
2
2
7
31
41
Pennsylvania
12
14
28
173
183
187
268
326
3,673
3,993
5
3
7
47
84
E.N. Central
10
36
66
338
509
295
1,034
1,204
12,141
17,397
1
11
19
131
195
Illinois
—
5
23
17
84
4
298
406
2,215
5,163
—
3
6
30
55
Indiana
—
3
11
21
51
50
143
205
2,020
2,171
—
2
6
22
38
Michigan
1
10
27
113
114
90
189
271
2,490
3,470
—
2
5
23
27
Ohio
9
8
25
106
152
106
311
391
4,261
5,201
1
3
9
44
48
Wisconsin
—
7
15
81
108
45
74
122
1,155
1,392
—
1
5
12
27
W.N. Central
3
24
65
148
381
81
338
421
4,380
5,045
—
5
12
73
92
Iowa
3
4
15
44
47
3
28
41
383
452
—
0
0
—
—
Kansas
—
2
7
8
21
—
43
69
576
547
—
0
3
8
20
Minnesota
—
10
24
—
154
—
73
107
727
1,117
—
1
8
27
25
Missouri
—
4
15
34
83
54
148
180
1,976
2,162
—
2
6
29
34
Nebraska
—
3
9
35
46
24
25
48
380
425
—
0
3
6
9
North Dakota
—
0
4
5
9
—
10
20
150
132
—
0
2
3
3
South Dakota
—
2
9
22
21
—
15
27
188
210
—
0
1
—
1
S. Atlantic
32
43
104
612
702
1,227
1,397
1,758
20,453
22,330
15
17
30
290
363
Delaware
—
0
3
6
3
20
25
65
368
364
—
0
3
7
5
District of Columbia
—
1
4
1
24
—
42
82
—
771
—
0
1
1
7
Florida
25
20
36
288
322
236
398
493
5,825
6,259
7
5
13
117
92
Georgia
4
10
45
157
187
261
259
595
3,478
4,505
3
2
8
41
73
Maryland
1
5
9
65
70
—
112
176
1,154
1,539
1
2
5
22
32
North Carolina
N
0
0
N
N
181
274
508
4,768
4,302
2
2
8
49
57
South Carolina
1
3
8
36
30
146
142
279
2,297
2,211
—
2
7
22
56
Virginia
1
5
13
52
56
373
123
347
2,334
2,111
1
2
7
23
27
West Virginia
—
1
4
7
10
10
19
34
229
268
1
0
2
8
14
E.S. Central
1
3
8
45
51
247
447
595
6,528
8,176
1
4
12
78
112
Alabama
1
3
8
45
51
149
147
257
2,077
2,585
—
1
4
26
39
Kentucky
N
0
0
N
N
62
80
126
1,163
1,318
—
1
4
11
18
Mississippi
N
0
0
N
N
—
98
277
1,534
1,819
—
0
2
12
12
Tennessee
N
0
0
N
N
36
136
210
1,754
2,454
1
2
6
29
43
W.S. Central
2
6
15
68
81
118
968
1,156
12,041
15,556
2
3
11
56
60
Arkansas
1
2
8
26
20
107
73
121
1,329
1,235
1
0
3
17
8
Louisiana
1
4
11
42
61
11
158
344
1,412
2,035
—
1
6
14
14
Oklahoma
—
0
0
—
—
—
79
177
499
1,726
—
2
9
21
37
Texas
N
0
0
N
N
—
647
803
8,801
10,560
1
0
1
4
1
Mountain
14
20
41
215
270
111
288
407
4,542
3,833
—
6
12
88
134
Arizona
—
2
7
14
23
91
116
216
2,306
1,386
—
1
5
18
54
Colorado
11
6
22
76
79
7
54
89
828
918
—
1
6
17
36
Idaho
—
2
9
24
32
—
4
15
52
33
—
0
3
7
6
Montana
2
2
6
16
15
2
5
11
99
53
—
0
1
4
1
Nevada
—
1
6
11
25
—
48
85
477
736
—
0
2
6
6
New Mexico
—
2
6
18
33
3
37
79
439
500
—
1
3
19
20
Utah
1
4
9
54
49
8
21
31
323
195
—
1
3
17
10
Wyoming
—
0
6
2
14
—
1
5
18
12
—
0
1
—
1
Pacific
32
51
124
623
849
551
910
1,133
13,718
13,329
2
4
7
63
69
Alaska
1
1
7
18
14
11
24
41
377
286
1
0
3
6
4
California
21
31
102
471
622
420
752
953
11,468
11,015
—
1
2
14
16
Hawaii
—
0
4
4
20
—
13
22
187
252
—
0
2
10
9
Oregon
1
7
17
74
91
32
34
59
617
492
1
1
5
31
38
Washington
9
9
80
56
102
88
80
121
1,069
1,284
—
0
2
2
2
Territories
American Samoa
—
—
—
—
—
—
—
—
—
—
—
—
—
—
—
C.N.M.I.
—
—
—
—
—
—
—
—
—
—
—
—
—
—
—
Guam
—
—
—
—
—
—
—
—
—
—
—
—
—
—
—
Puerto Rico
—
0
4
3
12
8
6
21
107
98
—
0
0
—
—
U.S. Virgin Islands
—
0
0
—
—
—
1
5
11
18
—
0
0
—
—
C.N.M.I.: Commonwealth of Northern Mariana Islands.
U: Unavailable. —: No reported cases. N: Not reportable. NN: Not Nationally Notifiable. Cum: Cumulative year-to-date counts. Med: Median. Max: Maximum.
† Data for H. influenzae (age <5 yrs for serotype b, nonserotype b, and unknown serotype) are available in Table I.
TABLE II. (Continued) Provisional cases of selected notifiable diseases, United States, weeks ending April 19, 2014, and April 20, 2013 (16th week)* (Export data)
Reporting area
Hepatitis (viral, acute), by type
A
B
C
Current week
Previous 52 weeks
Cum 2014
Cum 2013
Current week
Previous 52 weeks
Cum 2014
Cum 2013
Current week
Previous 52 weeks
Cum 2014
Cum 2013
Med
Max
Med
Max
Med
Max
United States
9
31
57
263
419
26
55
77
695
835
17
35
62
415
578
New England
—
1
6
21
26
1
1
7
14
26
—
3
8
27
63
Connecticut
—
0
3
8
6
—
0
2
5
—
—
0
1
2
—
Maine
—
0
2
1
3
1
0
1
2
7
—
0
2
8
2
Massachusetts
—
0
3
5
13
—
1
7
6
19
—
3
7
17
59
New Hampshire
—
0
1
2
2
—
0
2
—
—
N
0
0
N
N
Rhode Island
—
0
1
3
1
U
0
0
U
U
U
0
0
U
U
Vermont
—
0
2
2
1
—
0
1
1
—
—
0
1
—
2
Mid. Atlantic
1
3
12
36
64
2
3
10
45
64
6
4
12
67
66
New Jersey
—
0
2
3
11
—
0
3
1
16
—
0
3
8
13
New York (Upstate)
—
1
5
6
20
—
1
3
8
12
4
2
10
28
30
New York City
—
1
7
16
15
1
1
4
17
22
—
0
4
7
1
Pennsylvania
1
1
3
11
18
1
1
4
19
14
2
1
6
24
22
E.N. Central
—
5
12
36
90
6
9
16
141
135
4
7
34
91
101
Illinois
—
1
5
12
14
—
1
6
7
32
—
0
3
4
14
Indiana
—
0
2
5
8
—
2
6
31
24
—
3
8
10
40
Michigan
—
1
5
10
38
—
1
3
15
22
1
1
5
18
19
Ohio
—
1
4
9
20
6
4
12
84
53
3
1
29
54
11
Wisconsin
—
0
3
—
10
—
0
2
4
4
—
0
3
5
17
W.N. Central
—
1
6
12
21
—
2
5
12
37
—
1
5
9
31
Iowa
—
0
3
1
1
—
0
2
1
4
—
0
0
—
—
Kansas
—
0
3
2
1
—
0
1
1
5
—
0
3
5
5
Minnesota
—
0
2
—
9
—
0
2
—
7
—
0
3
—
19
Missouri
—
0
2
5
3
—
1
4
8
19
—
0
4
3
4
Nebraska
—
0
2
1
5
—
0
2
2
—
—
0
1
1
1
North Dakota
—
0
2
3
2
—
0
0
—
—
—
0
1
—
2
South Dakota
—
0
1
—
—
—
0
1
—
2
—
0
1
—
—
S. Atlantic
5
5
14
62
82
14
17
28
244
239
6
7
21
80
112
Delaware
—
0
1
—
1
—
0
1
1
4
U
0
0
U
U
District of Columbia
—
0
0
—
—
—
0
0
—
—
—
0
0
—
—
Florida
1
2
6
27
18
7
6
13
89
80
3
2
7
28
37
Georgia
—
1
3
11
18
—
2
6
33
41
—
0
3
4
13
Maryland
2
0
3
6
7
1
1
3
8
18
1
1
3
9
23
North Carolina
2
0
2
7
21
3
1
16
36
17
—
1
15
15
15
South Carolina
—
0
1
2
3
—
1
5
5
12
—
0
1
1
—
Virginia
—
0
3
8
13
3
1
5
15
20
2
1
5
13
10
West Virginia
—
0
1
1
1
—
4
8
57
47
—
0
6
10
14
E.S. Central
—
1
4
12
18
3
12
16
156
177
—
6
13
75
109
Alabama
—
0
2
3
—
—
1
5
31
26
—
0
5
5
4
Kentucky
—
0
2
2
12
—
4
8
37
49
—
4
10
44
75
Mississippi
—
0
1
2
1
—
0
4
7
17
U
0
0
U
U
Tennessee
—
0
2
5
5
3
5
10
81
85
—
2
7
26
30
W.S. Central
2
3
9
32
27
—
5
13
43
80
1
2
7
20
35
Arkansas
—
0
2
1
1
—
0
3
2
21
—
0
5
4
10
Louisiana
—
0
1
2
5
—
1
8
13
14
—
0
2
5
5
Oklahoma
—
0
4
1
—
—
0
4
4
5
—
0
5
7
12
Texas
2
2
8
28
21
—
3
10
24
40
1
0
4
4
8
Mountain
—
2
16
16
28
—
1
4
10
29
—
1
5
13
19
Arizona
—
1
6
4
10
—
0
2
3
7
U
0
0
U
U
Colorado
—
0
8
2
8
—
0
3
—
4
—
0
2
3
5
Idaho
—
0
1
—
3
—
0
2
—
3
—
0
1
2
5
Montana
—
0
1
1
1
—
0
1
—
—
—
0
2
—
2
Nevada
—
0
3
2
2
—
0
3
5
12
—
0
2
1
3
New Mexico
—
0
2
4
1
—
0
1
—
1
—
0
2
3
1
Utah
—
0
2
3
3
—
0
1
2
2
—
0
1
4
3
Wyoming
—
0
0
—
—
—
0
0
—
—
—
0
0
—
—
Pacific
1
5
19
36
63
—
4
15
30
48
—
3
8
33
42
Alaska
—
0
0
—
1
—
0
0
—
1
—
0
0
—
—
California
1
3
18
30
43
—
2
6
16
32
—
1
5
7
24
Hawaii
—
0
4
—
4
—
0
1
1
2
—
0
0
—
—
Oregon
—
0
3
3
6
—
0
4
6
11
—
0
2
5
6
Washington
—
0
5
3
9
—
0
10
7
2
—
1
7
21
12
Territories
American Samoa
—
—
—
—
—
—
—
—
—
—
—
—
—
—
—
C.N.M.I.
—
—
—
—
—
—
—
—
—
—
—
—
—
—
—
Guam
—
—
—
—
—
—
—
—
—
—
—
—
—
—
—
Puerto Rico
—
0
2
1
5
—
0
3
1
17
N
0
0
N
N
U.S. Virgin Islands
—
0
0
—
—
—
0
0
—
—
—
0
0
—
—
C.N.M.I.: Commonwealth of Northern Mariana Islands.
U: Unavailable. —: No reported cases. N: Not reportable. NN: Not Nationally Notifiable. Cum: Cumulative year-to-date counts. Med: Median. Max: Maximum.
TABLE II. (Continued) Provisional cases of selected notifiable diseases, United States, weeks ending April 19, 2014, and April 20, 2013 (16th week)* (Export data)
Reporting area
Invasive Pneumococcal disease†
Legionellosis
All ages
Age <5
Current week
Previous 52 weeks
Cum 2014
Cum 2013
Current week
Previous 52 weeks
Cum 2014
Cum 2013
Current week
Previous 52 weeks
Cum 2014
Cum 2013
Med
Max
Med
Max
Med
Max
United States
149
269
629
5,121
7,456
9
19
48
314
440
37
70
275
649
673
New England
3
11
34
176
285
—
1
3
10
13
—
5
25
45
38
Connecticut
—
4
14
57
165
—
0
2
5
5
—
1
10
11
4
Maine
1
2
6
51
51
—
0
1
1
3
—
0
3
3
5
Massachusetts
—
0
2
4
5
—
0
2
2
4
—
3
20
24
20
New Hampshire
—
1
5
22
36
—
0
1
1
1
—
0
3
2
2
Rhode Island
—
1
18
18
1
—
0
1
1
—
—
0
10
4
4
Vermont
2
1
4
24
27
—
0
0
—
—
—
0
2
1
3
Mid. Atlantic
42
31
85
516
1,005
3
1
10
19
46
14
18
122
143
153
New Jersey
—
4
14
6
269
—
0
2
1
13
—
1
20
1
32
New York (Upstate)
27
15
66
287
407
3
1
6
12
21
3
7
40
63
44
New York City
15
11
25
223
329
—
0
4
6
12
5
3
47
29
26
Pennsylvania
N
—
—
N
N
N
0
0
N
N
6
6
26
50
51
E.N. Central
27
48
107
813
1,390
1
3
9
47
65
9
16
102
134
122
Illinois
N
0
0
N
N
—
1
3
9
17
—
4
32
27
25
Indiana
—
10
23
147
306
—
0
3
8
11
—
2
6
15
20
Michigan
2
11
28
167
328
—
0
4
10
18
—
3
21
11
15
Ohio
20
19
47
369
550
1
1
4
15
13
9
6
66
77
53
Wisconsin
5
6
16
130
206
—
0
3
5
6
—
2
12
4
9
W.N. Central
2
16
35
222
459
—
2
4
17
44
—
3
15
28
35
Iowa
N
0
0
N
N
N
0
0
N
N
—
0
1
1
3
Kansas
—
2
7
39
73
N
0
0
N
N
—
0
3
—
2
Minnesota
—
8
19
81
232
—
0
3
5
14
—
1
3
12
8
Missouri
N
0
0
N
N
—
0
2
6
20
—
1
11
10
10
Nebraska
—
3
8
53
63
—
0
2
5
5
—
0
2
1
10
North Dakota
—
1
5
12
43
—
0
1
1
5
—
0
1
2
—
South Dakota
2
2
5
37
48
N
0
0
N
N
—
0
1
2
2
S. Atlantic
33
55
128
1,238
1,714
3
5
12
82
115
10
13
44
153
113
Delaware
—
0
5
14
17
—
0
1
—
—
—
0
4
2
—
District of Columbia
1
1
6
23
33
—
0
1
—
—
N
0
0
N
N
Florida
17
18
45
459
511
1
1
5
32
37
7
4
15
70
44
Georgia
4
15
45
301
540
1
1
5
16
34
—
1
5
8
15
Maryland
6
8
20
176
223
1
0
4
11
15
2
3
14
25
15
North Carolina
—
0
0
—
—
N
0
0
N
N
—
2
9
23
16
South Carolina
—
7
27
189
215
—
0
2
13
7
—
0
3
6
5
Virginia
—
0
3
7
13
—
0
3
7
13
1
2
9
16
16
West Virginia
5
4
13
69
162
—
0
2
3
9
—
0
4
3
2
E.S. Central
12
26
51
571
664
2
2
6
36
35
1
3
13
35
28
Alabama
—
3
10
87
84
—
0
2
5
10
—
0
10
6
4
Kentucky
5
4
11
79
127
1
0
1
4
3
—
1
4
12
4
Mississippi
—
4
13
100
103
—
0
2
9
8
1
0
2
5
6
Tennessee
7
15
31
305
350
1
1
5
18
14
—
1
7
12
14
W.S. Central
19
35
294
784
924
—
3
18
66
62
—
3
23
39
53
Arkansas
2
4
30
71
93
—
0
2
2
2
—
0
3
4
7
Louisiana
2
5
23
160
125
—
0
2
12
7
—
0
3
7
10
Oklahoma
—
0
1
4
8
—
0
1
4
8
—
0
3
—
—
Texas
15
26
262
549
698
—
2
18
48
45
—
2
23
28
36
Mountain
7
33
82
737
954
—
2
5
31
52
3
3
9
25
46
Arizona
—
14
40
372
408
—
0
4
15
19
—
1
5
4
19
Colorado
5
9
24
150
225
—
0
2
5
11
3
0
7
5
7
Idaho
N
0
0
N
N
—
0
1
1
3
—
0
2
4
3
Montana
1
0
4
17
10
—
0
0
—
1
—
0
2
2
2
Nevada
—
3
7
48
57
—
0
1
—
2
—
0
3
2
4
New Mexico
1
5
12
126
156
—
0
2
7
7
—
0
2
—
4
Utah
—
2
11
19
87
—
0
2
2
9
—
0
3
8
7
Wyoming
—
0
2
5
11
—
0
1
1
—
—
0
0
—
—
Pacific
4
3
8
64
61
—
0
3
6
8
—
4
13
47
85
Alaska
4
2
6
26
34
—
0
2
3
6
—
0
1
1
—
California
N
0
0
N
N
N
0
0
N
N
—
3
11
37
69
Hawaii
—
1
6
38
27
—
0
2
3
2
—
0
1
1
2
Oregon
N
0
0
N
N
N
0
0
N
N
—
0
2
5
7
Washington
N
0
0
N
N
N
0
0
N
N
—
0
10
3
7
Territories
American Samoa
N
—
—
N
N
—
—
—
—
—
N
—
—
N
N
C.N.M.I.
—
—
—
—
—
—
—
—
—
—
—
—
—
—
—
Guam
—
—
—
—
—
—
—
—
—
—
—
—
—
—
—
Puerto Rico
—
0
0
—
—
—
0
0
—
—
—
0
2
—
7
U.S. Virgin Islands
—
0
0
—
—
—
0
0
—
—
—
0
0
—
—
C.N.M.I.: Commonwealth of Northern Mariana Islands.
U: Unavailable. —: No reported cases. N: Not reportable. NN: Not Nationally Notifiable. Cum: Cumulative year-to-date counts. Med: Median. Max: Maximum.
† Includes drug resistant and susceptible cases of Invasive Pneumococcal Disease. This condition was previously named Streptococcus pneumoniae invasive disease and cases were reported to CDC using different event codes to specify whether the cases were drug resistant or in a defined age group, such as <5 years. Since 2010, case notifications for this condition were consolidated under one event code for Invasive pneumococcal disease.
TABLE II. (Continued) Provisional cases of selected notifiable diseases, United States, weeks ending April 19, 2014, and April 20, 2013 (16th week)* (Export data)
Reporting area
Lyme disease
Malaria
Meningococcal disease, invasive† All serogroups
Current week
Previous 52 weeks
Cum 2014
Cum 2013
Current week
Previous 52 weeks
Cum 2014
Cum 2013
Current week
Previous 52 weeks
Cum 2014
Cum 2013
Med
Max
Med
Max
Med
Max
United States
76
430
2,466
1,532
3,231
12
27
53
260
318
—
9
22
156
238
New England
—
130
932
301
942
1
2
9
14
19
—
0
3
5
8
Connecticut
—
30
252
14
331
—
0
3
—
5
—
0
1
1
2
Maine
—
15
102
60
79
1
0
2
3
—
—
0
1
—
1
Massachusetts
—
58
484
152
368
—
1
4
7
12
—
0
3
3
3
New Hampshire
—
4
91
1
83
—
0
2
2
2
—
0
1
—
1
Rhode Island
—
9
54
36
44
—
0
8
2
—
—
0
1
1
1
Vermont
—
8
103
38
37
—
0
3
—
—
—
0
1
—
—
Mid. Atlantic
50
185
1,001
914
1,515
1
8
21
70
68
—
1
7
11
28
New Jersey
—
37
224
179
623
—
1
5
5
17
—
0
2
2
6
New York (Upstate)
16
41
244
192
155
—
1
5
11
13
—
0
3
1
9
New York City
2
3
40
33
12
1
4
13
42
28
—
0
2
4
5
Pennsylvania
32
80
544
510
725
—
1
5
12
10
—
0
3
4
8
E.N. Central
1
21
236
60
99
2
3
8
20
33
—
1
4
16
25
Illinois
—
1
30
3
7
—
1
5
2
10
—
0
2
7
3
Indiana
—
1
14
—
7
—
0
2
4
6
—
0
1
1
7
Michigan
—
2
16
7
5
1
0
2
5
7
—
0
1
2
2
Ohio
—
1
7
8
14
1
1
3
9
6
—
0
2
5
4
Wisconsin
1
16
196
42
66
—
0
1
—
4
—
0
1
1
9
W.N. Central
—
14
208
6
81
—
1
7
15
21
—
0
3
9
21
Iowa
—
1
27
1
5
—
0
2
4
3
—
0
1
1
—
Kansas
—
0
4
—
2
—
0
2
4
2
—
0
1
1
2
Minnesota
—
13
183
2
72
—
0
5
1
12
—
0
2
2
7
Missouri
—
0
3
—
2
—
0
1
4
1
—
0
2
2
5
Nebraska
—
0
3
3
—
—
0
2
1
1
—
0
1
—
3
North Dakota
—
0
6
—
—
—
0
1
1
1
—
0
1
1
1
South Dakota
—
0
1
—
—
—
0
3
—
1
—
0
1
2
3
S. Atlantic
23
54
307
223
525
5
7
17
82
101
—
1
6
37
51
Delaware
4
7
24
54
104
—
0
2
1
—
—
0
1
1
1
District of Columbia
N
0
0
N
N
—
0
1
—
6
—
0
1
—
1
Florida
4
2
14
17
19
2
1
3
10
19
—
1
3
14
29
Georgia
—
0
2
—
9
3
1
5
15
14
—
0
2
5
4
Maryland
2
18
80
72
265
—
2
10
37
39
—
0
1
3
2
North Carolina
—
0
32
10
13
—
0
5
3
8
—
0
3
11
7
South Carolina
—
0
5
1
2
—
0
2
2
1
—
0
1
1
1
Virginia
13
19
266
59
92
—
1
6
14
14
—
0
1
2
4
West Virginia
—
2
23
10
21
—
0
1
—
—
—
0
0
—
2
E.S. Central
1
1
9
6
11
2
1
4
11
8
—
0
2
5
4
Alabama
—
0
3
—
4
1
0
1
3
1
—
0
1
1
—
Kentucky
—
0
9
2
5
1
0
1
3
3
—
0
1
1
1
Mississippi
—
0
0
—
—
—
0
1
—
—
—
0
1
—
2
Tennessee
1
0
4
4
2
—
0
3
5
4
—
0
1
3
1
W.S. Central
—
1
12
—
17
—
1
18
14
23
—
1
5
14
17
Arkansas
—
0
0
—
—
—
0
1
2
1
—
0
1
1
2
Louisiana
—
0
0
—
—
—
0
1
—
2
—
0
1
3
2
Oklahoma
—
0
1
—
—
—
0
3
—
2
—
0
2
2
1
Texas
—
1
12
—
17
—
1
18
12
18
—
0
5
8
12
Mountain
—
1
9
7
10
1
1
6
6
22
—
1
3
11
17
Arizona
—
0
3
1
3
—
0
3
4
9
—
0
2
3
7
Colorado
—
0
0
—
—
1
0
3
1
8
—
0
1
1
4
Idaho
—
0
2
2
5
—
0
1
—
1
—
0
1
1
2
Montana
—
0
3
2
2
—
0
0
—
—
—
0
1
2
—
Nevada
—
0
1
1
—
—
0
1
—
3
—
0
1
2
1
New Mexico
—
0
3
—
—
—
0
1
—
—
—
0
1
1
—
Utah
—
0
3
1
—
—
0
2
1
1
—
0
2
1
2
Wyoming
—
0
1
—
—
—
0
0
—
—
—
0
1
—
1
Pacific
1
3
10
15
31
—
3
10
28
23
—
2
7
48
67
Alaska
1
0
2
2
1
—
0
1
—
1
—
0
0
—
—
California
—
1
8
—
19
—
2
9
19
17
—
2
6
30
54
Hawaii
N
0
0
N
N
—
0
0
—
1
—
0
1
1
1
Oregon
—
1
4
13
10
—
0
1
—
—
—
0
3
11
5
Washington
—
0
4
—
1
—
0
3
9
4
—
0
5
6
7
Territories
American Samoa
N
—
—
N
N
—
—
—
—
—
—
—
—
—
—
C.N.M.I.
—
—
—
—
—
—
—
—
—
—
—
—
—
—
—
Guam
—
—
—
—
—
—
—
—
—
—
—
—
—
—
—
Puerto Rico
N
0
0
N
N
—
0
1
1
—
—
0
1
1
—
U.S. Virgin Islands
N
0
0
N
N
—
0
0
—
—
—
0
0
—
—
C.N.M.I.: Commonwealth of Northern Mariana Islands.
U: Unavailable. —: No reported cases. N: Not reportable. NN: Not Nationally Notifiable. Cum: Cumulative year-to-date counts. Med: Median. Max: Maximum.
† Data for meningococcal disease, invasive caused by serogroups A, C, Y, and W-135; serogroup B; other serogroup; and unknown serogroup are available in Table I.
TABLE II. (Continued) Provisional cases of selected notifiable diseases, United States, weeks ending April 19, 2014, and April 20, 2013 (16th week)* (Export data)
Reporting area
Mumps
Pertussis
Rabies, animal
Current week
Previous 52 weeks
Cum 2014
Cum 2013
Current week
Previous 52 weeks
Cum 2014
Cum 2013
Current week
Previous 52 weeks
Cum 2014
Cum 2013
Med
Max
Med
Max
Med
Max
United States
50
7
102
393
181
131
535
945
5,634
6,650
46
62
133
510
836
New England
—
0
25
1
15
6
17
38
125
309
—
5
13
53
88
Connecticut
—
0
0
—
4
—
1
6
6
10
—
3
12
30
39
Maine
—
0
0
—
1
2
5
16
66
120
—
1
4
5
17
Massachusetts
—
0
25
1
10
—
5
22
19
68
—
0
0
—
—
New Hampshire
—
0
0
—
—
—
1
9
9
26
—
0
2
3
10
Rhode Island
—
0
1
—
—
4
2
19
20
8
—
0
4
4
7
Vermont
—
0
1
—
—
—
0
7
5
77
—
1
4
11
15
Mid. Atlantic
2
2
25
76
13
18
31
57
405
590
12
6
19
75
82
New Jersey
—
0
19
4
2
—
4
12
41
156
—
0
0
—
—
New York (Upstate)
2
0
2
4
1
15
14
40
212
205
12
6
19
75
82
New York City
—
1
24
64
6
—
1
10
5
32
—
0
0
—
—
Pennsylvania
—
0
5
4
4
3
12
20
147
197
—
0
0
—
—
E.N. Central
47
1
97
290
14
24
97
200
1,186
1,081
1
2
24
1
6
Illinois
—
0
4
13
7
—
14
35
108
191
—
0
6
—
4
Indiana
—
0
3
12
1
—
11
29
73
78
—
0
1
—
—
Michigan
—
0
1
2
1
—
20
44
223
150
—
0
5
—
1
Ohio
46
0
95
258
5
24
27
104
581
264
1
0
19
1
1
Wisconsin
1
0
2
5
—
—
21
54
201
398
N
0
0
N
N
W.N. Central
—
0
2
2
4
—
46
95
338
571
—
2
9
15
44
Iowa
—
0
1
1
—
—
3
12
31
123
—
0
0
—
—
Kansas
—
0
0
—
—
—
7
22
41
60
—
1
5
7
22
Minnesota
—
0
1
—
1
—
17
40
76
189
—
0
0
—
—
Missouri
—
0
2
1
2
—
9
33
106
135
—
0
3
3
13
Nebraska
—
0
0
—
—
—
5
15
66
43
—
0
0
—
—
North Dakota
—
0
0
—
1
—
1
7
1
11
—
0
0
—
—
South Dakota
—
0
0
—
—
—
1
8
17
10
—
0
4
5
9
S. Atlantic
1
0
34
10
106
21
52
91
807
593
1
13
31
104
356
Delaware
—
0
0
—
—
—
1
34
167
10
—
0
0
—
—
District of Columbia
—
0
4
4
—
1
0
4
8
14
—
0
0
—
—
Florida
—
0
1
—
—
11
16
63
239
129
—
0
11
23
103
Georgia
—
0
4
4
—
—
4
11
67
115
—
0
0
—
—
Maryland
—
0
26
—
47
1
3
12
37
54
—
7
17
71
86
North Carolina
—
0
1
—
—
5
11
29
187
129
—
0
0
—
—
South Carolina
—
0
1
—
—
—
3
9
18
60
—
0
0
—
—
Virginia
1
0
16
2
59
3
7
30
78
78
—
6
14
—
149
West Virginia
—
0
0
—
—
—
0
3
6
4
1
1
6
10
18
E.S. Central
—
0
3
4
4
4
16
36
233
233
4
1
4
13
12
Alabama
—
0
1
1
1
1
3
8
51
47
4
1
3
10
8
Kentucky
—
0
0
—
1
—
7
28
87
90
—
0
3
3
3
Mississippi
—
0
0
—
—
—
1
4
15
21
—
0
2
—
1
Tennessee
—
0
3
3
2
3
5
10
80
75
—
0
0
—
—
W.S. Central
—
0
3
5
6
29
88
380
688
575
27
21
78
245
204
Arkansas
—
0
1
1
1
—
9
29
92
86
23
1
34
63
17
Louisiana
—
0
1
—
1
—
3
11
18
16
—
0
0
—
—
Oklahoma
—
0
1
—
—
—
0
36
1
14
—
0
31
13
19
Texas
—
0
3
4
4
29
71
351
577
459
4
18
72
169
168
Mountain
—
0
2
3
3
12
102
176
1,013
1,875
—
0
10
2
5
Arizona
—
0
1
2
—
—
17
76
72
526
N
0
0
N
N
Colorado
—
0
1
1
1
—
27
63
368
431
—
0
0
—
—
Idaho
—
0
0
—
—
4
5
14
98
56
—
0
4
—
—
Montana
—
0
0
—
—
8
8
27
88
227
N
0
0
N
N
Nevada
—
0
2
—
1
—
3
12
41
32
—
0
3
1
3
New Mexico
—
0
1
—
—
—
10
24
90
201
—
0
1
—
2
Utah
—
0
1
—
1
—
22
42
256
398
—
0
4
1
—
Wyoming
—
0
0
—
—
—
1
12
—
4
—
0
0
—
—
Pacific
—
0
2
2
16
17
63
172
839
823
1
3
13
2
39
Alaska
—
0
1
—
—
—
3
11
12
159
1
0
2
2
5
California
—
0
2
2
13
17
43
67
691
359
—
3
12
—
32
Hawaii
—
0
1
—
—
—
1
4
5
7
—
0
0
—
—
Oregon
—
0
1
—
2
—
8
26
99
120
—
0
2
—
2
Washington
—
0
1
—
1
—
9
131
32
178
—
0
0
—
—
Territories
American Samoa
—
—
—
—
—
—
—
—
—
—
N
—
—
N
N
C.N.M.I.
—
—
—
—
—
—
—
—
—
—
—
—
—
—
—
Guam
—
—
—
—
—
—
—
—
—
—
—
—
—
—
—
Puerto Rico
—
0
1
—
2
—
0
6
5
3
—
0
4
8
—
U.S. Virgin Islands
—
0
0
—
—
—
0
0
—
—
—
0
0
—
—
C.N.M.I.: Commonwealth of Northern Mariana Islands.
U: Unavailable. —: No reported cases. N: Not reportable. NN: Not Nationally Notifiable. Cum: Cumulative year-to-date counts. Med: Median. Max: Maximum.
TABLE II. (Continued) Provisional cases of selected notifiable diseases, United States, weeks ending April 19, 2014, and April 20, 2013 (16th week)* (Export data)
Reporting area
Salmonellosis
Shiga toxin-producing E. coli (STEC)†
Shigellosis
Current week
Previous 52 weeks
Cum 2014
Cum 2013
Current week
Previous 52 weeks
Cum 2014
Cum 2013
Current week
Previous 52 weeks
Cum 2014
Cum 2013
Med
Max
Med
Max
Med
Max
United States
295
951
1,608
6,998
8,761
28
129
300
715
1,088
131
249
649
3,229
2,316
New England
5
36
78
313
374
—
4
13
26
49
—
5
94
67
52
Connecticut
1
7
21
76
80
—
1
7
8
10
—
1
5
10
13
Maine
2
2
11
26
25
—
0
3
3
6
—
0
1
4
1
Massachusetts
—
19
56
143
202
—
2
8
7
18
—
3
11
42
31
New Hampshire
—
3
11
29
32
—
0
2
2
9
—
0
1
3
2
Rhode Island
2
2
13
18
18
—
0
2
1
—
—
0
86
7
3
Vermont
—
1
6
21
17
—
0
3
5
6
—
0
1
1
2
Mid. Atlantic
39
97
198
633
930
2
13
36
71
108
9
15
32
184
240
New Jersey
—
18
46
34
187
—
2
8
11
27
—
2
7
18
26
New York (Upstate)
15
25
72
216
210
2
4
10
23
30
3
4
26
66
93
New York City
14
20
52
203
228
—
1
8
15
22
6
6
14
75
93
Pennsylvania
10
28
63
180
305
—
5
17
22
29
—
2
9
25
28
E.N. Central
26
101
173
702
1,128
5
15
49
78
184
12
20
39
229
542
Illinois
—
30
65
236
368
—
4
32
21
42
—
5
16
38
55
Indiana
—
13
27
57
140
—
2
7
3
23
—
2
8
28
21
Michigan
4
17
42
140
222
—
3
14
17
27
—
2
8
18
60
Ohio
22
22
42
248
226
5
4
15
35
44
10
7
23
128
393
Wisconsin
—
15
41
21
172
—
3
13
2
48
2
0
3
17
13
W.N. Central
2
58
119
303
702
—
16
48
54
159
—
16
78
390
115
Iowa
2
8
36
80
120
—
2
14
8
25
—
4
43
92
16
Kansas
—
7
18
46
86
—
1
6
5
15
—
0
4
9
11
Minnesota
—
13
54
—
185
—
5
17
—
58
—
1
6
—
48
Missouri
—
18
38
100
173
—
4
18
23
41
—
2
9
30
16
Nebraska
—
5
20
32
61
—
2
7
8
11
—
1
5
9
16
North Dakota
—
2
7
17
26
—
1
3
6
3
—
0
2
6
6
South Dakota
—
3
10
28
51
—
0
5
4
6
—
4
32
244
2
S. Atlantic
104
248
461
2,175
2,109
5
11
20
110
127
70
57
161
1,121
384
Delaware
—
2
8
16
16
—
0
2
—
2
—
0
4
14
2
District of Columbia
—
1
3
3
17
—
0
1
1
2
—
0
2
—
5
Florida
70
111
228
1,022
962
3
3
10
51
34
61
25
96
611
114
Georgia
3
34
102
244
301
—
2
10
17
28
3
16
36
183
155
Maryland
8
16
37
165
171
1
1
8
13
15
2
2
7
43
24
North Carolina
16
35
136
397
283
—
1
6
11
21
2
3
119
215
38
South Carolina
1
20
63
147
158
—
0
1
2
2
1
3
6
24
26
Virginia
6
19
41
158
165
1
2
7
12
16
1
2
8
31
19
West Virginia
—
3
9
23
36
—
0
3
3
7
—
0
2
—
1
E.S. Central
12
59
148
516
485
1
5
18
37
62
11
27
66
385
157
Alabama
1
18
80
176
139
—
0
4
5
18
2
5
14
71
60
Kentucky
1
9
21
101
106
—
2
9
10
14
—
1
6
15
20
Mississippi
—
14
41
97
107
—
0
4
3
6
2
4
13
61
46
Tennessee
10
15
36
142
133
1
2
6
19
24
7
13
50
238
31
W.S. Central
31
129
552
728
1,015
5
17
45
196
115
20
56
417
481
487
Arkansas
4
13
37
62
68
—
2
6
28
7
9
6
22
101
38
Louisiana
5
19
43
129
189
—
0
2
4
4
1
5
21
55
54
Oklahoma
—
12
49
79
129
—
1
10
5
11
—
2
13
9
53
Texas
22
80
535
458
629
5
12
41
159
93
10
36
390
316
342
Mountain
22
56
260
452
587
1
10
69
41
111
1
13
43
108
97
Arizona
—
19
35
122
202
—
2
45
4
26
—
7
29
62
56
Colorado
13
12
35
103
112
—
3
11
3
34
1
1
12
14
11
Idaho
3
2
9
34
28
1
2
6
14
13
—
0
3
3
—
Montana
1
2
9
33
18
—
1
5
6
8
—
1
10
3
—
Nevada
—
4
205
20
51
—
1
8
3
9
—
0
7
7
13
New Mexico
—
6
19
49
93
—
0
3
6
5
—
1
5
7
10
Utah
5
6
17
89
74
—
1
9
5
14
—
1
2
10
6
Wyoming
—
1
4
2
9
—
0
7
—
2
—
0
2
2
1
Pacific
54
118
220
1,176
1,431
9
18
92
102
173
8
23
49
264
242
Alaska
7
1
6
24
17
—
0
0
—
—
—
0
1
2
—
California
36
85
174
934
1,158
—
10
36
57
117
3
19
49
207
191
Hawaii
—
7
13
61
66
—
0
2
2
13
—
0
2
6
21
Oregon
1
6
25
69
87
1
3
14
23
25
—
1
5
13
15
Washington
10
10
84
88
103
8
3
84
20
18
5
1
17
36
15
Territories
American Samoa
—
—
—
—
—
—
—
—
—
—
—
—
—
—
—
C.N.M.I.
—
—
—
—
—
—
—
—
—
—
—
—
—
—
—
Guam
—
—
—
—
—
—
—
—
—
—
—
—
—
—
—
Puerto Rico
—
6
43
56
115
—
0
6
4
—
—
0
1
1
—
U.S. Virgin Islands
—
0
0
—
—
—
0
0
—
—
—
0
0
—
—
C.N.M.I.: Commonwealth of Northern Mariana Islands.
U: Unavailable. —: No reported cases. N: Not reportable. NN: Not Nationally Notifiable. Cum: Cumulative year-to-date counts. Med: Median. Max: Maximum.
† Includes E. coli O157:H7; Shiga toxin-positive, serogroup non-O157; and Shiga toxin-positive, not serogrouped.
TABLE II. (Continued) Provisional cases of selected notifiable diseases, United States, weeks ending April 19, 2014, and April 20, 2013 (16th week)* (Export data)
Reporting area
Spotted Fever Rickettsiosis (including RMSF)†
Syphilis, primary and secondary
Confirmed
Probable
Current week
Previous 52 weeks
Cum 2014
Cum 2013
Current week
Previous 52 weeks
Cum 2014
Cum 2013
Current week
Previous 52 weeks
Cum 2014
Cum 2013
Med
Max
Med
Max
Med
Max
United States
—
3
9
17
31
6
39
211
157
157
74
330
478
4,211
5,013
New England
—
0
1
—
—
—
0
2
1
1
1
9
19
119
163
Connecticut
—
0
0
—
—
—
0
0
—
—
—
1
4
15
25
Maine
—
0
0
—
—
—
0
1
—
—
—
0
4
6
3
Massachusetts
—
0
0
—
—
—
0
1
—
—
—
6
14
75
114
New Hampshire
—
0
1
—
—
—
0
1
1
1
—
0
2
6
9
Rhode Island
—
0
0
—
—
—
0
2
—
—
1
1
5
17
10
Vermont
—
0
0
—
—
—
0
0
—
—
—
0
1
—
2
Mid. Atlantic
—
0
1
1
2
1
1
6
8
17
17
40
70
568
644
New Jersey
—
0
1
—
1
—
0
4
4
9
—
4
9
50
67
New York (Upstate)
—
0
1
1
—
1
0
6
4
1
10
5
48
98
80
New York City
—
0
1
—
—
—
0
1
—
3
3
22
34
321
358
Pennsylvania
—
0
0
—
1
—
0
4
—
4
4
8
15
99
139
E.N. Central
—
0
1
1
1
1
2
14
6
9
—
37
58
321
621
Illinois
—
0
1
—
—
—
1
8
—
4
—
11
24
99
280
Indiana
—
0
1
1
—
1
0
3
1
3
—
3
9
45
65
Michigan
—
0
1
—
1
—
0
1
1
—
—
9
17
51
130
Ohio
—
0
1
—
—
—
0
2
4
1
—
8
16
106
125
Wisconsin
—
0
1
—
—
—
0
2
—
1
—
1
5
20
21
W.N. Central
—
0
2
—
—
—
4
26
9
9
—
14
29
194
178
Iowa
—
0
0
—
—
—
0
2
—
1
—
1
18
27
23
Kansas
—
0
0
—
—
—
0
0
—
—
—
1
4
10
11
Minnesota
—
0
1
—
—
—
0
1
—
2
—
4
10
57
49
Missouri
—
0
1
—
—
—
4
25
9
6
—
5
10
74
69
Nebraska
—
0
1
—
—
—
0
2
—
—
—
1
3
14
17
North Dakota
—
0
0
—
—
—
0
1
—
—
—
0
2
2
3
South Dakota
—
0
1
—
—
—
0
1
—
—
—
1
5
10
6
S. Atlantic
—
2
7
13
26
2
13
70
43
42
33
78
183
1,136
1,008
Delaware
—
0
0
—
—
—
0
2
2
5
—
1
9
11
7
District of Columbia
—
0
0
—
2
—
0
0
—
—
—
2
8
—
61
Florida
—
0
2
1
1
1
0
3
5
2
2
27
49
424
425
Georgia
—
1
7
12
22
—
0
0
—
—
19
20
121
289
158
Maryland
—
0
1
—
—
—
0
2
2
—
—
9
16
115
115
North Carolina
—
0
2
—
—
—
3
47
12
7
7
9
30
144
55
South Carolina
—
0
1
—
1
—
1
5
4
8
3
4
13
63
87
Virginia
—
0
2
—
—
1
4
22
17
20
2
5
18
79
93
West Virginia
—
0
1
—
—
—
0
2
1
—
—
0
2
11
7
E.S. Central
—
0
2
2
1
—
12
52
36
39
—
11
29
168
176
Alabama
—
0
1
—
1
—
4
20
19
8
—
3
8
37
49
Kentucky
—
0
1
—
—
—
1
6
3
5
—
2
7
39
36
Mississippi
—
0
1
1
—
—
0
4
—
1
—
1
26
53
24
Tennessee
—
0
2
1
—
—
6
33
14
25
—
4
8
39
67
W.S. Central
—
0
4
—
—
2
9
122
46
22
2
39
69
509
682
Arkansas
—
0
2
—
—
2
5
33
25
8
—
3
10
28
55
Louisiana
—
0
0
—
—
—
0
1
1
—
1
8
22
99
101
Oklahoma
—
0
4
—
—
—
0
88
—
6
1
2
9
30
35
Texas
—
0
1
—
—
—
2
16
20
8
—
27
41
352
491
Mountain
—
0
1
—
1
—
1
4
6
15
—
16
26
212
228
Arizona
—
0
1
—
1
—
1
3
5
14
—
5
12
80
76
Colorado
—
0
0
—
—
—
0
1
—
1
—
3
9
37
51
Idaho
—
0
1
—
—
—
0
0
—
—
—
0
2
2
5
Montana
—
0
0
—
—
—
0
1
—
—
—
0
1
1
3
Nevada
—
0
0
—
—
—
0
1
—
—
—
5
14
66
45
New Mexico
—
0
1
—
—
—
0
1
1
—
—
1
5
20
23
Utah
—
0
0
—
—
—
0
1
—
—
—
1
5
6
24
Wyoming
—
0
0
—
—
—
0
1
—
—
—
0
0
—
1
Pacific
—
0
1
—
—
—
0
2
2
3
21
82
111
984
1,313
Alaska
N
0
0
N
N
N
0
0
N
N
—
0
3
5
6
California
—
0
1
—
—
—
0
2
1
3
16
68
87
850
1,134
Hawaii
N
0
0
N
N
N
0
0
N
N
—
1
5
16
7
Oregon
—
0
1
—
—
—
0
1
1
—
1
5
11
64
93
Washington
—
0
0
—
—
—
0
0
—
—
4
5
14
49
73
Territories
American Samoa
N
—
—
N
N
N
—
—
N
N
—
—
—
—
—
C.N.M.I.
—
—
—
—
—
—
—
—
—
—
—
—
—
—
—
Guam
N
—
—
N
N
N
—
—
N
N
—
—
—
—
—
Puerto Rico
N
0
0
N
N
N
0
0
N
N
1
5
30
85
112
U.S. Virgin Islands
N
0
0
N
N
N
0
0
N
N
—
0
1
—
—
C.N.M.I.: Commonwealth of Northern Mariana Islands.
U: Unavailable. —: No reported cases. N: Not reportable. NN: Not Nationally Notifiable. Cum: Cumulative year-to-date counts. Med: Median. Max: Maximum.
† Illnesses with similar clinical presentation that result from Spotted fever group rickettsia infections are reported as Spotted fever rickettsioses. Rocky Mountain spotted fever (RMSF) caused by Rickettsia rickettsii, is the most common and well-known spotted fever.
TABLE II. (Continued) Provisional cases of selected notifiable diseases, United States, weeks ending April 19, 2014, and April 20, 2013 (16th week)* (Export data)
Reporting area
Varicella (chickenpox)
West Nile virus disease†
Neuroinvasive
Nonneuroinvasive§
Current week
Previous 52 weeks
Cum 2014
Cum 2013
Current week
Previous 52 weeks
Cum 2014
Cum 2013
Current week
Previous 52 weeks
Cum 2014
Cum 2013
Med
Max
Med
Max
Med
Max
United States
89
175
296
2,171
3,495
—
1
166
1
4
—
1
163
—
2
New England
5
20
49
221
298
—
0
3
—
—
—
0
2
—
—
Connecticut
—
4
9
43
67
—
0
1
—
—
—
0
1
—
—
Maine
1
2
7
42
51
—
0
0
—
—
—
0
0
—
—
Massachusetts
—
9
20
93
134
—
0
2
—
—
—
0
1
—
—
New Hampshire
—
1
8
—
19
—
0
1
—
—
—
0
0
—
—
Rhode Island
—
0
5
7
4
—
0
1
—
—
—
0
0
—
—
Vermont
4
1
27
36
23
—
0
1
—
—
—
0
1
—
—
Mid. Atlantic
11
17
39
233
412
—
0
7
—
1
—
0
6
—
—
New Jersey
—
2
21
19
146
—
0
4
—
—
—
0
2
—
—
New York (Upstate)
N
0
0
N
N
—
0
2
—
—
—
0
4
—
—
New York City
—
0
0
—
—
—
0
2
—
—
—
0
1
—
—
Pennsylvania
11
14
26
214
266
—
0
1
—
1
—
0
1
—
—
E.N. Central
25
55
105
620
1,095
—
0
26
—
—
—
0
14
—
—
Illinois
8
11
27
144
255
—
0
21
—
—
—
0
8
—
—
Indiana
1
5
14
66
95
—
0
6
—
—
—
0
1
—
—
Michigan
5
19
45
133
393
—
0
5
—
—
—
0
4
—
—
Ohio
9
11
26
170
248
—
0
3
—
—
—
0
2
—
—
Wisconsin
2
7
25
107
104
—
0
3
—
—
—
0
1
—
—
W.N. Central
4
5
16
48
104
—
0
51
—
—
—
0
68
—
—
Iowa
N
0
0
N
N
—
0
10
—
—
—
0
5
—
—
Kansas
—
0
0
—
—
—
0
8
—
—
—
0
16
—
—
Minnesota
—
0
0
—
—
—
0
7
—
—
—
0
8
—
—
Missouri
4
3
14
30
82
—
0
5
—
—
—
0
1
—
—
Nebraska
—
0
2
2
—
—
0
14
—
—
—
0
29
—
—
North Dakota
—
0
4
5
10
—
0
12
—
—
—
0
9
—
—
South Dakota
—
1
3
11
12
—
0
10
—
—
—
0
12
—
—
S. Atlantic
11
24
47
306
471
—
0
9
—
—
—
0
3
—
1
Delaware
—
0
2
—
10
—
0
1
—
—
—
0
0
—
—
District of Columbia
—
0
2
—
7
—
0
0
—
—
—
0
1
—
—
Florida
11
12
26
181
251
—
0
1
—
—
—
0
1
—
—
Georgia
—
0
5
2
26
—
0
2
—
—
—
0
1
—
—
Maryland
N
0
0
N
N
—
0
3
—
—
—
0
2
—
—
North Carolina
—
0
0
—
—
—
0
2
—
—
—
0
0
—
—
South Carolina
—
2
13
25
52
—
0
1
—
—
—
0
1
—
1
Virginia
—
6
17
60
87
—
0
2
—
—
—
0
0
—
—
West Virginia
—
2
8
38
38
—
0
1
—
—
—
0
0
—
—
E.S. Central
—
3
9
35
55
—
0
7
1
1
—
0
7
—
1
Alabama
—
2
8
35
54
—
0
1
—
—
—
0
3
—
—
Kentucky
N
0
0
N
N
—
0
1
—
—
—
0
1
—
—
Mississippi
—
0
1
—
1
—
0
5
1
—
—
0
3
—
1
Tennessee
N
0
0
N
N
—
0
3
—
1
—
0
2
—
—
W.S. Central
29
34
114
383
620
—
0
29
—
1
—
0
17
—
—
Arkansas
—
3
17
22
69
—
0
3
—
—
—
0
1
—
—
Louisiana
—
1
7
6
18
—
0
7
—
—
—
0
3
—
—
Oklahoma
N
0
0
N
N
—
0
9
—
—
—
0
7
—
—
Texas
29
28
105
355
533
—
0
16
—
1
—
0
12
—
—
Mountain
3
20
44
303
418
—
0
32
—
—
—
0
53
—
—
Arizona
—
5
21
101
135
—
0
7
—
—
—
0
2
—
—
Colorado
2
5
23
92
121
—
0
17
—
—
—
0
34
—
—
Idaho
N
0
0
N
N
—
0
5
—
—
—
0
7
—
—
Montana
1
1
6
22
31
—
0
5
—
—
—
0
7
—
—
Nevada
N
0
0
N
N
—
0
4
—
—
—
0
1
—
—
New Mexico
—
1
5
23
30
—
0
4
—
—
—
0
3
—
—
Utah
—
3
11
65
99
—
0
1
—
—
—
0
1
—
—
Wyoming
—
0
2
—
2
—
0
4
—
—
—
0
6
—
—
Pacific
1
2
6
22
22
—
0
27
—
1
—
0
18
—
—
Alaska
1
1
6
8
12
—
0
0
—
—
—
0
0
—
—
California
—
0
2
5
5
—
0
27
—
1
—
0
18
—
—
Hawaii
—
0
4
9
5
—
0
0
—
—
—
0
0
—
—
Oregon
N
0
0
N
N
—
0
2
—
—
—
0
3
—
—
Washington
N
0
0
N
N
—
0
0
—
—
—
0
1
—
—
Territories
American Samoa
N
—
—
N
N
—
—
—
—
—
—
—
—
—
—
C.N.M.I.
—
—
—
—
—
—
—
—
—
—
—
—
—
—
—
Guam
—
—
—
—
—
—
—
—
—
—
—
—
—
—
—
Puerto Rico
—
4
14
45
74
—
0
0
—
—
—
0
0
—
—
U.S. Virgin Islands
—
0
0
—
—
—
0
0
—
—
—
0
0
—
—
C.N.M.I.: Commonwealth of Northern Mariana Islands.
U: Unavailable. —: No reported cases. N: Not reportable. NN: Not Nationally Notifiable. Cum: Cumulative year-to-date counts. Med: Median. Max: Maximum.
† Updated weekly from reports to the Division of Vector-Borne Infectious Diseases, National Center for Zoonotic, Vector-Borne, and Enteric Diseases (ArboNET Surveillance). Data for California serogroup, eastern equine, Powassan, St. Louis, and western equine diseases are available in Table I.
§ Not reportable in all states. Data from states where the condition is not reportable are excluded from this table, except starting in 2007 for the domestic arboviral diseases and influenza-associated pediatric mortality, and in 2003 for SARS-CoV. Reporting exceptions are available at http://wwwn.cdc.gov/nndss/document/SRCA_FINAL_REPORT_2006-2012_final.xlsx.
TABLE III. Deaths in 122 U.S. cities,* week ending April 19, 2014 (16th week) (Export data)
Reporting area
All causes, by age (years)
P&I† Total
Reporting area (Continued)
All causes, by age (years)
P&I† Total
All Ages
=65
45–64
25–44
1–24
<1
All Ages
=65
45–64
25–44
1–24
<1
New England
531
384
111
24
8
4
58
S. Atlantic
1,005
654
246
59
25
21
59
Boston, MA
150
101
34
7
5
3
16
Atlanta, GA
116
75
25
8
5
3
5
Bridgeport, CT
29
21
7
1
—
—
1
Baltimore, MD
130
82
38
7
2
1
13
Cambridge, MA
18
15
3
—
—
—
—
Charlotte, NC
117
78
25
9
3
2
1
Fall River, MA
22
15
7
—
—
—
1
Jacksonville, FL
131
87
28
8
3
5
5
Hartford, CT
46
31
10
4
1
—
11
Miami, FL
70
52
12
1
4
1
5
Lowell, MA
21
18
2
1
—
—
1
Norfolk, VA
54
36
12
5
1
—
2
Lynn, MA
7
4
3
—
—
—
—
Richmond, VA
64
35
18
6
1
4
2
New Bedford, MA
23
21
1
1
—
—
—
Savannah, GA
58
39
11
3
4
1
2
New Haven, CT
U
U
U
U
U
U
U
St. Petersburg, FL
54
37
13
3
—
1
9
Providence, RI
86
62
18
5
1
—
5
Tampa, FL
102
65
32
3
1
1
9
Somerville, MA
5
4
—
1
—
—
—
Washington, D.C.
105
64
32
6
1
2
5
Springfield, MA
32
22
9
—
1
—
3
Wilmington, DE
4
4
—
—
—
—
1
Waterbury, CT
23
16
6
1
—
—
1
E.S. Central
961
622
235
65
18
21
61
Worcester, MA
69
54
11
3
—
1
19
Birmingham, AL
215
142
49
10
4
10
15
Mid. Atlantic
1,891
1,343
397
91
36
24
98
Chattanooga, TN
85
58
19
6
2
—
7
Albany, NY
53
38
11
2
1
1
—
Knoxville, TN
122
82
27
10
1
2
6
Allentown, PA
28
22
4
1
—
1
1
Lexington, KY
110
78
25
5
1
1
1
Buffalo, NY
87
53
25
4
2
3
4
Memphis, TN
134
76
34
17
3
4
13
Camden, NJ
16
10
2
4
—
—
2
Mobile, AL
89
59
22
4
3
1
10
Elizabeth, NJ
26
17
8
1
—
—
3
Montgomery, AL
48
31
14
1
1
1
3
Erie, PA
44
35
5
2
2
—
4
Nashville, TN
158
96
45
12
3
2
6
Jersey City, NJ
17
14
3
—
—
—
1
W.S. Central
1,466
926
377
90
44
28
86
New York City, NY
1,183
839
256
54
25
9
61
Austin, TX
75
52
14
6
1
2
7
Newark, NJ
32
18
10
2
2
—
—
Baton Rouge, LA
83
53
20
5
3
2
5
Paterson, NJ
10
1
6
3
—
—
1
Corpus Christi, TX
54
35
16
2
—
1
8
Philadelphia, PA
U
U
U
U
U
U
U
Dallas, TX
220
127
64
16
7
5
20
Pittsburgh, PA§
45
29
10
2
—
4
4
El Paso, TX
114
87
16
6
4
1
3
Reading, PA
24
18
2
2
2
—
3
Fort Worth, TX
U
U
U
U
U
U
U
Rochester, NY
135
106
18
7
1
3
7
Houston, TX
389
228
117
20
17
7
16
Schenectady, NY
22
18
3
1
—
—
3
Little Rock, AR
74
46
20
6
—
2
4
Scranton, PA
34
22
12
—
—
—
3
New Orleans, LA
71
39
14
11
5
2
1
Syracuse, NY
83
66
12
3
—
2
1
San Antonio, TX
292
195
74
13
6
4
18
Trenton, NJ
16
8
5
2
—
1
—
Shreveport, LA
61
40
13
5
1
2
4
Utica, NY
13
11
2
—
—
—
—
Tulsa, OK
33
24
9
—
—
—
—
Yonkers, NY
23
18
3
1
1
—
—
Mountain
1,188
821
248
69
25
24
62
E.N. Central
1,956
1,329
452
102
32
41
127
Albuquerque, NM
120
80
29
7
1
3
8
Akron, OH
48
33
12
1
1
1
3
Boise, ID
69
49
14
1
1
4
2
Canton, OH
27
16
9
2
—
—
1
Colorado Springs, CO
85
61
19
3
1
1
5
Chicago, IL
257
168
66
13
6
4
17
Denver, CO
99
62
27
8
1
1
2
Cincinnati, OH
77
50
17
7
1
2
6
Las Vegas, NV
272
206
49
9
2
5
23
Cleveland, OH
250
171
59
13
1
6
14
Ogden, UT
30
22
4
3
1
—
1
Columbus, OH
266
177
61
14
3
11
16
Phoenix, AZ
198
130
41
14
8
5
8
Dayton, OH
131
103
22
4
2
—
9
Pueblo, CO
34
24
9
1
—
—
2
Detroit, MI
101
60
21
12
4
4
6
Salt Lake City, UT
130
82
29
13
5
1
6
Evansville, IN
46
32
11
2
1
—
5
Tucson, AZ
151
105
27
10
5
4
5
Fort Wayne, IN
81
52
21
7
—
1
1
Pacific
1,642
1,176
344
80
23
19
124
Gary, IN
9
4
2
1
—
2
1
Berkeley, CA
15
12
2
—
1
—
1
Grand Rapids, MI
59
49
9
1
—
—
3
Fresno, CA
115
86
23
4
2
—
13
Indianapolis, IN
200
135
43
11
6
5
18
Glendale, CA
23
17
5
1
—
—
4
Lansing, MI
42
31
10
—
—
1
3
Honolulu, HI
57
47
7
—
3
—
9
Milwaukee, WI
79
40
29
7
2
1
7
Long Beach, CA
60
38
14
5
1
2
9
Peoria, IL
47
38
8
1
—
—
4
Los Angeles, CA
235
161
51
17
3
3
20
Rockford, IL
62
40
19
1
—
2
3
Pasadena, CA
19
15
4
—
—
—
1
South Bend, IN
33
20
10
—
3
—
3
Portland, OR
132
90
33
6
1
2
7
Toledo, OH
89
66
16
4
2
1
4
Sacramento, CA
236
170
51
10
4
1
15
Youngstown, OH
52
44
7
1
—
—
3
San Diego, CA
176
118
40
12
1
5
4
W.N. Central
726
467
168
50
22
18
35
San Francisco, CA
95
64
26
4
—
1
4
Des Moines, IA
106
80
18
7
1
—
3
San Jose, CA
175
132
31
7
3
2
16
Duluth, MN
31
22
6
2
—
1
3
Santa Cruz, CA
31
26
3
2
—
—
3
Kansas City, KS
33
18
12
1
1
1
1
Seattle, WA
87
59
18
5
3
2
2
Kansas City, MO
103
71
17
9
2
3
2
Spokane, WA
59
50
9
—
—
—
6
Lincoln, NE
50
38
8
2
1
1
3
Tacoma, WA
127
91
27
7
1
1
10
Minneapolis, MN
65
35
20
4
4
2
8
Total¶
11,366
7,722
2,578
630
233
200
710
Omaha, NE
85
60
16
2
2
5
6
St. Louis, MO
102
46
33
10
10
3
1
St. Paul, MN
59
32
18
7
—
2
1
Wichita, KS
92
65
20
6
1
—
7
U: Unavailable. —: No reported cases.
* Mortality data in this table are voluntarily reported from 122 cities in the United States, most of which have populations of >100,000. A death is reported by the place of its occurrence and by the week that the death certificate was filed. Fetal deaths are not included.
† Pneumonia and influenza.
§ Because of changes in reporting methods in this Pennsylvania city, these numbers are partial counts for the current week. Complete counts will be available in 4 to 6 weeks.