Falls and Fall Injuries Among Adults with Arthritis — United States, 2012Kamil E. Barbour, PhD1, Judy A. Stevens, PhD2, Charles G. Helmick, MD1, Yao-Hua Luo, PhD1, Louise B. Murphy, PhD1, Jennifer M. Hootman, PhD1, Kristina Theis, MPH1, Lynda A. Anderson, PhD1, Nancy A. Baker, ScD3, David E. Sugerman, MD2 (Author affiliations at end of text) Falls are the leading cause of injury-related morbidity and mortality among older adults, with more than one in three older adults falling each year,* resulting in direct medical costs of nearly $30 billion (1). Some of the major consequences of falls among older adults are hip fractures, brain injuries, decline in functional abilities, and reductions in social and physical activities (2). Although the burden of falls among older adults is well-documented (1,2), research suggests that falls and fall injuries are also common among middle-aged adults (3). One risk factor for falling is poor neuromuscular function (i.e., gait speed and balance), which is common among persons with arthritis (2). In the United States, the prevalence of arthritis is highest among middle-aged adults (aged 45–64 years) (30.2%) and older adults (aged =65 years) (49.7%), and these populations account for 52% of U.S. adults (4). Moreover, arthritis is the most common cause of disability (5). To examine the prevalence of falls among middle-aged and older adults with arthritis in different states/territories, CDC analyzed data from the 2012 Behavioral Risk Factor Surveillance System (BRFSS) to assess the state-specific prevalence of having fallen and having experienced a fall injury in the past 12 months among adults aged =45 years with and without doctor-diagnosed arthritis. This report summarizes the results of that analysis, which found that for all 50 states and the District of Columbia (DC), the prevalence of any fall (one or more), two or more falls, and fall injuries in the past 12 months was significantly higher among adults with arthritis compared with those without arthritis. The prevalence of falls and fall injuries is high among adults with arthritis but can be addressed through greater dissemination of arthritis management and fall prevention programs in clinical and community practice. BRFSS is an annual, random-digit–dialed landline and cellphone survey representative of the noninstitutionalized adult population aged =18 years of the 50 states, DC, and the U.S. territories. In 2012, a total of 338,734 interviews with persons aged =45 years were completed, and data from 50 states, DC, Puerto Rico, and Guam are included in this report (the U.S. Virgin Islands did not collect BRFSS data). Response rates ranged from 27.7% to 60.4%, with a median of 45.2%.† Respondents were defined as having arthritis if they answered "yes" to the question, "Have you ever been told by a doctor or other health professional that you have some form of arthritis, rheumatoid arthritis, gout, lupus, or fibromyalgia?" The BRFSS survey asks about falls in the past year, explaining to the respondent that, "By a fall, we mean when a person unintentionally comes to rest on the ground or another lower level." Respondents were considered to have fallen if they answered the question, "In the past 12 months, how many times have you fallen?" with a number of one or more. The number of falls was analyzed as a categorical variable (zero, one, or two or more) and as a dichotomous variable (yes or no). Those who reported one or more falls were also asked, "How many of these falls caused an injury? By an injury, we mean the fall caused you to limit your regular activities for at least a day or to go see a doctor?" Injury from any fall was categorized as a dichotomous variable (yes or no). All analyses used sampling weights to account for the complex sample design, nonresponse, noncoverage, and cellphone-only households. Since 2011, iterative proportional weighting (raking) has been used and shown to reduce nonresponse bias and error within estimates compared with post-stratification weighting.§ Thus, 2012 estimates should not be compared with estimates made before 2011. The unadjusted prevalence of any fall (one or more in the past 12 months) with 95% confidence intervals (CIs) for combined state/territory data was used to assess the similarity of prevalence for two age groups (45–64 and =65 years). State-specific unadjusted prevalence of fall outcomes among adults aged =45 years with and without arthritis are available at http://www.cdc.gov/arthritis/data_statistics/prevalence-injuries-falls-by-state.htm. Age-adjusted estimates were standardized to the year 2000 U.S. standard population using five age-groups (45–54, 55–64, 65–74, 75–84, and =85 years). Age-adjusted estimates were presented and used to compare the prevalence of one fall, any fall, two or more falls, and fall injuries by arthritis status across states/territories. In addition, medians and ranges for all states and DC were determined for each fall outcome. For all comparisons, differences were considered statistically significant if the CIs of the age-adjusted estimates did not overlap. The unadjusted prevalence of having experienced any fall in the past 12 months was similar for adults aged 45–64 years (25.5%) and =65 years (27.0%); therefore, state-specific findings for the combined =45 years age group are reported. Overall the unadjusted median state prevalence of arthritis among adults aged =45 years was 40.1% (range = 31.0%–51.9%), and the median prevalence of one fall, two or more falls, and fall injuries in the preceding year was 13.8% (range = 8.8%–16.7%), 13.3% (range = 6.1%–21.0%), and 9.9% (range = 4.5%–13.3%), respectively. In analyses of adults with arthritis, the age-adjusted median prevalence for one fall was 15.5% (range = 10.7% in Wisconsin to 20.1% in Washington), for two or more falls was 21.3% (range = 7.7% in Wisconsin to 30.6% in Alaska), and for fall injuries was 16.2% (range = 8.5% in Wisconsin to 22.1% in Oklahoma) (Table). Among adults without arthritis, the age-adjusted median prevalence of one fall, two or more falls, and fall injuries was 12.1% (range = 7.7% in Wisconsin to 15.1% in Wyoming), 9.0% (range = 4.1% in Wisconsin to 14.6% in Alaska), and 6.5% (range = 2.7% in Wisconsin to 9.0% in Alaska), respectively. Within every state and territory except Guam, the prevalence of two or more falls and fall injuries was significantly higher for those with arthritis compared with those without arthritis (Table). The age-adjusted median prevalence of one fall, any fall, two or more falls, and fall injuries was 28%, 79%, 137%, and 149% higher (relative differences), respectively, among adults with arthritis compared with adults without arthritis. In 2012, 46 states and DC had an age-adjusted prevalence of any fall in the past 12 months of =30% among adults with arthritis, and 16 states had an age-adjusted prevalence of any fall of =40% (Figure). Among adults without arthritis, no state/territory had an age-adjusted prevalence of falls =30% or had a significantly higher age-adjusted prevalence of falls compared with adults with arthritis. DiscussionIn all 50 states and DC, the prevalence of any fall (one or more), two or more falls, and fall injuries in the past 12 months was significantly higher among adults aged =45 years with arthritis compared with those without arthritis. Among persons with arthritis, about half of all states had a prevalence of multiple falls (two or more) ranging from 21% to 31% and a prevalence of fall injuries ranging from 16% to 22%. In 45 states and DC, the age-adjusted prevalence of any fall among adults with arthritis was =30%; in contrast, the prevalence of any fall in adults without arthritis did not reach 30% in any state. Finally, the age-adjusted median prevalence of two or more falls and fall injuries among adults with arthritis was approximately 2.4 and 2.5 times higher, respectively, than those without arthritis. The 2010 U.S. Census reported 81.5 million adults (26.4% of the population) aged 45–64 and 40.3 million persons (13.0%) aged =65 years. The projected rapid growth in the population aged =65 years¶ and the increase in adults with arthritis (an estimated 67 million by 2030) (6) demonstrate the need for increasing fall prevention efforts. Public health approaches to prevent falls among older adults have focused on modifying fall risk factors (e.g., muscle weakness in the legs, gait and balance problems, psychoactive medication use, poor vision, and environmental hazards such as slippery surfaces or tripping hazards), in addition to identifying and treating the symptoms of chronic conditions that increase fall risk, such as arthritis.** Public health approaches to preventing poor outcomes among adults with arthritis have focused on evidence-based self-management education and physical activity interventions†† that have been proven to reduce pain and improve function by correcting muscle weakness and balance dysfunction. Combining arthritis exercise programs with proven fall prevention intervention might reduce the risk for falls in this at-risk population. Effective fall prevention interventions can be multifaceted, but the most effective single strategy involves exercise or physical therapy to improve gait, balance, and lower body strength, which have been shown to reduce fall risk by 14%–37% (7). For an exercise program to be effective in reducing falls it must 1) focus on improving balance, 2) become progressively more challenging, and 3) involve at least 50 hours of practice (e.g., a 1-hour Tai Chi class taken twice a week for 25 weeks) (8). As a form of exercise, Tai Chi is an effective fall prevention intervention§§ that has also been shown to improve neuromuscular function (9). However, the effects of Tai Chi intervention programs on arthritis-specific outcomes are still being evaluated; therefore, Tai Chi is not currently endorsed for use by the 12 CDC-funded state arthritis programs that disseminate arthritis-appropriate, evidence-based intervention programs for use in local communities. Existing arthritis physical activity interventions, especially EnhanceFitness and Fit and Strong¶¶ might reduce the risk for falls and fall injuries but have not yet been evaluated for these outcomes. The findings in this report are subject to at least four limitations. First, data in BRFSS are based on self-report; therefore, arthritis status, falls, and a fall injury might be misclassified. The case-finding question used in BRFSS to assess arthritis status has been judged to be sufficiently sensitive and specific for public health surveillance purposes among those aged =65 years, but it is less sensitive for those aged <65 years than is desirable (10); however, recall bias might contribute to an underestimate of self-reported falls. Conversely, the broad definition of a fall injury might have led participants to report minor falls as injurious, resulting in an overestimate. Second, because BRFSS is a cross-sectional survey, the temporal sequence of arthritis and falls could not be established. Nonetheless, a meta-analysis of seven longitudinal studies showed that persons with arthritis have more than a two-fold increased risk for falls (2). Third, no BRFSS questions assess the severity, location, or type of arthritis, which might affect falls and fall injuries differently. Finally, the 2012 median survey response rate for all states and DC was 45.2% and ranged from 27.7% to 60.4%; lower response rates can result in nonresponse bias, although the application of sampling weights is expected to reduce nonresponse bias. The number of adults with arthritis is expected to increase steadily through at least 2030 (6), putting more adults at higher risk for falls and fall injuries. Efforts to address this growing public health problem require raising awareness about the link between arthritis and falls, evaluating evidence-based arthritis interventions for their effects on falls, and implementing fall prevention programs more widely through changes in clinical and community practice. 1Division of Population Health, National Center for Chronic Disease Prevention and Health Promotion, CDC; 2Division of Unintentional Injury Prevention; National Center for Injury Prevention and Control, CDC; 3Department of Occupational Therapy, University of Pittsburgh (Corresponding author: Kamil E. Barbour, kbarbour@cdc.gov, 770-488-5145) References
* Information available at http://www.cdc.gov/injury/wisqars. † The response rate was the number of respondents who completed the survey as a proportion of all eligible and likely eligible persons. Response rates for BRFSS were calculated using standards set by the American Association of Public Opinion Research response rate formula no. 4. Additional information available at http://www.cdc.gov/brfss/annual_data/2012/pdf/summarydataqualityreport2012_20130712.pdf. § Additional information available at http://www.cdc.gov/brfss/annual_data/2012/pdf/overview_2012.pdf. ¶ Additional information available at https://www.census.gov/prod/2010pubs/p25-1138.pdf. ** Additional information available at http://www.americangeriatrics.org/health_care_professionals/clinical_practice/clinical_guidelines_recommendations/2010. †† Additional information available at http://www.cdc.gov/arthritis/interventions/marketing-support/compendium/docs/pdf/compendium-2012.pdf. §§ Additional information available at http://www.cdc.gov/homeandrecreationalsafety/falls/preventfalls.html#compendium. ¶¶ Additional information available at http://www.cdc.gov/arthritis/interventions/marketing-support/compendium/docs/pdf/compendium-2012.pdf. What is already known on this topic? In the United States, arthritis, falls, and fall injuries are highly prevalent conditions among middle-aged (aged 45–64 years) and older (aged =65 years) adults. Falls are the leading cause of injury-related morbidity and mortality among older adults; meanwhile, arthritis remains the most common cause of disability. What is added by this report? During 2012, for all 50 states and the District of Columbia, the prevalence of any fall (one or more), two or more falls, and fall injuries in the past 12 months was significantly higher among adults with arthritis compared with those without arthritis. Moreover, among adults with arthritis, the age-adjusted median prevalences of one fall, any fall, two or more falls, and fall injuries were 28% , 79%, 137%, and 149% higher, respectively, compared with adults without arthritis. What are the implications for public health practice? The burden of falls and fall injuries is high among adults with arthritis but can be addressed through greater dissemination of arthritis management and fall prevention programs in clinical and community practice. FIGURE. Age-standardized prevalence of having one or more falls in the past 12 months among adults aged =45 years with arthritis — Behavioral Risk Factor Surveillance System, United States, 2012 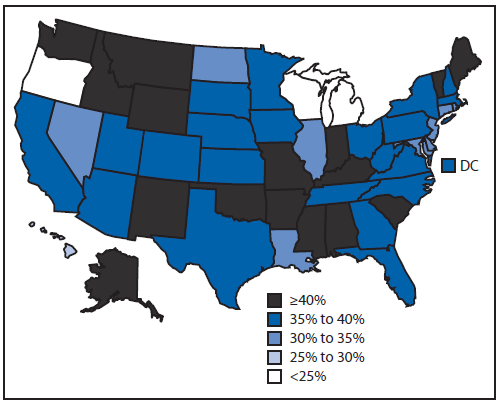
Alternate Text: The figure above shows age-standardized prevalence of having one or more falls in the past 12 months among adults aged =45 years with arthritis in the United States during 2012. In 2012, 46 states and DC had an age-adjusted prevalence of any fall in the past 12 months of =30% among adults with arthritis, and 16 states had an age-adjusted prevalence of any fall of =40%. Syndicated Content Details:
Source URL: http://www.cdc.gov/mmwr/preview/mmwrhtml/mm6317a3.htm Source Agency: Centers for Disease Control and Prevention (CDC) Captured Date: 2014-05-01 21:20:55.0
|