Arthritis Among Veterans — United States, 2011–2013Please note: An erratum has been published for this article. To view the erratum, please click here. Louise B. Murphy, PhD1, Charles G. Helmick, MD1, Kelli D. Allen, PhD2, Kristina A. Theis, MPH1, Nancy A. Baker, ScD1, Glen R. Murray3, Jin Qin, PhD1, Jennifer M. Hootman, PhD1, Teresa J. Brady, PhD1, Kamil E. Barbour, PhD1 (Author affiliations at end of text) Arthritis is among the most common chronic conditions among veterans and is more prevalent among veterans than nonveterans (1,2). Contemporary population-based estimates of arthritis prevalence among veterans are needed because previous population-based studies predate the Persian Gulf War (1), were small (2), or studied men only (2) despite the fact that women comprise an increasing proportion of military personnel and typically have a higher prevalence of arthritis than men (1,3). To address this knowledge gap, CDC analyzed combined 2011, 2012, and 2013 Behavioral Risk Factor Surveillance System (BRFSS) data among all adults aged =18 years, by veteran status, to estimate the total and sex-specific prevalence of doctor-diagnosed arthritis overall and by sociodemographic categories, and the state-specific prevalence (overall and sex-specific) of doctor-diagnosed arthritis. This report summarizes the results of these analyses, which found that one in four veterans reported that they had arthritis (25.6%) and that prevalence was higher among veterans than nonveterans across most sociodemographic categories, including sex (prevalence among male and female veterans was 25.0% and 31.3%, respectively). State-specific, age-standardized arthritis prevalence among veterans ranged from 18.8% in Hawaii to 32.7% in West Virginia. Veterans comprise a large and important target group for reducing the growing burden of arthritis. Those interested in veterans' health can help to improve the quality of life of veterans by ensuring that they have access to affordable, evidence-based, physical activity and self-management education classes that reduce the adverse effects of arthritis (e.g., pain and depression) and its common comorbidities (e.g., heart disease and diabetes). BRFSS is an annual, cross-sectional, random-digit–dialed telephone (landline and cell phone) survey of the 50 U.S. states, territories, and the District of Columbia (DC). BRFSS is designed to collect data that are representative of the noninstitutionalized adult civilian population in each state. All analyses used combined 2011, 2012, and 2013 BRFSS data. Median state-specific BRFSS response rates, based on American Association for Public Opinion Research definition no. 4, were 49.7% in 2011, 45.2% in 2012, and 45.9% in 2013.* BRFSS respondents were defined as having arthritis if they responded "yes" to the question, "Have you ever been told by a doctor or other health professional that you have some form of arthritis, rheumatoid arthritis, gout, lupus, or fibromyalgia?" Veterans were defined as those who responded "yes" to the question, "Have you ever served on active duty in the United States Armed Forces, either in the regular military or in a National Guard or military Reserve unit? Active duty does not include training for the Reserves or National Guard, but does include activation, for example, for the Persian Gulf War." CDC estimated annualized crude and age-specific prevalence of doctor-diagnosed arthritis stratified by veteran status and sex, age-standardized overall and sex-specific prevalence by veteran status across categories of race/ethnicity, highest educational attainment, employment status, income, and body mass index (under/normal weight, overweight, and obese), age-standardized prevalence overall and by sex among veterans for the 50 states, DC, Guam, and Puerto Rico. Data were analyzed using software that accounted for the complex sampling design, including application of sampling weights so that estimates were representative of the noninstitutionalized adult civilian population in each state. Variance was estimated with 95% confidence intervals (CIs) that accounted for the clustered design using the Taylor series linearization method. The 2000 U.S. Projected Population, in three age groups (18–44, 45–64, and =65 years) was used for age-standardization.† Veterans had a higher overall prevalence of reported arthritis than nonveterans, 25.6% (CI = 25.2%–26.1%) versus 23.6% (CI = 23.4%–23.7%). For both men and women, arthritis prevalence was higher among veterans than nonveterans (Table 1). Among male veterans (compared with male nonveterans) arthritis prevalence was higher for all age groups, and age-standardized arthritis prevalence was =5 percentage points higher across most of the sociodemographic categories examined (race/ethnicity, education, income, employment status, and body mass index) (Table 1). Among female veterans (compared with female nonveterans) arthritis prevalence was higher for young (18–44 years) and middle aged (44–64 years) women; age-standardized arthritis prevalence was =5 percentage points higher across most of the sociodemographic categories examined (Table 1). Of the estimated 9.0 million veterans with arthritis, 8.3 million were men and 670,000 were women. Among the 50 states and DC, the median state-specific arthritis prevalence among veterans was 25.4% (range = 19.7% in DC to 32.7% in West Virginia) (Table 2, Figure). Among male veterans, the median state-specific prevalence was 24.7% (range = 18.4% in Hawaii to 32.7% in West Virginia); among women the median was 30.3% (range = 22.4% in Hawaii to 42.7% in Oregon) (Table 2). In each state, veterans comprised a substantial proportion of all persons with arthritis (median = 15.9%; range = 12.6% in Illinois and New Jersey to 22.2% in Alaska) (Table 2). DiscussionVeterans reported arthritis frequently and more often than nonveterans among both men and women and across all sociodemographic groups. Although a high level of physical fitness and good health are required for entry into military service, traumatic and overuse injuries are common during active duty (4). A recent study found that the incidence of osteoarthritis (a condition that represents the largest portion of arthritis cases and for which musculoskeletal injuries are a potent risk factor) was higher among an active duty sample than osteoarthritis incidence reported in civilian populations (5). One of the few previous population-based studies of arthritis prevalence among veterans was a small study based on 2010 BRFSS data from men in five states (Indiana, Mississippi, South Carolina, West Virginia, and Wisconsin) (2). In that study, 44.8% (unadjusted) had arthritis, whereas in the current study, arthritis prevalence in these same five states was lower, ranging from 32.7% in West Virginia to 22.0% in Wisconsin. Two changes in the BRFSS methodology since 2011 might account for this difference. First, cell phone users are now sampled. Inclusion of cell phones captures younger adults who might be missed with previous landline-only data collection; the latter is more likely to capture age groups (middle aged and older adults) with a higher prevalence of arthritis. Second, sampling weights, which are applied to make estimates representative of each states' population, are now calculated using iterative proportional fitting (raking) methods, whereas before 2011, sampling weights were derived using post-stratification procedures.§ Arthritis prevalence was consistently higher among female veterans than their male counterparts. A previously reported estimate among women using U.S. Department of Veterans Affairs (VA) health system services indicated that three in four (77.6% in 2008) had arthritis (6). Although this estimate is considerably higher than the estimate for women overall in the current study (31.3%), VA health system consumers represent a subset of veterans who are more likely to have military service–associated disability (7). In the current study, arthritis prevalence among women veterans who reported being unable to work (67.9%) was almost as high as that in the previous study. This subgroup might be most similar to VA system users. Although the prevalence of arthritis was higher among women, the relative differences in prevalence between veterans and nonveterans was higher for men than women. Patterns across age were also noteworthy. Arthritis was not only highly prevalent among middle aged (45–64 years) veterans (40.3% among women and 36.0% among men) but also among younger veterans (prevalences of 17.3% and 11.6% among women and men aged 18–44 years, respectively) indicating that arthritis and its effects need to be addressed among male and female veterans of all ages. Reducing the impact of arthritis among younger adults might help to stem its debilitating effects in later life. The findings in this report are subject to at least five limitations. First, arthritis was based on self-report. Although recall bias is possible, a validation study among health plan enrollees found that this definition had a positive predictive value of 74.9% among persons aged 45–64 years and a 91.0% positive predictive value among persons ages =65 years (8) and is acceptable for public health surveillance of arthritis. Second, there was insufficient sample size to estimate state-specific arthritis prevalence across the same sociodemographic categories as for the overall estimates (Table 1). Nevertheless, BRFSS collection of veteran status in 2011, 2012, and 2013 allowed analysis of arthritis prevalence across finer sociodemographic categories than previously possible, which was especially important in calculating sex-specific estimates. Third, similar to civilian jobs, there is considerable heterogeneity in military occupations, ranging from sedentary office jobs to physically demanding roles, including combat. BRFSS did not collect information about duration of active duty and work-related risk factors for arthritis during service (e.g., trauma/injury versus physical work demand), and therefore arthritis prevalence across these groups cannot be determined. Fourth, data are cross-sectional and not longitudinal, and therefore, attributing onset of arthritis to veteran status is not appropriate; furthermore, arthritis among veterans might be unrelated to service and attributable instead to risk factors for arthritis (e.g., obesity for osteoarthritis or smoking for rheumatoid arthritis). Finally, results might be subject to selection bias because the median BRFSS response rates were <50% in all three survey years. Nevertheless, the population-based estimates for veterans overall and across sociodemographic categories in this study demonstrate that arthritis among veterans is an important public health concern. The contemporary, state-specific arthritis prevalence estimates provided in this report indicate that veterans with arthritis represented a sizeable portion (with a median of approximately one in six) of adults with arthritis in each state. Because most veterans use health systems other than the VA system (9), strategies for managing arthritis that are accessible to all veterans are essential. Fortunately, multiple self-management strategies have been proven to decrease the adverse effects of arthritis and improve the quality of life of persons with arthritis. These include courses that teach persons with arthritis how to achieve recommended levels of physical activity (e.g., Walk with Ease and EnhanceFitness)¶ and those that teach skills for better managing arthritis and other chronic conditions, including diabetes, heart disease, and chronic lung diseases (e.g., self-management education classes such as the Chronic Disease Self-Management Program).** Although these courses are increasingly available in communities across the United States, even greater availability is needed to ensure they are readily available for the large and growing number of adults with arthritis, including veterans (10). General community offerings of these programs might not appeal to some veterans or accommodate their specific needs or preferences. The high prevalence of arthritis among veterans, coupled with the large absolute number of veterans affected, suggests that dedicated veterans' service organizations in the community and other settings are well-positioned to offer these evidence-based programs to the veteran population. Additionally, health care professionals can have a meaningful impact on improving veterans' quality of life and function by recommending these programs to their patients with arthritis. 1Division of Population Health, National Center for Chronic Disease Prevention and Health Promotion, CDC; 2Health Services Research and Development Service, U.S. Department of Veterans Affairs Medical Center, Durham, North Carolina, and Thurston Arthritis Research Center, University of North Carolina at Chapel Hill; 3Geographic Information Systems Laboratory, University of West Georgia (Corresponding author: Louise B. Murphy, lmurphy1@cdc.gov, 770-488-5464) AcknowledgmentKaren Wooten, MA, Division of Population Health, National Center for Chronic Disease Prevention and Health Promotion, CDC. References
* Additional information available at http://www.cdc.gov/brfss/annual_data/annual_data.htm. † Additional information available at http://www.cdc.gov/nchs/data/statnt/statnt20.pdf. § Post-stratified weights are calculated by aligning each individual characteristic (e.g., sex and age) of the sample with the target population; iterative proportional fitting (raked weights) are calculated by iteratively aligning each specific combination of characteristics (e.g., women aged 18–25 years). Additional information available at http://www.cdc.gov/brfss/annual_data/2013/pdf/weighting_data.pdf. ¶ Additional information available at http://www.cdc.gov/arthritis/interventions/physical_activity.htm. ** Additional information available at http://www.cdc.gov/arthritis/interventions/self_manage.htm. What is already known on this topic? Arthritis is a common chronic condition among veterans, and at least two population-based studies have reported a higher prevalence of arthritis among veterans compared with nonveterans. These arthritis prevalence studies of veterans were conducted before the Persian Gulf War, were small, or examined men only. What is added by this report? To assess the prevalence of doctor-diagnosed arthritis among male and female veterans, CDC analyzed Behavioral Risk Factor Surveillance System survey data from 2011, 2012, and 2013. The analysis found that 25.6% of veterans reported having arthritis (25.0% among men and 31.3% among women) and that prevalence was higher among veterans than nonveterans across most sociodemographic categories. State-specific, age-standardized arthritis prevalence among veterans ranged from 18.8% in Hawaii to 32.7% in West Virginia. What are the implications for public health practice? The high prevalence of arthritis, combined with the large number of persons affected, indicate that strategies are needed to reduce the adverse effects of arthritis. Interventions to improve the quality of life of persons with arthritis include providing access to affordable physical activity and self-management education classes. FIGURE. State-specific, age-standardized estimated prevalence of arthritis among veterans — United States, 2011, 2012, and 2013 Behavioral Risk Factor Surveillance System surveys 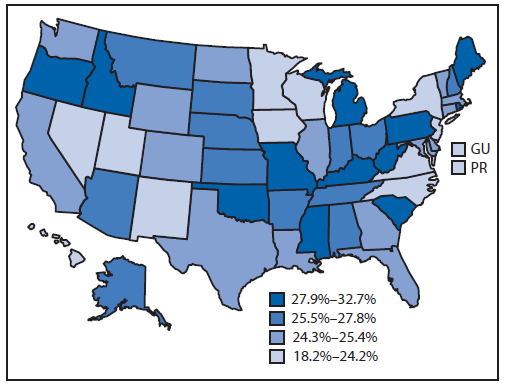
Abbreviations: GU = Guam; PR = Puerto Rico. Alternate Text: The figure above is a map showing state-specific, age-standardized estimated prevalence of arthritis among veterans in the United States in 2011, 2012, and 2013 Behavioral Risk Factor Surveillance System surveys. Among the 50 states and the District of Columbia, the median state-specific arthritis prevalence among veterans was 25.4% (range = 19.7% in the District of Columbia to 32.7% in West Virginia). Syndicated Content Details:
Source URL: http://www.cdc.gov/mmwr/preview/mmwrhtml/mm6344a4.htm Source Agency: Centers for Disease Control and Prevention (CDC) Captured Date: 2016-05-23 22:51:06.0
|