Table I Summary of provisional cases of selected notifiable diseases, United States, cumulative, week ending August 9, 2014 (32nd Week)
Figure I Selected notifiable disease reports, United States, comparison of provisional 4-week totals ending August 9, 2014, with historical data
Table II Provisional cases of selected notifiable diseases, United States, weeks ending August 9, 2014 and August 10, 2013 (32nd Week)
Table III Deaths in 122 U.S. cities, week ending August 9, 2014 (32nd Week)
TABLE I. Provisional cases of infrequently reported notifiable diseases (<1,000 cases reported during the preceding year) — United States, week ending August 9, 2014 (32nd week)* (Export data)
RI (1), NY (2), PA (2), VA (1), NC (2), FL (2), TN (2), WA (1), CA (1)
Measles§§
—
582
2
187
55
220
63
71
Meningococcal disease, invasive¶¶:
A, C, Y, and W-135
2
73
2
142
161
257
280
301
TX (1), MT (1)
serogroup B
1
37
2
99
110
159
135
174
TX (1)
other serogroup
—
15
0
17
20
20
12
23
unknown serogroup
—
145
5
298
260
323
406
482
Novel influenza A virus infections***
—
—
135
21
313
14
4
43,774
Plague
—
2
0
4
4
3
2
8
Poliomyelitis, paralytic
—
—
—
1
—
—
—
1
Polio virus Infection, nonparalytic§
—
—
—
—
—
—
—
—
Psittacosis§
—
—
0
6
2
2
4
9
Q fever, total§
—
77
3
170
135
134
131
113
acute
—
61
2
137
113
110
106
93
chronic
—
16
0
33
22
24
25
20
Rabies, human
—
—
0
2
1
6
2
4
Rubella†††
—
6
0
9
9
4
5
3
Rubella, congenital syndrome
—
—
—
1
3
—
—
2
SARS-CoV§
—
—
—
—
—
—
—
—
Smallpox§
—
—
—
—
—
—
—
—
Streptococcal toxic-shock syndrome§
2
128
2
224
194
168
142
161
MD (1), ID (1)
Syphilis, congenital (age <1 yr)§§§
—
134
8
348
322
360
377
423
Tetanus
—
16
1
26
37
36
26
18
Toxic-shock syndrome (staphylococcal)§
—
32
1
71
65
78
82
74
Trichinellosis
—
8
0
22
18
15
7
13
Tularemia
1
74
5
203
149
166
124
93
MO (1)
Typhoid fever
4
176
10
338
354
390
467
397
RI (1), MD (2), FL (1)
Vancomycin-intermediate Staphylococcus aureus§
—
111
2
248
134
82
91
78
Vancomycin-resistant Staphylococcus aureus§
—
1
0
—
2
—
2
1
Vibriosis (noncholera Vibrio species infections)§
25
427
46
1,299
1,111
832
846
789
RI (2), NY (2), NYC (1), MD (1), VA (3), NC (1), FL (9), TX (2), WA (2), OR (2)
Viral hemorrhagic fever¶¶¶
—
—
—
—
—
—
1
NN
Yellow fever
—
—
—
—
—
—
—
—
TABLE I. (Continued) Provisional cases of infrequently reported notifiable diseases (<1,000 cases reported during the preceding year) — United States, week ending August 9, 2014 (32nd week)*
—: No reported cases. N: Not reportable. NN: Not Nationally Notifiable. Cum: Cumulative year-to-date counts.
† Calculated by summing the incidence counts for the current week, the 2 weeks preceding the current week, and the 2 weeks following the current week, for a total of 5 preceding years. Additional information is available at http://wwwn.cdc.gov/nndss/document/5yearweeklyaverage.pdf.
§ Not reportable in all states. Data from states where the condition is not reportable are excluded from this table except starting in 2007 for the arboviral diseases, STD data, TB data, and influenza-associated pediatric mortality, and in 2003 for SARS-CoV. Reporting exceptions are available at http://wwwn.cdc.gov/nndss/document/SRCA_FINAL_REPORT_2006-2012_final.xlsx.
¶ Includes both neuroinvasive and nonneuroinvasive. Updated weekly from reports to the Division of Vector-Borne Infectious Diseases, National Center for Zoonotic, Vector-Borne, and Enteric Diseases (ArboNET Surveillance). Data for West Nile virus are available in Table II.
** Data for H. influenzae (all ages, all serotypes) are available in Table II.
†† Updated weekly from reports to the Influenza Division, National Center for Immunization and Respiratory Diseases. Since September 29, 2013, 107 influenza-associated pediatric deaths occurring during the 2013-14 influenza season have been reported.
§§ No measles cases were reported for the current week.
¶¶ Data for meningococcal disease (all serogroups) are available in Table II.
*** CDC discontinued reporting of individual confirmed and probable cases of influenza A (H1N1)pdm09 virus infections on July 24, 2009. During 2009, four cases of human infection with novel influenza A viruses, different from the influenza A (H1N1)pdm09 virus, were reported to CDC. The four cases of novel influenza A virus infection reported to CDC during 2010, the fourteen cases reported during 2011, the 313 cases reported in 2012, and the 21 cases reported during 2013 are different from the influenza A (H1N1)pdm09 virus. Total case counts are provided by the Influenza Division, National Center for Immunization and Respiratory Diseases (NCIRD).
††† No rubella cases were reported for the current week.
§§§ Updated weekly from reports to the Division of STD Prevention, National Center for HIV/AIDS, Viral Hepatitis, STD, and TB Prevention.
¶¶¶ There were no cases of viral hemorrhagic fever reported during the current week. See Table II for dengue hemorrhagic fever.
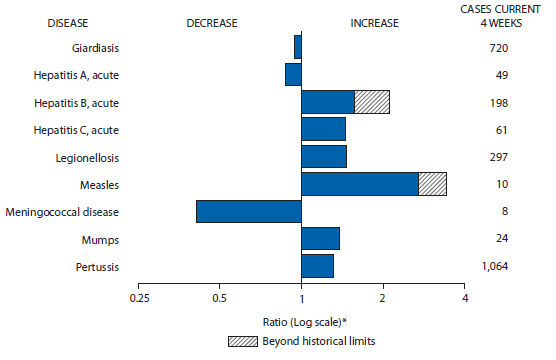
FIGURE I. Selected notifiable disease reports, United States, comparison of provisional 4-week totals August 9, 2014, with historical data
* Ratio of current 4-week total to mean of 15 4-week totals (from previous, comparable, and subsequent 4-week periods for the past 5 years). The point where the hatched area begins is based on the mean and two standard deviations of these 4-week totals.
Alternate Text: The figure above is a bar chart showing selected notifiable disease reports for the United States, with comparison of provisional 4-week totals through August 9, 2014, with historical data. Reports of acute hepatitis B, acute hepatitis C, legionellosis, measles, mumps, and pertussis all increased, with acute hepatitis B and measles increasing beyond historical limits. Reports of giardiasis, acute hepatitis A, and meningococcal disease all decreased.
TABLE II. Provisional cases of selected notifiable diseases, United States, weeks ending August 9, 2014, and August 10, 2013 (32nd week)* (Export data)
Reporting area
Babesiosis
Chlamydia trachomatis infection
Coccidioidomycosis
Current week
Previous 52 weeks
Cum 2014
Cum 2013
Current week
Previous 52 weeks
Cum 2014
Cum 2013
Current week
Previous 52 weeks
Cum 2014
Cum 2013
Med
Max
Med
Max
Med
Max
United States
46
18
119
566
1,051
13,271
25,678
29,630
768,724
860,030
101
180
293
5,477
5,437
New England
11
5
72
291
625
455
834
1,157
24,048
29,589
—
0
2
4
1
Connecticut
—
1
19
86
229
197
238
388
7,570
7,844
N
0
0
N
N
Maine
1
0
6
17
19
—
59
106
1,163
2,031
N
0
0
N
N
Massachusetts
—
2
25
108
322
161
393
679
11,019
14,236
—
0
0
—
—
New Hampshire
—
0
3
11
16
12
31
76
564
1,940
—
0
2
2
1
Rhode Island
10
1
27
69
38
85
88
147
2,622
2,536
—
0
1
2
—
Vermont
—
0
2
—
1
—
36
98
1,110
1,002
N
0
0
N
N
Mid. Atlantic
35
7
55
265
327
2,642
3,418
3,782
104,452
107,544
—
0
0
—
—
New Jersey
—
1
15
75
146
188
566
693
17,285
17,296
N
0
0
N
N
New York (Upstate)
34
3
52
164
134
869
752
1,866
22,452
21,677
N
0
0
N
N
New York City
1
0
10
26
47
562
1,129
1,267
35,186
36,078
N
0
0
N
N
Pennsylvania
N
0
0
N
N
1,023
943
1,324
29,529
32,493
N
0
0
N
N
E.N. Central
—
0
9
6
46
1,359
3,829
4,785
109,506
130,544
—
1
3
33
19
Illinois
—
0
0
—
—
47
943
1,441
23,716
38,266
N
0
0
N
N
Indiana
—
0
1
—
—
297
545
685
16,422
17,458
N
0
0
N
N
Michigan
—
0
1
1
—
472
831
1,091
24,984
27,641
—
0
3
25
11
Ohio
N
0
0
N
N
277
1,038
1,166
31,043
32,776
—
0
1
8
5
Wisconsin
—
0
9
5
46
266
447
539
13,341
14,403
—
0
1
—
3
W.N. Central
—
0
5
—
42
316
1,593
1,826
46,400
50,038
—
2
6
70
61
Iowa
N
0
0
N
N
42
220
263
6,875
6,642
N
0
0
N
N
Kansas
N
0
0
N
N
7
215
258
6,207
6,799
N
0
0
N
N
Minnesota
—
0
5
—
39
19
351
423
9,529
11,384
—
1
6
57
42
Missouri
N
0
0
N
N
155
524
627
15,921
16,726
—
0
1
5
12
Nebraska
—
0
0
—
1
88
149
244
4,728
4,268
—
0
1
1
1
North Dakota
—
0
0
—
1
5
61
83
1,907
1,745
—
0
2
7
6
South Dakota
—
0
0
—
1
—
70
99
1,233
2,474
N
0
0
N
N
S. Atlantic
—
0
1
2
7
4,558
5,397
6,948
167,937
173,572
—
0
2
5
5
Delaware
—
0
1
1
2
90
84
220
2,558
3,139
—
0
1
—
—
District of Columbia
N
0
0
N
N
—
0
190
—
4,075
—
0
1
—
—
Florida
N
0
0
N
N
1,026
1,606
1,829
50,857
49,173
N
0
0
N
N
Georgia
N
0
0
N
N
1,087
1,002
2,050
26,953
30,589
N
0
0
N
N
Maryland
—
0
1
1
4
—
477
804
13,969
15,266
—
0
2
5
5
North Carolina
N
0
0
N
N
823
926
1,840
32,346
31,538
N
0
0
N
N
South Carolina
—
0
1
—
1
627
520
926
16,498
16,306
N
0
0
N
N
Virginia
N
0
0
N
N
803
693
1,267
21,942
20,441
N
0
0
N
N
West Virginia
—
0
0
—
—
102
94
127
2,814
3,045
N
0
0
N
N
E.S. Central
—
0
0
—
—
574
1,727
2,210
49,257
58,306
—
0
0
—
—
Alabama
—
0
0
—
—
—
520
734
13,687
18,397
N
0
0
N
N
Kentucky
N
0
0
N
N
369
325
483
10,121
10,308
N
0
0
N
N
Mississippi
N
0
0
N
N
—
275
987
7,479
11,027
N
0
0
N
N
Tennessee
—
0
0
—
—
205
587
871
17,970
18,574
N
0
0
N
N
W.S. Central
—
0
1
—
1
331
3,198
4,557
91,943
118,924
—
0
1
1
3
Arkansas
N
0
0
N
N
324
287
424
9,404
9,951
N
0
0
N
N
Louisiana
—
0
1
—
1
—
395
1,359
5,822
15,602
—
0
1
1
3
Oklahoma
N
0
0
N
N
7
245
459
5,984
11,407
N
0
0
N
N
Texas
N
0
1
N
N
—
2,359
2,991
70,733
81,964
N
0
0
N
N
Mountain
—
0
0
—
—
498
1,795
2,764
54,267
55,121
90
127
209
4,035
3,477
Arizona
N
0
0
N
N
—
604
1,348
18,427
16,249
90
125
208
3,952
3,384
Colorado
N
0
0
N
N
242
382
592
12,384
12,727
N
0
0
N
N
Idaho
N
0
0
N
N
—
98
156
1,684
3,304
N
0
0
N
N
Montana
—
0
0
—
—
2
75
104
2,317
2,293
—
0
2
7
2
Nevada
N
0
0
N
N
57
209
604
7,398
7,196
—
2
5
41
47
New Mexico
N
0
0
N
N
137
219
353
6,740
7,539
—
0
2
12
20
Utah
—
0
0
—
—
55
149
179
4,434
4,568
—
0
4
21
22
Wyoming
—
0
0
—
—
5
32
67
883
1,245
—
0
1
2
2
Pacific
—
0
1
2
3
2,538
3,986
4,613
120,914
136,392
11
51
93
1,329
1,871
Alaska
N
0
0
N
N
84
111
147
3,375
3,568
—
0
0
—
—
California
—
0
1
2
3
1,764
3,076
3,528
94,162
104,619
11
51
93
1,326
1,867
Hawaii
N
0
0
N
N
—
122
151
3,306
4,089
N
0
0
N
N
Oregon
—
0
0
—
—
344
286
395
9,414
8,784
—
0
1
3
4
Washington
—
0
1
—
—
346
388
596
10,657
15,332
N
0
0
N
N
Territories
American Samoa
N
—
—
N
N
—
—
—
—
—
N
—
—
N
N
C.N.M.I.
—
—
—
—
—
—
—
—
—
—
—
—
—
—
—
Guam
—
0
0
—
—
—
15
22
—
630
—
0
0
—
1
Puerto Rico
N
0
0
N
N
—
95
277
2,716
3,483
N
0
0
N
N
U.S. Virgin Islands
N
0
0
N
N
—
14
23
294
479
—
0
0
—
—
C.N.M.I.: Commonwealth of Northern Mariana Islands.
U: Unavailable. —: No reported cases. N: Not reportable. NN: Not Nationally Notifiable. Cum: Cumulative year-to-date counts. Med: Median. Max: Maximum.
TABLE II. (Continued) Provisional cases of selected notifiable diseases, United States, weeks ending August 9, 2014, and August 10, 2013 (32nd week)* (Export data)
Reporting area
Cryptosporidiosis
Dengue Virus Infection
Dengue Fever†
Dengue Hemorrhagic Fever§
Current week
Previous 52 weeks
Cum 2014
Cum 2013
Current week
Previous 52 weeks
Cum 2014
Cum 2013
Current week
Previous 52 weeks
Cum 2014
Cum 2013
Med
Max
Med
Max
Med
Max
United States
180
112
458
3,514
4,607
—
8
44
148
449
—
0
2
1
5
New England
3
5
14
144
167
—
0
3
6
19
—
0
0
—
—
Connecticut
—
0
5
23
26
—
0
2
1
8
—
0
0
—
—
Maine
—
1
4
29
17
—
0
1
1
1
—
0
0
—
—
Massachusetts
—
2
7
58
85
—
0
0
—
—
—
0
0
—
—
New Hampshire
—
0
4
12
23
—
0
1
—
3
—
0
0
—
—
Rhode Island
—
0
3
10
4
—
0
1
2
6
—
0
0
—
—
Vermont
3
0
3
12
12
—
0
2
2
1
—
0
0
—
—
Mid. Atlantic
27
12
40
362
415
—
3
11
60
117
—
0
1
—
2
New Jersey
—
0
5
13
40
—
0
5
19
—
—
0
0
—
—
New York (Upstate)
14
4
14
122
109
—
0
4
15
34
—
0
1
—
1
New York City
2
2
6
42
34
—
1
9
18
63
—
0
0
—
1
Pennsylvania
11
6
19
185
232
—
0
2
8
20
—
0
0
—
—
E.N. Central
28
22
58
690
852
—
0
6
12
39
—
0
0
—
—
Illinois
—
4
11
89
155
—
0
3
1
13
—
0
0
—
—
Indiana
—
2
7
62
77
—
0
1
—
4
—
0
0
—
—
Michigan
2
4
15
114
142
—
0
3
—
10
—
0
0
—
—
Ohio
15
6
17
191
193
—
0
1
7
6
—
0
0
—
—
Wisconsin
11
7
18
234
285
—
0
2
4
6
—
0
0
—
—
W.N. Central
6
16
200
416
1,324
—
0
3
—
20
—
0
1
1
3
Iowa
—
5
157
148
821
—
0
0
—
—
—
0
1
—
2
Kansas
1
1
7
35
54
—
0
1
—
3
—
0
0
—
—
Minnesota
—
0
17
—
163
—
0
2
—
13
—
0
0
—
1
Missouri
2
3
13
91
109
—
0
1
—
1
—
0
0
—
—
Nebraska
3
2
11
54
71
—
0
0
—
—
—
0
0
—
—
North Dakota
—
1
7
21
33
—
0
0
—
1
—
0
1
1
—
South Dakota
—
3
17
67
73
—
0
1
—
2
—
0
0
—
—
S. Atlantic
98
25
90
921
594
—
2
16
28
125
—
0
1
—
—
Delaware
—
0
2
2
8
—
0
1
1
—
—
0
0
—
—
District of Columbia
N
0
2
N
N
—
0
1
1
—
—
0
0
—
—
Florida
90
9
64
516
205
—
0
13
6
84
—
0
0
—
—
Georgia
2
6
16
145
150
—
0
1
3
7
—
0
0
—
—
Maryland
1
1
5
37
31
—
0
2
6
5
—
0
0
—
—
North Carolina
—
1
28
94
77
—
0
2
5
10
—
0
0
—
—
South Carolina
1
2
8
48
44
—
0
1
1
6
—
0
0
—
—
Virginia
4
3
9
75
66
—
0
3
5
13
—
0
1
—
—
West Virginia
—
0
2
4
13
—
0
1
—
—
—
0
0
—
—
E.S. Central
1
6
17
167
187
—
0
2
2
12
—
0
0
—
—
Alabama
—
2
9
61
73
—
0
2
—
3
—
0
0
—
—
Kentucky
—
1
4
35
48
—
0
0
—
—
—
0
0
—
—
Mississippi
—
1
4
25
25
—
0
1
1
1
—
0
0
—
—
Tennessee
1
2
6
46
41
—
0
1
1
8
—
0
0
—
—
W.S. Central
9
12
47
303
363
—
0
9
7
39
—
0
0
—
—
Arkansas
2
1
12
15
22
—
0
1
1
1
—
0
0
—
—
Louisiana
1
3
33
83
152
—
0
1
1
3
—
0
0
—
—
Oklahoma
2
1
7
47
36
—
0
2
—
1
—
0
0
—
—
Texas
4
7
37
158
153
—
0
9
5
34
—
0
0
—
—
Mountain
6
8
61
227
304
—
0
1
4
6
—
0
0
—
—
Arizona
—
1
5
31
24
—
0
0
—
1
—
0
0
—
—
Colorado
—
1
7
38
50
—
0
0
—
—
—
0
0
—
—
Idaho
3
2
22
41
62
—
0
1
1
—
—
0
0
—
—
Montana
2
1
23
36
36
—
0
1
1
2
—
0
0
—
—
Nevada
—
0
2
8
13
—
0
1
2
2
—
0
0
—
—
New Mexico
—
1
4
36
27
—
0
0
—
—
—
0
0
—
—
Utah
—
1
8
25
58
—
0
0
—
—
—
0
0
—
—
Wyoming
1
0
25
12
34
—
0
0
—
1
—
0
0
—
—
Pacific
2
10
34
284
401
—
1
9
29
72
—
0
0
—
—
Alaska
—
0
1
1
2
—
0
1
2
1
—
0
0
—
—
California
1
6
15
181
156
—
1
9
20
57
—
0
0
—
—
Hawaii
—
0
2
2
1
—
0
2
5
9
—
0
0
—
—
Oregon
1
3
20
67
202
—
0
0
—
—
—
0
0
—
—
Washington
—
0
11
33
40
—
0
2
2
5
—
0
0
—
—
Territories
American Samoa
N
—
—
N
N
—
—
—
—
—
—
—
—
—
—
C.N.M.I.
—
—
—
—
—
—
—
—
—
—
—
—
—
—
—
Guam
—
0
0
—
—
—
0
0
—
—
—
0
0
—
—
Puerto Rico
N
0
0
N
N
—
25
418
375
5,909
—
0
9
2
93
U.S. Virgin Islands
—
0
0
—
—
—
0
5
1
133
—
0
0
—
5
C.N.M.I.: Commonwealth of Northern Mariana Islands.
U: Unavailable. —: No reported cases. N: Not reportable. NN: Not Nationally Notifiable. Cum: Cumulative year-to-date counts. Med: Median. Max: Maximum.
† Dengue Fever includes cases that meet criteria for Dengue Fever with hemorrhage, other clinical and unknown case classifications.
§ DHF includes cases that meet criteria for dengue shock syndrome (DSS), a more severe form of DHF.
TABLE II. (Continued) Provisional cases of selected notifiable diseases, United States, weeks ending August 9, 2014, and August 10, 2013 (32nd week)* (Export data)
Reporting area
Ehrlichiosis/Anaplasmosis†
Ehrlichia chaffeensis
Anaplasma phagocytophilum
Undetermined
Current week
Previous 52 weeks
Cum 2014
Cum 2013
Current week
Previous 52 weeks
Cum 2014
Cum 2013
Current week
Previous 52 weeks
Cum 2014
Cum 2013
Med
Max
Med
Max
Med
Max
United States
21
19
100
805
919
21
33
107
828
1,575
1
2
12
52
119
New England
—
0
9
17
27
3
5
26
224
269
—
0
1
1
—
Connecticut
—
0
0
—
—
—
0
5
14
111
—
0
0
—
—
Maine
—
0
1
6
1
2
2
13
101
47
—
0
1
1
—
Massachusetts
—
0
0
—
—
—
0
0
—
—
—
0
0
—
—
New Hampshire
—
0
1
1
5
—
0
5
31
59
—
0
1
—
—
Rhode Island
—
0
9
9
18
—
0
16
46
34
—
0
0
—
—
Vermont
—
0
2
1
3
1
1
4
32
18
—
0
1
—
—
Mid. Atlantic
3
2
17
76
70
17
10
40
281
312
—
0
3
6
15
New Jersey
—
1
5
27
36
—
0
4
23
67
—
0
2
2
2
New York (Upstate)
3
1
17
40
18
15
7
36
235
225
—
0
3
4
7
New York City
—
0
4
9
11
2
0
5
23
15
—
0
0
—
—
Pennsylvania
—
0
1
—
5
—
0
5
—
5
—
0
2
—
6
E.N. Central
1
1
9
37
67
—
7
39
263
483
—
0
6
19
57
Illinois
—
0
5
29
33
—
0
2
12
8
—
0
0
—
—
Indiana
—
0
0
—
—
—
0
0
—
—
—
0
4
—
27
Michigan
—
0
1
1
1
—
0
1
1
3
—
0
0
—
1
Ohio
1
0
1
3
7
—
0
1
1
3
—
0
1
1
1
Wisconsin
—
0
6
4
26
—
7
39
249
469
—
0
5
18
28
W.N. Central
5
3
29
244
337
—
1
29
18
469
1
0
6
16
30
Iowa
N
0
0
N
N
N
0
0
N
N
N
0
0
N
N
Kansas
—
0
4
29
66
—
0
1
4
5
—
0
1
3
—
Minnesota
—
0
2
—
5
—
0
29
—
456
—
0
6
—
19
Missouri
5
2
26
209
260
—
0
2
9
3
1
0
3
13
9
Nebraska
—
0
2
5
5
—
0
1
1
1
—
0
0
—
—
North Dakota
—
0
1
1
—
—
0
2
4
4
—
0
1
—
2
South Dakota
—
0
0
—
1
—
0
0
—
—
—
0
0
—
—
S. Atlantic
8
4
24
182
176
1
0
4
25
30
—
0
1
1
3
Delaware
1
0
5
16
11
—
0
1
1
—
—
0
0
—
1
District of Columbia
N
0
0
N
N
N
0
0
N
N
N
0
0
N
N
Florida
—
0
3
22
13
—
0
2
4
2
—
0
0
—
—
Georgia
1
0
5
20
17
—
0
0
—
—
—
0
0
—
—
Maryland
3
0
5
26
16
—
0
2
7
4
—
0
1
—
—
North Carolina
—
0
13
33
40
—
0
3
4
5
—
0
0
—
—
South Carolina
—
0
2
4
6
—
0
0
—
—
—
0
0
—
—
Virginia
2
1
8
59
72
1
0
2
9
16
—
0
1
1
—
West Virginia
1
0
1
2
1
—
0
0
—
3
—
0
0
—
2
E.S. Central
1
2
13
107
114
—
0
1
2
6
—
0
2
7
5
Alabama
—
0
2
9
9
—
0
1
2
1
—
0
1
—
—
Kentucky
1
1
7
45
43
—
0
0
—
—
—
0
0
—
—
Mississippi
—
0
0
—
3
—
0
0
—
1
—
0
0
—
1
Tennessee
—
1
8
53
59
—
0
1
—
4
—
0
2
7
4
W.S. Central
3
3
63
142
127
—
0
8
15
6
—
0
0
—
—
Arkansas
3
1
15
101
113
—
0
2
11
4
—
0
0
—
—
Louisiana
—
0
1
1
—
—
0
0
—
1
—
0
0
—
—
Oklahoma
—
0
62
32
10
—
0
8
3
1
—
0
0
—
—
Texas
—
0
2
8
4
—
0
1
1
—
—
0
0
—
—
Mountain
—
0
1
—
1
—
0
1
—
—
—
0
1
—
1
Arizona
—
0
0
—
—
—
0
0
—
—
—
0
1
—
1
Colorado
N
0
0
N
N
N
0
0
N
N
N
0
0
N
N
Idaho
N
0
0
N
N
N
0
0
N
N
N
0
0
N
N
Montana
—
0
0
—
1
—
0
0
—
—
—
0
0
—
—
Nevada
—
0
0
—
—
—
0
1
—
—
—
0
0
—
—
New Mexico
N
0
0
N
N
N
0
0
N
N
N
0
0
N
N
Utah
—
0
1
—
—
—
0
0
—
—
—
0
0
—
—
Wyoming
—
0
0
—
—
—
0
0
—
—
—
0
0
—
—
Pacific
—
0
0
—
—
—
0
2
—
—
—
0
1
2
8
Alaska
N
0
0
N
N
N
0
0
N
N
N
0
0
N
N
California
—
0
0
—
—
—
0
0
—
—
—
0
1
2
8
Hawaii
N
0
0
N
N
N
0
0
N
N
N
0
0
N
N
Oregon
—
0
0
—
—
—
0
1
—
—
—
0
0
—
—
Washington
—
0
0
—
—
—
0
2
—
—
—
0
0
—
—
Territories
American Samoa
N
—
—
N
N
N
—
—
N
N
N
—
—
N
N
C.N.M.I.
—
—
—
—
—
—
—
—
—
—
—
—
—
—
—
Guam
N
0
0
N
N
N
0
0
N
N
N
0
0
N
N
Puerto Rico
N
0
0
N
N
N
0
0
N
N
N
0
0
N
N
U.S. Virgin Islands
—
0
0
—
—
—
0
0
—
—
—
0
0
—
—
C.N.M.I.: Commonwealth of Northern Mariana Islands.
U: Unavailable. —: No reported cases. N: Not reportable. NN: Not Nationally Notifiable. Cum: Cumulative year-to-date counts. Med: Median. Max: Maximum.
† Cumulative total E. ewingii cases reported for year 2013 = 31, and 7 cases reported for 2014.
TABLE II. (Continued) Provisional cases of selected notifiable diseases, United States, weeks ending August 9, 2014, and August 10, 2013 (32nd week)* (Export data)
Reporting area
Giardiasis
Gonorrhea
Haemophilus influenzae, invasive† All ages, all serotypes
Current week
Previous 52 weeks
Cum 2014
Cum 2013
Current week
Previous 52 weeks
Cum 2014
Cum 2013
Current week
Previous 52 weeks
Cum 2014
Cum 2013
Med
Max
Med
Max
Med
Max
United States
182
231
439
6,865
8,258
3,167
6,001
7,239
182,329
200,345
30
62
110
2,016
2,502
New England
9
25
59
663
737
51
131
185
3,719
3,856
—
4
16
122
238
Connecticut
—
4
11
117
118
—
49
116
1,303
1,625
—
1
3
31
38
Maine
5
4
12
88
107
—
4
9
91
165
—
0
2
12
16
Massachusetts
—
12
24
337
388
36
64
113
1,892
1,700
—
2
14
51
156
New Hampshire
—
1
7
31
55
4
2
10
103
84
—
0
2
15
17
Rhode Island
1
0
7
29
16
11
7
41
288
226
—
0
9
8
4
Vermont
3
3
16
61
53
—
1
6
42
56
—
0
2
5
7
Mid. Atlantic
53
50
94
1,417
1,541
595
745
926
22,513
24,634
13
10
24
341
397
New Jersey
—
4
12
92
210
27
128
164
3,785
4,225
—
2
7
91
77
New York (Upstate)
23
17
61
534
471
155
117
339
3,463
3,759
1
3
17
83
96
New York City
16
14
26
442
469
157
250
324
7,732
8,328
4
2
7
75
77
Pennsylvania
14
13
28
349
391
256
252
326
7,533
8,322
8
3
7
92
147
E.N. Central
17
29
65
775
1,121
312
917
1,240
26,277
33,858
3
9
19
266
408
Illinois
—
2
22
29
184
7
197
375
4,954
9,962
—
2
6
73
105
Indiana
—
3
11
62
127
86
140
190
4,151
4,433
—
2
6
48
92
Michigan
4
9
27
261
281
65
181
271
5,539
6,565
—
2
5
51
65
Ohio
8
8
25
226
293
91
317
391
9,320
10,109
3
2
9
82
96
Wisconsin
5
6
15
197
236
63
81
123
2,313
2,789
—
1
5
12
50
W.N. Central
18
17
65
434
877
141
332
421
9,988
10,470
—
4
14
151
172
Iowa
4
4
15
118
144
10
28
43
866
891
—
0
1
2
—
Kansas
—
2
6
45
59
4
48
64
1,485
1,261
—
0
3
20
29
Minnesota
—
0
24
—
347
6
70
107
2,033
2,272
—
1
8
61
51
Missouri
4
4
12
97
140
106
140
180
4,201
4,496
—
1
6
48
67
Nebraska
9
2
9
78
101
14
27
52
847
812
—
0
3
16
17
North Dakota
—
1
3
24
26
1
10
22
324
280
—
0
2
4
7
South Dakota
1
2
9
72
60
—
14
26
232
458
—
0
1
—
1
S. Atlantic
36
47
73
1,349
1,409
1,103
1,392
1,750
43,391
44,864
4
16
30
550
643
Delaware
—
0
3
9
11
37
25
65
748
763
—
0
3
12
8
District of Columbia
—
1
4
16
49
—
0
82
—
1,495
—
0
1
2
10
Florida
28
22
34
659
622
247
403
525
12,755
12,568
2
5
13
198
191
Georgia
—
12
26
306
373
302
248
612
7,029
8,847
—
2
8
75
103
Maryland
2
4
9
125
133
—
106
175
2,942
3,308
—
2
5
60
64
North Carolina
N
0
0
N
N
204
265
512
9,746
8,747
1
2
8
93
103
South Carolina
1
3
9
83
67
174
154
279
4,812
4,395
—
1
5
42
74
Virginia
3
5
11
122
128
125
151
372
4,847
4,104
1
1
7
44
64
West Virginia
2
1
4
29
26
14
17
34
512
637
—
0
3
24
26
E.S. Central
—
3
8
86
104
155
433
566
12,009
15,864
2
4
8
145
184
Alabama
—
3
8
86
104
—
142
202
3,529
5,299
—
1
4
42
56
Kentucky
N
0
0
N
N
113
82
109
2,379
2,609
—
0
3
19
34
Mississippi
N
0
0
N
N
—
77
276
2,084
3,301
1
0
2
19
20
Tennessee
N
0
0
N
N
42
130
210
4,017
4,655
1
2
6
65
74
W.S. Central
3
6
13
175
205
84
895
1,327
24,774
31,175
4
4
11
127
113
Arkansas
2
2
8
55
57
80
80
143
2,754
2,494
1
0
3
31
17
Louisiana
1
5
12
120
148
—
119
397
1,580
4,669
—
1
6
34
33
Oklahoma
—
0
0
—
—
4
76
146
1,828
3,073
3
2
9
56
61
Texas
N
0
0
N
N
—
627
802
18,612
20,939
—
0
1
6
2
Mountain
6
20
45
588
670
49
324
469
10,024
8,261
2
6
13
202
225
Arizona
—
2
7
55
57
—
138
262
4,290
3,216
—
1
8
67
85
Colorado
—
7
19
197
199
24
54
90
1,690
1,673
—
1
6
30
58
Idaho
2
2
7
79
83
—
4
15
95
89
—
0
3
13
10
Montana
3
2
6
47
41
1
6
13
186
109
2
0
1
7
2
Nevada
1
1
5
31
58
9
53
124
1,858
1,541
—
0
2
12
11
New Mexico
—
1
7
43
68
5
39
81
1,134
1,121
—
1
3
32
27
Utah
—
4
9
121
139
10
23
34
722
477
—
1
6
39
28
Wyoming
—
0
2
15
25
—
1
5
49
35
—
0
1
2
4
Pacific
40
51
125
1,378
1,594
677
952
1,126
29,634
27,363
2
3
8
112
122
Alaska
2
1
7
44
36
13
25
42
745
612
—
0
3
13
9
California
22
31
104
949
1,070
518
796
945
24,794
22,725
1
1
2
25
28
Hawaii
—
0
4
15
36
—
14
28
425
450
—
0
2
18
19
Oregon
3
7
15
196
205
54
36
71
1,232
1,017
—
1
4
51
62
Washington
13
8
66
174
247
92
83
121
2,438
2,559
1
0
3
5
4
Territories
American Samoa
—
—
—
—
—
—
—
—
—
—
—
—
—
—
—
C.N.M.I.
—
—
—
—
—
—
—
—
—
—
—
—
—
—
—
Guam
—
0
0
—
2
—
0
9
—
58
—
0
0
—
—
Puerto Rico
—
0
9
20
31
—
8
21
262
195
—
0
1
—
—
U.S. Virgin Islands
—
0
0
—
—
—
1
5
32
39
—
0
0
—
—
C.N.M.I.: Commonwealth of Northern Mariana Islands.
U: Unavailable. —: No reported cases. N: Not reportable. NN: Not Nationally Notifiable. Cum: Cumulative year-to-date counts. Med: Median. Max: Maximum.
† Data for H. influenzae (age <5 yrs for serotype b, nonserotype b, and unknown serotype) are available in Table I.
TABLE II. (Continued) Provisional cases of selected notifiable diseases, United States, weeks ending August 9, 2014, and August 10, 2013 (32nd week)* (Export data)
Reporting area
Hepatitis (viral, acute), by type
A
B
C
Current week
Previous 52 weeks
Cum 2014
Cum 2013
Current week
Previous 52 weeks
Cum 2014
Cum 2013
Current week
Previous 52 weeks
Cum 2014
Cum 2013
Med
Max
Med
Max
Med
Max
United States
15
23
55
635
1,078
68
54
102
1,622
1,799
8
38
67
1,044
1,226
New England
—
1
6
38
58
—
1
7
32
58
—
3
9
90
123
Connecticut
—
0
3
14
13
—
0
2
7
3
—
0
1
3
—
Maine
—
0
2
2
3
—
0
1
7
8
—
0
2
19
4
Massachusetts
—
0
3
15
27
—
1
7
14
46
—
2
7
67
116
New Hampshire
—
0
1
2
6
—
0
2
—
—
N
0
0
N
N
Rhode Island
—
0
1
3
2
U
0
0
U
U
U
0
0
U
U
Vermont
—
0
1
2
7
—
0
2
4
1
—
0
1
1
3
Mid. Atlantic
3
4
16
80
158
1
3
9
98
149
4
5
15
148
177
New Jersey
—
0
6
9
41
—
0
4
2
44
—
1
4
24
69
New York (Upstate)
2
1
5
18
39
—
1
3
25
27
2
2
11
59
53
New York City
—
1
7
27
40
—
1
4
31
48
1
0
4
14
9
Pennsylvania
1
1
4
26
38
1
1
4
40
30
1
1
6
51
46
E.N. Central
—
4
9
91
185
58
9
57
369
286
—
6
35
188
214
Illinois
—
1
5
29
35
—
1
5
26
59
—
0
2
9
25
Indiana
—
0
3
12
18
—
2
7
55
59
—
2
8
37
103
Michigan
—
1
4
25
66
1
1
4
31
35
—
2
6
58
43
Ohio
—
0
4
21
41
—
4
12
134
128
—
2
30
79
17
Wisconsin
—
0
3
4
25
57
0
54
123
5
—
0
3
5
26
W.N. Central
—
1
6
33
41
1
2
5
46
64
1
1
4
24
49
Iowa
—
0
3
4
3
—
0
2
6
7
—
0
0
—
—
Kansas
—
0
3
3
4
—
0
1
5
9
—
0
3
17
10
Minnesota
—
0
2
2
20
—
0
1
1
15
—
0
3
1
35
Missouri
—
0
2
12
2
1
1
4
26
26
1
0
2
5
—
Nebraska
—
0
2
8
7
—
0
2
6
4
—
0
1
1
2
North Dakota
—
0
2
4
3
—
0
1
1
—
—
0
1
—
2
South Dakota
—
0
1
—
2
—
0
1
1
3
—
0
1
—
—
S. Atlantic
6
5
11
145
143
4
17
26
521
529
1
8
18
233
239
Delaware
—
0
1
—
2
—
0
1
4
7
U
0
0
U
U
District of Columbia
—
0
0
—
—
—
0
0
—
—
—
0
0
—
—
Florida
3
2
6
58
45
2
7
14
202
180
1
2
6
54
82
Georgia
1
1
3
28
22
—
2
6
68
74
—
0
4
14
34
Maryland
—
0
3
15
18
—
1
3
21
30
—
1
3
27
34
North Carolina
—
0
2
20
30
—
1
16
71
42
—
2
9
64
42
South Carolina
—
0
1
4
7
—
1
3
17
30
—
0
1
3
—
Virginia
2
0
3
15
18
—
1
5
31
42
—
1
5
34
21
West Virginia
—
0
1
5
1
2
3
8
107
124
—
1
6
37
26
E.S. Central
—
1
4
22
34
2
11
17
325
369
—
6
13
170
231
Alabama
—
0
2
5
4
1
2
5
62
53
—
0
5
18
13
Kentucky
—
0
2
7
17
—
4
8
93
115
—
4
9
95
147
Mississippi
—
0
1
2
2
—
1
3
24
39
U
0
0
U
U
Tennessee
—
0
2
8
11
1
5
10
146
162
—
2
4
57
71
W.S. Central
5
3
12
86
70
2
5
18
120
179
1
2
9
52
61
Arkansas
—
0
1
1
5
—
0
4
10
38
—
0
5
7
15
Louisiana
—
0
3
5
5
—
1
6
37
41
—
0
3
12
12
Oklahoma
—
0
4
12
6
—
0
5
15
24
1
0
5
9
19
Texas
5
2
8
68
54
2
2
10
58
76
—
0
4
24
15
Mountain
—
2
5
44
145
—
1
5
27
58
1
2
6
48
47
Arizona
—
0
3
11
52
—
0
2
9
14
U
0
0
U
U
Colorado
—
0
2
7
46
—
0
2
1
15
—
0
2
4
15
Idaho
—
0
1
3
5
—
0
2
3
6
—
0
1
3
6
Montana
—
0
1
5
4
—
0
1
—
1
1
0
2
11
12
Nevada
—
0
2
6
14
—
0
3
11
18
—
0
1
2
7
New Mexico
—
0
2
8
15
—
0
1
—
1
—
0
2
10
3
Utah
—
0
2
3
9
—
0
1
3
3
—
0
2
18
4
Wyoming
—
0
1
1
—
—
0
0
—
—
—
0
0
—
—
Pacific
1
3
9
96
244
—
4
13
84
107
—
3
10
91
85
Alaska
—
0
1
1
1
—
0
1
2
1
—
0
0
—
—
California
—
3
8
73
188
—
2
7
45
71
—
1
4
34
47
Hawaii
—
0
2
3
14
—
0
1
3
4
—
0
0
—
—
Oregon
—
0
3
8
20
—
0
3
21
21
—
0
2
11
8
Washington
1
0
3
11
21
—
0
7
13
10
—
1
9
46
30
Territories
American Samoa
—
—
—
—
—
—
—
—
—
—
—
—
—
—
—
C.N.M.I.
—
—
—
—
—
—
—
—
—
—
—
—
—
—
—
Guam
—
0
7
—
23
—
0
7
—
47
—
0
9
—
41
Puerto Rico
—
0
1
2
8
—
0
2
9
30
N
0
0
N
N
U.S. Virgin Islands
—
0
0
—
—
—
0
0
—
—
—
0
0
—
—
C.N.M.I.: Commonwealth of Northern Mariana Islands.
U: Unavailable. —: No reported cases. N: Not reportable. NN: Not Nationally Notifiable. Cum: Cumulative year-to-date counts. Med: Median. Max: Maximum.
TABLE II. (Continued) Provisional cases of selected notifiable diseases, United States, weeks ending August 9, 2014, and August 10, 2013 (32nd week)* (Export data)
Reporting area
Invasive Pneumococcal disease†
Legionellosis
All ages
Age <5
Current week
Previous 52 weeks
Cum 2014
Cum 2013
Current week
Previous 52 weeks
Cum 2014
Cum 2013
Current week
Previous 52 weeks
Cum 2014
Cum 2013
Med
Max
Med
Max
Med
Max
United States
58
276
752
8,805
11,314
6
21
56
602
740
57
75
163
2,277
2,946
New England
—
12
24
383
471
—
1
2
27
27
—
4
22
112
194
Connecticut
—
4
10
140
233
—
0
1
5
11
—
1
3
28
38
Maine
—
2
8
98
84
—
0
1
5
3
—
0
3
10
9
Massachusetts
—
0
2
17
12
—
0
2
13
11
—
2
15
55
111
New Hampshire
—
1
6
51
55
—
0
1
3
2
—
0
3
6
15
Rhode Island
—
1
10
42
45
—
0
1
1
—
—
0
10
11
11
Vermont
—
1
4
35
42
—
0
0
—
—
—
0
1
2
10
Mid. Atlantic
9
31
115
950
1,551
—
2
10
42
80
23
17
56
500
885
New Jersey
—
2
19
32
413
—
0
2
2
25
—
1
15
33
161
New York (Upstate)
6
15
76
517
671
—
1
6
23
32
11
6
21
207
268
New York City
3
12
25
401
467
—
0
4
17
23
5
3
15
96
197
Pennsylvania
N
—
—
N
N
N
0
0
N
N
7
5
17
164
259
E.N. Central
15
53
84
1,559
2,117
2
3
9
97
116
11
17
47
479
831
Illinois
N
0
0
N
N
—
1
3
22
28
—
3
18
86
183
Indiana
—
10
33
329
459
—
1
4
20
16
3
2
8
74
54
Michigan
1
11
21
363
534
—
0
4
19
30
—
3
16
68
173
Ohio
12
20
38
632
814
1
1
4
28
26
8
6
23
219
334
Wisconsin
2
6
16
235
310
1
0
3
8
16
—
1
8
32
87
W.N. Central
—
16
37
435
719
—
1
4
27
66
1
3
19
118
108
Iowa
N
0
0
N
N
N
0
0
N
N
—
0
2
15
7
Kansas
—
2
9
87
102
N
0
0
N
N
—
0
3
7
9
Minnesota
—
6
18
159
372
—
0
3
8
25
—
1
4
27
29
Missouri
N
0
0
N
N
—
0
2
10
24
—
1
10
52
45
Nebraska
—
3
8
88
102
—
0
2
7
8
1
0
2
9
13
North Dakota
—
1
4
43
74
—
0
1
2
9
—
0
1
3
—
South Dakota
—
2
5
58
69
N
0
0
N
N
—
0
2
5
5
S. Atlantic
11
57
134
2,079
2,477
—
5
10
154
186
19
15
31
452
441
Delaware
1
0
5
25
22
—
0
1
1
—
—
0
2
11
11
District of Columbia
—
1
6
44
62
—
0
1
1
1
N
0
1
N
N
Florida
5
16
45
646
776
—
1
5
55
60
10
5
15
161
129
Georgia
1
17
61
591
726
—
1
5
36
52
—
1
9
44
47
Maryland
2
7
21
296
348
—
0
4
18
20
2
3
9
71
103
North Carolina
—
0
0
—
—
N
0
0
N
N
1
2
11
77
51
South Carolina
2
7
27
298
307
—
0
2
20
13
—
0
3
25
11
Virginia
—
0
3
15
—
—
0
3
14
28
5
1
8
48
73
West Virginia
—
4
15
164
236
—
0
2
9
12
1
0
4
15
16
E.S. Central
5
25
51
886
1,009
1
1
6
64
65
1
4
18
177
107
Alabama
—
3
10
131
129
—
0
2
10
14
—
1
10
37
13
Kentucky
—
4
10
121
190
—
0
2
8
9
1
1
7
40
28
Mississippi
—
3
13
146
162
—
0
2
15
13
—
0
2
9
12
Tennessee
5
15
28
488
528
1
1
4
31
29
—
2
11
91
54
W.S. Central
16
35
305
1,276
1,438
2
4
20
118
104
1
5
29
174
118
Arkansas
2
4
30
130
144
—
0
2
6
7
—
0
5
23
16
Louisiana
1
6
23
252
237
—
0
2
16
14
—
0
4
22
21
Oklahoma
—
0
0
—
—
1
0
2
19
13
—
0
4
10
3
Texas
13
25
263
894
1,057
1
2
18
77
70
1
3
24
119
78
Mountain
2
30
81
1,126
1,421
1
2
7
61
81
—
3
9
73
98
Arizona
1
13
40
510
574
1
1
6
27
30
—
1
4
27
41
Colorado
—
8
24
250
358
—
0
2
11
17
—
0
7
11
17
Idaho
N
0
0
N
N
—
0
1
3
3
—
0
2
5
6
Montana
—
0
4
25
20
—
0
0
—
1
—
0
1
2
8
Nevada
1
2
7
87
90
—
0
2
5
4
—
0
3
11
10
New Mexico
—
5
16
214
234
—
0
3
11
9
—
0
2
2
5
Utah
—
1
11
28
132
—
0
2
3
17
—
0
3
15
11
Wyoming
—
0
3
12
13
—
0
1
1
—
—
0
0
—
—
Pacific
—
3
8
111
111
—
0
3
12
15
1
5
13
192
164
Alaska
—
2
5
51
64
—
0
2
6
12
—
0
1
1
1
California
N
0
0
N
N
N
0
0
N
N
—
4
11
147
131
Hawaii
—
2
6
60
47
—
0
2
6
3
—
0
1
4
4
Oregon
N
0
0
N
N
N
0
0
N
N
—
0
2
15
10
Washington
N
0
0
N
N
N
0
0
N
N
1
0
6
25
18
Territories
American Samoa
N
—
—
N
N
—
—
—
—
—
N
—
—
N
N
C.N.M.I.
—
—
—
—
—
—
—
—
—
—
—
—
—
—
—
Guam
—
0
2
—
13
—
0
0
—
—
—
0
0
—
—
Puerto Rico
—
0
0
—
—
—
0
0
—
—
—
0
1
1
12
U.S. Virgin Islands
—
0
0
—
—
—
0
0
—
—
—
0
0
—
—
C.N.M.I.: Commonwealth of Northern Mariana Islands.
U: Unavailable. —: No reported cases. N: Not reportable. NN: Not Nationally Notifiable. Cum: Cumulative year-to-date counts. Med: Median. Max: Maximum.
† Includes drug resistant and susceptible cases of Invasive Pneumococcal Disease. This condition was previously named Streptococcus pneumoniae invasive disease and cases were reported to CDC using different event codes to specify whether the cases were drug resistant or in a defined age group, such as <5 years. Since 2010, case notifications for this condition were consolidated under one event code for Invasive pneumococcal disease.
TABLE II. (Continued) Provisional cases of selected notifiable diseases, United States, weeks ending August 9, 2014, and August 10, 2013 (32nd week)* (Export data)
Reporting area
Lyme disease
Malaria
Meningococcal disease, invasive† All serogroups
Current week
Previous 52 weeks
Cum 2014
Cum 2013
Current week
Previous 52 weeks
Cum 2014
Cum 2013
Current week
Previous 52 weeks
Cum 2014
Cum 2013
Med
Max
Med
Max
Med
Max
United States
403
426
1,532
13,573
23,274
19
25
51
794
937
3
8
24
270
378
New England
29
128
513
3,789
8,856
1
2
8
48
75
—
0
3
9
15
Connecticut
1
23
118
808
2,162
—
0
2
7
17
—
0
1
1
2
Maine
19
16
74
553
773
—
0
2
4
3
—
0
1
—
2
Massachusetts
—
48
186
1,543
3,856
—
1
4
25
46
—
0
3
7
5
New Hampshire
—
9
56
253
1,254
1
0
2
3
6
—
0
0
—
2
Rhode Island
6
9
57
354
300
—
0
8
7
—
—
0
1
1
1
Vermont
3
10
57
278
511
—
0
2
2
3
—
0
1
—
3
Mid. Atlantic
301
179
744
7,341
8,534
10
8
21
213
217
—
1
3
26
57
New Jersey
1
41
129
1,065
2,652
—
1
6
40
59
—
0
2
5
11
New York (Upstate)
149
49
235
1,628
1,710
4
1
5
36
31
—
0
3
5
14
New York City
5
3
441
499
435
6
3
13
101
85
—
0
2
8
14
Pennsylvania
146
61
515
4,149
3,737
—
1
4
36
42
—
0
2
8
18
E.N. Central
6
18
106
725
1,857
1
2
6
63
97
—
1
4
31
40
Illinois
—
1
15
85
276
—
1
4
20
47
—
0
2
10
7
Indiana
—
0
3
3
91
—
0
2
4
13
—
0
1
3
12
Michigan
2
2
14
46
84
—
0
2
10
12
—
0
2
8
3
Ohio
4
1
7
43
56
1
1
3
25
17
—
0
2
6
7
Wisconsin
—
14
73
548
1,350
—
0
2
4
8
—
0
1
4
11
W.N. Central
—
8
139
141
1,887
1
2
7
43
65
—
0
3
16
29
Iowa
—
1
13
106
202
—
0
2
8
6
—
0
1
1
1
Kansas
—
0
3
7
18
—
0
2
8
7
—
0
1
1
3
Minnesota
—
0
129
3
1,642
—
0
5
2
40
—
0
2
4
9
Missouri
—
0
1
5
1
1
0
1
11
2
—
0
2
7
6
Nebraska
—
0
4
10
7
—
0
2
6
3
—
0
1
—
3
North Dakota
—
0
4
8
14
—
0
1
6
2
—
0
1
1
3
South Dakota
—
0
1
2
3
—
0
1
2
5
—
0
1
2
4
S. Atlantic
64
46
309
1,396
1,884
6
7
17
259
259
—
1
6
62
68
Delaware
5
8
24
252
299
—
0
1
2
6
—
0
1
1
2
District of Columbia
N
0
4
N
N
—
0
2
3
12
—
0
0
—
—
Florida
9
2
8
58
65
3
1
3
33
35
—
1
3
29
35
Georgia
—
0
3
3
6
—
1
5
52
48
—
0
2
10
9
Maryland
19
16
51
513
779
3
2
10
96
87
—
0
1
4
3
North Carolina
—
0
27
64
82
—
0
7
25
15
—
0
3
11
10
South Carolina
—
1
5
14
13
—
0
1
2
8
—
0
1
2
2
Virginia
30
14
267
426
547
—
1
5
44
47
—
0
2
5
5
West Virginia
1
2
11
66
93
—
0
1
2
1
—
0
0
—
2
E.S. Central
1
2
10
88
38
—
1
4
26
25
—
0
2
11
9
Alabama
—
0
6
35
14
—
0
1
6
2
—
0
1
4
2
Kentucky
—
1
9
31
15
—
0
2
8
8
—
0
1
2
1
Mississippi
—
0
0
—
—
—
0
1
1
2
—
0
1
1
3
Tennessee
1
0
4
22
9
—
0
2
11
13
—
0
1
4
3
W.S. Central
—
0
13
9
44
—
1
21
46
60
2
1
6
29
37
Arkansas
—
0
0
—
—
—
0
1
2
1
—
0
1
1
5
Louisiana
—
0
1
1
—
—
0
1
6
6
—
0
2
5
8
Oklahoma
—
0
2
—
1
—
0
2
2
7
—
0
2
7
5
Texas
—
0
11
8
43
—
1
19
36
46
2
0
5
16
19
Mountain
—
1
6
22
63
—
1
6
31
59
1
0
3
21
30
Arizona
—
0
2
5
13
—
0
3
15
25
—
0
2
9
10
Colorado
—
0
0
—
—
—
0
3
6
20
—
0
1
1
5
Idaho
—
0
1
6
11
—
0
1
1
3
—
0
1
2
4
Montana
—
0
2
6
12
—
0
1
1
—
1
0
1
4
—
Nevada
—
0
1
3
5
—
0
2
6
5
—
0
1
2
1
New Mexico
—
0
1
—
4
—
0
1
1
1
—
0
1
2
1
Utah
—
0
2
2
15
—
0
1
1
5
—
0
1
1
7
Wyoming
—
0
1
—
3
—
0
0
—
—
—
0
1
—
2
Pacific
2
2
10
62
111
—
3
9
65
80
—
2
7
65
93
Alaska
—
0
3
13
6
—
0
1
1
2
—
0
0
—
—
California
—
0
8
4
69
—
2
5
40
56
—
1
5
42
75
Hawaii
N
0
0
N
N
—
0
0
—
1
—
0
1
1
1
Oregon
1
1
4
42
30
—
0
1
7
6
—
0
3
14
9
Washington
1
0
4
3
6
—
0
3
17
15
—
0
5
8
8
Territories
American Samoa
N
—
—
N
N
—
—
—
—
—
—
—
—
—
—
C.N.M.I.
—
—
—
—
—
—
—
—
—
—
—
—
—
—
—
Guam
—
0
0
—
—
—
0
0
—
—
—
0
0
—
1
Puerto Rico
N
0
0
N
N
—
0
1
1
—
—
0
1
1
1
U.S. Virgin Islands
N
0
0
N
N
—
0
0
—
—
—
0
0
—
—
C.N.M.I.: Commonwealth of Northern Mariana Islands.
U: Unavailable. —: No reported cases. N: Not reportable. NN: Not Nationally Notifiable. Cum: Cumulative year-to-date counts. Med: Median. Max: Maximum.
† Data for meningococcal disease, invasive caused by serogroups A, C, Y, and W-135; serogroup B; other serogroup; and unknown serogroup are available in Table I.
TABLE II. (Continued) Provisional cases of selected notifiable diseases, United States, weeks ending August 9, 2014, and August 10, 2013 (32nd week)* (Export data)
Reporting area
Mumps
Pertussis
Rabies, animal
Current week
Previous 52 weeks
Cum 2014
Cum 2013
Current week
Previous 52 weeks
Cum 2014
Cum 2013
Current week
Previous 52 weeks
Cum 2014
Cum 2013
Med
Max
Med
Max
Med
Max
United States
3
11
117
965
415
203
576
1,036
16,760
15,823
45
56
137
1,492
2,255
New England
—
0
2
7
69
—
15
38
516
755
10
5
13
160
186
Connecticut
—
0
0
—
4
—
1
6
21
27
2
3
12
79
80
Maine
—
0
0
—
1
—
5
27
258
219
3
1
3
26
31
Massachusetts
—
0
2
5
62
—
4
13
92
240
—
0
0
—
—
New Hampshire
—
0
2
2
1
—
1
3
35
106
1
0
2
9
24
Rhode Island
—
0
1
—
—
—
2
23
74
57
—
0
4
12
16
Vermont
—
0
0
—
1
—
0
5
36
106
4
1
4
34
35
Mid. Atlantic
1
2
25
142
45
37
34
63
1,025
1,138
15
9
33
202
447
New Jersey
—
1
20
27
7
—
6
13
154
261
—
0
0
—
—
New York (Upstate)
1
0
2
8
4
28
13
40
434
408
15
6
19
202
204
New York City
—
1
24
100
18
—
1
10
32
60
—
0
5
—
27
Pennsylvania
—
0
2
7
16
9
12
26
405
409
—
0
12
—
216
E.N. Central
1
3
107
721
39
25
90
200
2,558
2,459
6
1
24
42
70
Illinois
—
1
15
110
23
—
11
35
263
443
4
0
6
14
23
Indiana
—
0
3
21
2
—
9
29
223
264
—
0
1
—
6
Michigan
—
0
1
8
4
1
20
44
579
469
—
0
5
17
20
Ohio
1
1
97
523
9
24
28
104
963
579
2
0
19
11
21
Wisconsin
—
0
10
59
1
—
23
54
530
704
N
0
0
N
N
W.N. Central
—
0
6
18
7
5
41
95
999
1,297
1
2
11
65
152
Iowa
—
0
1
2
1
—
3
13
87
209
—
0
0
—
—
Kansas
—
0
1
1
—
—
7
22
147
163
1
1
4
26
39
Minnesota
—
0
6
11
2
—
13
28
295
487
—
0
4
—
35
Missouri
—
0
2
4
3
3
10
33
242
235
—
0
3
18
27
Nebraska
—
0
0
—
—
2
4
15
126
131
—
0
2
9
30
North Dakota
—
0
0
—
1
—
1
8
24
49
—
0
0
—
—
South Dakota
—
0
0
—
—
—
2
11
78
23
—
0
2
12
21
S. Atlantic
—
0
9
34
201
47
57
100
1,903
1,437
1
9
23
236
588
Delaware
—
0
0
—
—
—
1
35
199
22
—
0
0
—
—
District of Columbia
—
0
4
16
1
—
0
4
10
26
—
0
0
—
—
Florida
—
0
0
—
1
11
16
63
540
365
—
0
20
46
103
Georgia
—
0
4
4
1
3
6
20
239
204
—
0
11
—
207
Maryland
—
0
1
—
87
1
3
10
67
132
—
6
17
164
232
North Carolina
—
0
1
1
2
27
11
43
451
341
—
0
0
—
—
South Carolina
—
0
1
—
1
1
3
9
97
138
—
0
0
—
—
Virginia
—
0
8
13
108
4
9
30
290
201
—
0
0
—
—
West Virginia
—
0
0
—
—
—
0
3
10
8
1
1
5
26
46
E.S. Central
—
0
3
7
7
5
16
40
546
504
2
1
5
27
27
Alabama
—
0
1
2
2
—
4
13
145
123
—
0
5
20
17
Kentucky
—
0
1
1
2
—
7
28
175
192
2
0
2
6
9
Mississippi
—
0
0
—
—
—
1
5
50
40
—
0
1
1
1
Tennessee
—
0
3
4
3
5
5
11
176
149
—
0
0
—
—
W.S. Central
—
0
3
10
11
42
71
499
1,736
2,183
8
23
78
618
612
Arkansas
—
0
1
1
2
1
7
30
186
239
—
1
23
103
104
Louisiana
—
0
1
—
1
—
2
8
46
141
—
0
1
—
5
Oklahoma
—
0
1
2
1
5
0
112
75
39
2
0
31
72
37
Texas
—
0
3
7
7
36
58
353
1,429
1,764
6
18
72
443
466
Mountain
—
0
2
13
8
11
92
143
2,499
3,871
2
1
11
18
35
Arizona
—
0
2
9
1
—
13
42
343
1,090
N
0
0
N
N
Colorado
—
0
1
1
3
—
26
63
763
817
—
0
0
—
—
Idaho
—
0
0
—
—
7
6
23
250
130
—
0
3
—
15
Montana
—
0
0
—
—
4
8
25
250
464
N
0
0
N
N
Nevada
—
0
2
2
2
—
3
12
82
104
1
0
3
6
8
New Mexico
—
0
1
—
—
—
8
24
197
355
1
0
2
4
6
Utah
—
0
1
1
2
—
21
37
576
878
—
0
4
8
3
Wyoming
—
0
0
—
—
—
1
12
38
33
—
0
2
—
3
Pacific
1
0
2
13
28
31
79
318
4,978
2,179
—
4
14
124
138
Alaska
—
0
1
1
—
4
1
10
39
248
—
0
1
3
7
California
—
0
2
9
24
8
62
270
4,425
1,093
—
4
14
118
123
Hawaii
—
0
0
—
—
—
1
4
25
28
—
0
0
—
—
Oregon
—
0
1
1
3
1
7
19
257
349
—
0
3
3
8
Washington
1
0
1
2
1
18
8
50
232
461
—
0
12
—
—
Territories
American Samoa
—
—
—
—
—
—
—
—
—
—
N
—
—
N
N
C.N.M.I.
—
—
—
—
—
—
—
—
—
—
—
—
—
—
—
Guam
—
0
1
—
6
—
0
0
—
—
—
0
0
—
—
Puerto Rico
—
0
1
—
2
—
0
2
7
22
1
1
5
31
38
U.S. Virgin Islands
—
0
0
—
—
—
0
0
—
—
—
0
0
—
—
C.N.M.I.: Commonwealth of Northern Mariana Islands.
U: Unavailable. —: No reported cases. N: Not reportable. NN: Not Nationally Notifiable. Cum: Cumulative year-to-date counts. Med: Median. Max: Maximum.
TABLE II. (Continued) Provisional cases of selected notifiable diseases, United States, weeks ending August 9, 2014, and August 10, 2013 (32nd week)* (Export data)
Reporting area
Salmonellosis
Shiga toxin-producing E. coli (STEC)†
Shigellosis
Current week
Previous 52 weeks
Cum 2014
Cum 2013
Current week
Previous 52 weeks
Cum 2014
Cum 2013
Current week
Previous 52 weeks
Cum 2014
Cum 2013
Med
Max
Med
Max
Med
Max
United States
828
891
1,485
23,356
27,059
71
96
267
2,673
3,923
270
317
741
9,880
5,808
New England
6
33
71
1,059
1,358
4
3
11
103
155
—
5
45
155
311
Connecticut
1
7
21
250
280
3
1
7
28
36
—
1
5
29
29
Maine
1
2
5
71
89
1
0
3
14
17
—
0
2
9
3
Massachusetts
—
17
36
518
765
—
2
6
44
68
—
2
10
84
96
New Hampshire
1
3
12
94
107
—
0
2
6
20
—
0
2
9
5
Rhode Island
1
2
13
71
67
—
0
2
2
—
—
0
34
23
175
Vermont
2
1
6
55
50
—
0
3
9
14
—
0
1
1
3
Mid. Atlantic
98
86
175
2,358
3,050
9
10
28
250
420
9
14
37
420
510
New Jersey
—
14
46
375
648
—
1
7
30
92
—
2
7
62
82
New York (Upstate)
35
21
76
722
725
6
4
10
99
125
5
4
29
115
155
New York City
35
18
50
551
666
3
1
5
39
60
4
6
13
174
187
Pennsylvania
28
24
58
710
1,011
—
3
15
82
143
—
2
6
69
86
E.N. Central
23
92
167
2,749
3,417
8
12
49
351
669
15
26
117
1,487
909
Illinois
—
29
65
843
1,090
—
3
17
86
200
—
6
34
263
179
Indiana
—
11
29
317
439
—
1
7
40
76
—
3
50
516
65
Michigan
1
17
42
509
587
—
2
12
68
118
1
3
19
153
113
Ohio
22
22
47
733
721
8
4
15
113
129
11
10
22
380
526
Wisconsin
—
13
29
347
580
—
2
13
44
146
3
2
20
175
26
W.N. Central
33
40
120
1,164
1,997
5
13
45
378
654
39
29
80
1,173
244
Iowa
1
9
21
265
371
—
2
13
108
119
1
6
45
121
48
Kansas
2
7
18
210
265
—
1
7
59
60
—
0
4
22
29
Minnesota
—
0
54
—
472
—
0
17
—
184
—
0
6
—
83
Missouri
20
16
37
423
497
3
4
15
117
177
33
3
61
539
31
Nebraska
9
4
12
135
199
2
2
7
63
54
3
1
13
98
37
North Dakota
1
1
5
52
74
—
0
2
17
30
1
0
2
15
11
South Dakota
—
2
10
79
119
—
0
4
14
30
1
10
32
378
5
S. Atlantic
381
231
478
6,355
6,660
14
9
17
299
328
142
75
163
2,832
1,112
Delaware
—
2
7
58
59
—
0
2
8
7
—
1
4
36
3
District of Columbia
—
0
3
18
34
—
0
1
3
4
—
0
4
30
12
Florida
145
115
228
2,877
2,864
7
2
6
75
73
39
39
96
1,585
414
Georgia
44
32
100
984
1,097
1
2
7
65
77
9
20
34
518
414
Maryland
25
14
45
465
496
—
1
8
41
33
7
3
11
139
55
North Carolina
117
22
136
714
901
4
1
5
26
41
83
4
119
349
94
South Carolina
27
20
68
602
538
—
0
2
7
4
—
2
9
73
67
Virginia
21
19
41
537
542
2
2
7
54
69
4
3
9
100
49
West Virginia
2
3
11
100
129
—
0
3
20
20
—
0
2
2
4
E.S. Central
30
57
150
1,821
1,775
4
5
15
177
219
18
32
66
934
449
Alabama
4
19
80
587
492
—
0
4
25
38
2
6
13
164
160
Kentucky
9
10
27
338
315
—
1
7
49
72
7
2
15
111
33
Mississippi
1
11
46
387
468
—
0
3
18
22
—
5
12
141
101
Tennessee
16
15
36
509
500
4
2
9
85
87
9
18
50
518
155
W.S. Central
142
143
724
3,163
3,332
17
16
50
486
389
32
68
463
1,932
1,349
Arkansas
10
14
36
296
291
1
2
6
62
50
4
9
198
689
129
Louisiana
3
24
47
551
681
—
0
3
9
12
—
4
29
98
209
Oklahoma
22
14
151
424
347
12
2
10
76
52
1
1
41
28
119
Texas
107
88
543
1,892
2,013
4
12
40
339
275
27
48
393
1,117
892
Mountain
8
51
148
1,358
1,880
3
8
69
224
505
3
12
43
311
305
Arizona
4
16
34
403
534
—
1
45
37
162
3
6
29
134
182
Colorado
—
10
20
313
416
—
1
9
33
121
—
1
12
44
43
Idaho
1
3
8
93
74
2
2
6
46
49
—
0
3
8
6
Montana
3
2
6
75
56
1
1
4
21
28
—
0
10
8
16
Nevada
—
3
86
79
329
—
1
5
18
38
—
0
7
17
17
New Mexico
—
5
12
146
232
—
0
6
27
24
—
1
5
24
24
Utah
—
6
17
219
199
—
1
7
35
65
—
1
2
17
14
Wyoming
—
1
7
30
40
—
0
5
7
18
—
1
6
59
3
Pacific
107
118
224
3,329
3,590
7
16
55
405
584
12
24
54
636
619
Alaska
2
1
7
54
52
—
0
0
—
—
—
0
1
3
1
California
71
92
177
2,561
2,715
1
8
36
222
346
10
20
54
508
499
Hawaii
1
6
13
152
199
—
0
2
4
20
—
0
2
11
30
Oregon
6
6
25
213
236
2
2
14
81
91
1
1
5
24
27
Washington
27
10
47
349
388
4
3
31
98
127
1
2
12
90
62
Territories
American Samoa
—
—
—
—
—
—
—
—
—
—
—
—
—
—
—
C.N.M.I.
—
—
—
—
—
—
—
—
—
—
—
—
—
—
—
Guam
—
0
2
—
11
—
1
4
—
59
—
0
1
—
6
Puerto Rico
—
8
39
247
347
—
0
2
4
3
—
0
1
3
3
U.S. Virgin Islands
—
0
0
—
—
—
0
0
—
—
—
0
0
—
—
C.N.M.I.: Commonwealth of Northern Mariana Islands.
U: Unavailable. —: No reported cases. N: Not reportable. NN: Not Nationally Notifiable. Cum: Cumulative year-to-date counts. Med: Median. Max: Maximum.
† Includes E. coli O157:H7; Shiga toxin-positive, serogroup non-O157; and Shiga toxin-positive, not serogrouped.
TABLE II. (Continued) Provisional cases of selected notifiable diseases, United States, weeks ending August 9, 2014, and August 10, 2013 (32nd week)* (Export data)
Reporting area
Spotted Fever Rickettsiosis (including RMSF)†
Syphilis, primary and secondary
Confirmed
Probable
Current week
Previous 52 weeks
Cum 2014
Cum 2013
Current week
Previous 52 weeks
Cum 2014
Cum 2013
Current week
Previous 52 weeks
Cum 2014
Cum 2013
Med
Max
Med
Max
Med
Max
United States
3
2
9
68
113
42
57
218
1,861
1,823
112
344
478
10,186
10,199
New England
—
0
0
—
1
—
0
1
4
8
3
10
19
284
300
Connecticut
—
0
0
—
—
—
0
0
—
—
—
1
5
49
37
Maine
—
0
0
—
—
—
0
1
2
2
—
0
4
6
8
Massachusetts
—
0
0
—
—
—
0
1
1
1
—
6
14
173
214
New Hampshire
—
0
0
—
1
—
0
1
1
3
1
0
2
14
18
Rhode Island
—
0
0
—
—
—
0
0
—
2
2
1
5
40
21
Vermont
—
0
0
—
—
—
0
0
—
—
—
0
1
2
2
Mid. Atlantic
2
0
1
4
1
—
1
7
46
50
25
44
73
1,394
1,276
New Jersey
—
0
1
—
1
—
1
4
30
28
—
4
9
129
150
New York (Upstate)
2
0
1
3
—
—
0
6
7
8
11
6
48
229
152
New York City
—
0
1
—
—
—
0
2
4
2
5
24
38
737
703
Pennsylvania
—
0
1
1
—
—
0
2
5
12
9
9
22
299
271
E.N. Central
—
0
2
3
4
—
1
11
61
107
1
32
58
873
1,277
Illinois
—
0
1
1
2
—
1
7
45
69
—
11
27
286
526
Indiana
—
0
2
2
—
—
0
2
3
16
—
3
8
95
150
Michigan
—
0
0
—
—
—
0
1
2
1
—
8
17
191
289
Ohio
—
0
1
—
1
—
0
1
9
16
—
9
17
259
256
Wisconsin
—
0
0
—
1
—
0
1
2
5
1
1
5
42
56
W.N. Central
—
0
2
8
5
8
3
19
186
191
1
15
30
451
381
Iowa
—
0
0
—
—
—
0
2
6
5
—
1
7
21
52
Kansas
—
0
0
—
—
—
0
0
—
—
—
1
3
38
27
Minnesota
—
0
1
—
—
—
0
1
—
9
—
4
10
132
100
Missouri
—
0
1
5
1
7
3
17
171
165
1
6
11
196
155
Nebraska
—
0
1
2
4
1
0
2
8
7
—
1
3
30
26
North Dakota
—
0
1
1
—
—
0
1
1
2
—
0
2
8
6
South Dakota
—
0
1
—
—
—
0
1
—
3
—
1
6
26
15
S. Atlantic
1
1
4
38
79
14
13
83
502
443
57
89
215
2,676
2,194
Delaware
—
0
0
—
—
—
0
3
15
11
—
1
6
22
22
District of Columbia
—
0
1
—
3
—
0
0
—
1
—
0
8
—
106
Florida
1
0
2
5
3
3
1
3
23
7
2
32
45
995
842
Georgia
—
1
3
21
62
—
0
0
—
—
32
22
151
700
449
Maryland
—
0
1
2
—
1
0
2
9
6
—
9
16
242
250
North Carolina
—
0
2
5
7
—
6
66
239
171
17
12
29
375
168
South Carolina
—
0
1
—
—
—
0
5
16
34
3
4
13
140
170
Virginia
—
0
1
5
3
10
5
20
196
211
3
6
18
187
178
West Virginia
—
0
0
—
1
—
0
3
4
2
—
0
2
15
9
E.S. Central
—
0
3
11
8
7
13
50
521
567
3
11
29
332
365
Alabama
—
0
2
4
1
1
4
19
122
136
—
3
8
69
108
Kentucky
—
0
1
—
1
2
1
5
31
43
3
2
8
83
73
Mississippi
—
0
1
2
1
—
0
2
3
29
—
1
26
68
52
Tennessee
—
0
2
5
5
4
7
41
365
359
—
4
9
112
132
W.S. Central
—
0
4
2
8
13
13
123
520
405
1
41
69
1,244
1,339
Arkansas
—
0
1
—
3
12
10
44
369
263
1
3
9
65
111
Louisiana
—
0
0
—
—
—
0
2
9
3
—
8
22
181
213
Oklahoma
—
0
4
2
4
—
0
87
81
108
—
2
7
71
76
Texas
—
0
0
—
1
1
2
16
61
31
—
28
47
927
939
Mountain
—
0
1
1
6
—
1
4
11
43
1
18
31
611
488
Arizona
—
0
1
1
5
—
0
3
6
31
—
7
12
231
164
Colorado
—
0
0
—
—
—
0
1
—
6
1
2
9
75
99
Idaho
—
0
0
—
1
—
0
0
—
—
—
0
2
3
8
Montana
—
0
0
—
—
—
0
1
3
2
—
0
2
5
4
Nevada
—
0
0
—
—
—
0
1
1
1
—
5
20
219
101
New Mexico
—
0
1
—
—
—
0
1
1
1
—
2
6
65
54
Utah
—
0
0
—
—
—
0
1
—
2
—
0
3
13
57
Wyoming
—
0
0
—
—
—
0
1
—
—
—
0
0
—
1
Pacific
—
0
1
1
1
—
0
2
10
9
20
78
101
2,321
2,579
Alaska
N
0
0
N
N
N
0
0
N
N
—
0
3
12
16
California
—
0
1
1
—
—
0
1
7
9
19
68
90
2,060
2,207
Hawaii
N
0
0
N
N
N
0
0
N
N
—
1
5
29
28
Oregon
—
0
0
—
1
—
0
1
3
—
—
5
11
137
171
Washington
—
0
0
—
—
—
0
2
—
—
1
4
11
83
157
Territories
American Samoa
N
—
—
N
N
N
—
—
N
N
—
—
—
—
—
C.N.M.I.
—
—
—
—
—
—
—
—
—
—
—
—
—
—
—
Guam
N
0
0
N
N
N
0
0
N
N
—
0
0
—
—
Puerto Rico
N
0
0
N
N
N
0
0
N
N
—
6
29
268
252
U.S. Virgin Islands
N
0
0
N
N
N
0
0
N
N
—
0
0
—
1
C.N.M.I.: Commonwealth of Northern Mariana Islands.
U: Unavailable. —: No reported cases. N: Not reportable. NN: Not Nationally Notifiable. Cum: Cumulative year-to-date counts. Med: Median. Max: Maximum.
† Illnesses with similar clinical presentation that result from Spotted fever group rickettsia infections are reported as Spotted fever rickettsioses. Rocky Mountain spotted fever (RMSF) caused by Rickettsia rickettsii, is the most common and well-known spotted fever.
TABLE II. (Continued) Provisional cases of selected notifiable diseases, United States, weeks ending August 9, 2014, and August 10, 2013 (32nd week)* (Export data)
Reporting area
Varicella (chickenpox)
West Nile virus disease†
Neuroinvasive
Nonneuroinvasive§
Current week
Previous 52 weeks
Cum 2014
Cum 2013
Current week
Previous 52 weeks
Cum 2014
Cum 2013
Current week
Previous 52 weeks
Cum 2014
Cum 2013
Med
Max
Med
Max
Med
Max
United States
65
197
294
5,279
6,766
—
1
164
50
293
—
1
164
51
350
New England
2
19
49
570
662
—
0
3
—
1
—
0
1
—
2
Connecticut
—
4
9
104
136
—
0
1
—
—
—
0
1
—
1
Maine
1
2
10
100
91
—
0
0
—
—
—
0
0
—
—
Massachusetts
—
9
20
253
308
—
0
2
—
1
—
0
1
—
—
New Hampshire
—
0
8
—
57
—
0
1
—
—
—
0
0
—
—
Rhode Island
—
0
4
23
24
—
0
1
—
—
—
0
0
—
—
Vermont
1
1
27
90
46
—
0
1
—
—
—
0
0
—
1
Mid. Atlantic
6
19
34
580
792
—
0
7
—
9
—
0
6
1
5
New Jersey
—
4
16
111
309
—
0
4
—
3
—
0
2
—
—
New York (Upstate)
N
0
0
N
N
—
0
2
—
1
—
0
4
1
1
New York City
—
0
0
—
—
—
0
2
—
2
—
0
0
—
2
Pennsylvania
6
15
26
469
483
—
0
1
—
3
—
0
1
—
2
E.N. Central
13
57
92
1,513
1,531
—
0
26
1
21
—
0
14
—
6
Illinois
—
13
27
365
405
—
0
21
—
4
—
0
8
—
1
Indiana
—
7
22
214
151
—
0
6
1
2
—
0
1
—
1
Michigan
—
11
39
346
377
—
0
5
—
3
—
0
4
—
3
Ohio
9
11
26
328
384
—
0
3
—
6
—
0
2
—
—
Wisconsin
4
8
25
260
214
—
0
3
—
6
—
0
1
—
1
W.N. Central
2
8
34
146
761
—
0
51
4
65
—
0
68
18
121
Iowa
N
0
0
N
N
—
0
10
—
2
—
0
5
3
5
Kansas
—
0
15
—
301
—
0
8
—
2
—
0
16
—
2
Minnesota
—
0
16
5
300
—
0
7
—
10
—
0
8
—
21
Missouri
1
4
16
110
118
—
0
5
1
—
—
0
1
—
—
Nebraska
—
0
3
5
2
—
0
14
2
4
—
0
29
4
28
North Dakota
1
0
4
12
19
—
0
12
—
20
—
0
9
—
23
South Dakota
—
0
3
14
21
—
0
5
1
27
—
0
12
11
42
S. Atlantic
4
24
54
702
880
—
0
9
1
7
—
0
3
1
5
Delaware
—
0
2
7
17
—
0
1
—
1
—
0
0
—
—
District of Columbia
—
0
0
—
10
—
0
0
—
—
—
0
1
1
1
Florida
3
11
28
345
418
—
0
1
—
1
—
0
1
—
—
Georgia
—
0
10
26
40
—
0
2
1
1
—
0
1
—
2
Maryland
N
0
0
N
N
—
0
3
—
3
—
0
2
—
—
North Carolina
—
0
0
—
—
—
0
2
—
—
—
0
0
—
—
South Carolina
1
2
10
87
110
—
0
1
—
—
—
0
1
—
2
Virginia
—
6
17
153
215
—
0
2
—
1
—
0
0
—
—
West Virginia
—
2
8
84
70
—
0
1
—
—
—
0
0
—
—
E.S. Central
2
2
8
67
111
—
0
7
3
13
—
0
7
4
19
Alabama
2
2
8
66
107
—
0
1
—
—
—
0
3
—
5
Kentucky
N
0
0
N
N
—
0
1
—
—
—
0
1
—
2
Mississippi
—
0
1
1
4
—
0
5
1
9
—
0
2
4
11
Tennessee
N
0
0
N
N
—
0
3
2
4
—
0
2
—
1
W.S. Central
24
36
107
1,061
1,335
—
0
29
8
34
—
0
17
5
21
Arkansas
—
2
17
56
120
—
0
3
1
3
—
0
1
—
—
Louisiana
—
0
4
20
48
—
0
7
6
8
—
0
3
4
7
Oklahoma
N
0
0
N
N
—
0
9
1
5
—
0
7
—
2
Texas
24
32
98
985
1,167
—
0
16
—
18
—
0
12
1
12
Mountain
10
20
52
565
627
—
0
32
13
50
—
0
53
8
112
Arizona
—
5
22
199
208
—
0
7
12
18
—
0
2
2
6
Colorado
8
6
27
163
172
—
0
17
1
22
—
0
34
6
78
Idaho
N
0
0
N
N
—
0
5
—
1
—
0
7
—
8
Montana
2
1
5
47
60
—
0
5
—
—
—
0
7
—
5
Nevada
N
0
0
N
N
—
0
1
—
5
—
0
1
—
3
New Mexico
—
1
5
29
43
—
0
4
—
1
—
0
3
—
2
Utah
—
4
11
124
138
—
0
1
—
1
—
0
1
—
2
Wyoming
—
0
1
3
6
—
0
4
—
2
—
0
6
—
8
Pacific
2
3
6
75
67
—
0
27
20
93
—
0
19
14
59
Alaska
2
1
6
33
28
—
0
0
—
—
—
0
0
—
—
California
—
0
3
14
22
—
0
25
19
91
—
0
18
14
52
Hawaii
—
1
3
28
17
—
0
0
—
—
—
0
0
—
—
Oregon
N
0
0
N
N
—
0
2
—
2
—
0
3
—
6
Washington
N
0
0
N
N
—
0
1
1
—
—
0
0
—
1
Territories
American Samoa
N
—
—
N
N
—
—
—
—
—
—
—
—
—
—
C.N.M.I.
—
—
—
—
—
—
—
—
—
—
—
—
—
—
—
Guam
—
0
2
—
50
—
0
0
—
—
—
0
0
—
—
Puerto Rico
—
4
14
131
191
—
0
0
—
—
—
0
0
—
—
U.S. Virgin Islands
—
0
0
—
—
—
0
0
—
—
—
0
0
—
—
C.N.M.I.: Commonwealth of Northern Mariana Islands.
U: Unavailable. —: No reported cases. N: Not reportable. NN: Not Nationally Notifiable. Cum: Cumulative year-to-date counts. Med: Median. Max: Maximum.
† Updated weekly from reports to the Division of Vector-Borne Infectious Diseases, National Center for Zoonotic, Vector-Borne, and Enteric Diseases (ArboNET Surveillance). Data for California serogroup, eastern equine, Powassan, St. Louis, and western equine diseases are available in Table I.
§ Not reportable in all states. Data from states where the condition is not reportable are excluded from this table, except starting in 2007 for the domestic arboviral diseases and influenza-associated pediatric mortality, and in 2003 for SARS-CoV. Reporting exceptions are available at http://wwwn.cdc.gov/nndss/document/SRCA_FINAL_REPORT_2006-2012_final.xlsx.
TABLE III. Deaths in 122 U.S. cities,* week ending August 9, 2014 (32nd week) (Export data)
Reporting area
All causes, by age (years)
P&I† Total
Reporting area (Continued)
All causes, by age (years)
P&I† Total
All Ages
=65
45–64
25–44
1–24
<1
All Ages
=65
45–64
25–44
1–24
<1
New England
489
329
116
22
10
12
33
S. Atlantic
923
562
250
62
25
24
62
Boston, MA
128
80
32
5
3
8
9
Atlanta, GA
138
73
47
10
5
3
15
Bridgeport, CT
30
17
11
—
1
1
2
Baltimore, MD
119
72
33
11
1
2
10
Cambridge, MA
13
10
3
—
—
—
1
Charlotte, NC
129
75
36
11
4
3
7
Fall River, MA
40
29
5
5
1
—
2
Jacksonville, FL
84
57
21
2
—
4
4
Hartford, CT
40
30
6
2
1
1
1
Miami, FL
69
48
12
5
3
1
4
Lowell, MA
18
14
4
—
—
—
4
Norfolk, VA
49
37
7
1
3
1
4
Lynn, MA
9
4
3
2
—
—
—
Richmond, VA
57
33
21
2
1
—
3
New Bedford, MA
26
20
6
—
—
—
1
Savannah, GA
48
39
5
2
1
1
1
New Haven, CT
U
U
U
U
U
U
U
St. Petersburg, FL
40
26
10
3
—
1
1
Providence, RI
81
59
16
3
3
—
2
Tampa, FL
74
40
23
9
1
1
2
Somerville, MA
3
2
1
—
—
—
—
Washington, D.C.
104
55
30
6
6
7
11
Springfield, MA
29
19
7
1
1
1
1
Wilmington, DE
12
7
5
—
—
—
—
Waterbury, CT
25
18
5
2
—
—
5
E.S. Central
1,027
650
294
46
24
13
69
Worcester, MA
47
27
17
2
—
1
5
Birmingham, AL
214
141
54
10
3
6
15
Mid. Atlantic
1,589
1,138
314
100
20
17
58
Chattanooga, TN
89
54
28
1
3
3
6
Albany, NY
39
27
9
2
1
—
3
Knoxville, TN
101
64
30
3
4
—
11
Allentown, PA
34
20
14
—
—
—
1
Lexington, KY
75
46
25
1
3
—
1
Buffalo, NY
71
54
12
4
—
1
5
Memphis, TN
170
104
49
9
5
3
18
Camden, NJ
13
10
2
1
—
—
—
Mobile, AL
158
102
44
10
2
—
11
Elizabeth, NJ
19
15
4
—
—
—
—
Montgomery, AL
69
48
16
3
2
—
3
Erie, PA
51
44
4
2
1
—
1
Nashville, TN
151
91
48
9
2
1
4
Jersey City, NJ
23
19
2
2
—
—
2
W.S. Central
1,457
900
392
98
39
28
67
New York City, NY
890
630
186
55
9
10
26
Austin, TX
85
50
28
5
1
1
7
Newark, NJ
57
25
20
9
—
3
2
Baton Rouge, LA
75
46
19
3
4
3
1
Paterson, NJ
19
13
5
1
—
—
—
Corpus Christi, TX
42
27
11
3
1
—
3
Philadelphia, PA
U
U
U
U
U
U
U
Dallas, TX
207
121
50
20
8
8
9
Pittsburgh, PA§
44
32
7
2
2
1
1
El Paso, TX
109
79
20
6
2
2
4
Reading, PA
35
24
5
5
1
—
2
Fort Worth, TX
U
U
U
U
U
U
U
Rochester, NY
128
105
18
5
—
—
3
Houston, TX
369
207
116
26
9
11
11
Schenectady, NY
16
13
1
1
1
—
2
Little Rock, AR
69
43
20
3
3
—
3
Scranton, PA
27
20
4
2
—
1
2
New Orleans, LA
58
26
14
12
6
—
3
Syracuse, NY
82
62
12
4
3
1
6
San Antonio, TX
268
181
69
13
3
2
15
Trenton, NJ
18
10
5
3
—
—
—
Shreveport, LA
57
36
18
1
1
1
3
Utica, NY
13
8
2
1
2
—
1
Tulsa, OK
118
84
27
6
1
—
8
Yonkers, NY
10
7
2
1
—
—
1
Mountain
1,219
800
274
96
19
29
45
E.N. Central
1,982
1,312
485
97
44
44
115
Albuquerque, NM
123
79
31
8
1
3
8
Akron, OH
47
33
7
5
—
2
5
Boise, ID
69
50
12
5
1
1
2
Canton, OH
27
20
5
1
1
—
6
Colorado Springs, CO
65
46
13
4
1
1
2
Chicago, IL
248
155
71
15
3
4
13
Denver, CO
87
51
18
10
1
7
1
Cincinnati, OH
74
50
10
3
5
6
1
Las Vegas, NV
278
182
66
26
2
2
11
Cleveland, OH
235
175
43
10
3
4
12
Ogden, UT
42
31
7
1
—
3
4
Columbus, OH
242
162
61
8
4
7
13
Phoenix, AZ
201
117
53
16
6
9
6
Dayton, OH
105
74
21
9
1
—
3
Pueblo, CO
47
32
11
2
2
—
—
Detroit, MI
157
74
61
12
7
3
5
Salt Lake City, UT
150
91
38
14
5
2
9
Evansville, IN
47
28
15
2
2
—
3
Tucson, AZ
157
121
25
10
—
1
2
Fort Wayne, IN
74
51
19
2
2
—
4
Pacific
1,625
1,155
328
88
31
23
100
Gary, IN
12
4
3
4
1
—
1
Berkeley, CA
5
4
1
—
—
—
—
Grand Rapids, MI
52
40
8
2
—
2
5
Fresno, CA
110
88
14
1
4
3
7
Indianapolis, IN
213
129
66
9
1
8
14
Glendale, CA
34
27
6
—
1
—
5
Lansing, MI
44
30
11
3
—
—
5
Honolulu, HI
60
44
8
6
1
1
9
Milwaukee, WI
80
50
20
4
4
2
7
Long Beach, CA
66
42
17
4
2
1
3
Peoria, IL
45
35
8
—
1
1
2
Los Angeles, CA
254
155
69
20
5
5
17
Rockford, IL
61
43
12
4
1
1
3
Pasadena, CA
18
18
—
—
—
—
2
South Bend, IN
45
33
7
1
3
1
4
Portland, OR
125
86
28
10
1
—
4
Toledo, OH
95
65
24
1
3
2
3
Sacramento, CA
196
138
44
8
3
3
12
Youngstown, OH
79
61
13
2
2
1
6
San Diego, CA
167
115
38
8
3
3
10
W.N. Central
584
351
172
33
12
15
22
San Francisco, CA
102
78
19
3
—
2
5
Des Moines, IA
—
—
—
—
—
—
—
San Jose, CA
194
147
30
9
6
2
10
Duluth, MN
31
25
2
3
—
1
—
Santa Cruz, CA
27
21
5
1
—
—
1
Kansas City, KS
28
20
6
1
1
—
—
Seattle, WA
102
69
16
12
4
1
5
Kansas City, MO
108
68
29
6
4
1
3
Spokane, WA
62
49
9
2
—
2
1
Lincoln, NE
48
26
16
4
2
—
2
Tacoma, WA
103
74
24
4
1
—
9
Minneapolis, MN
53
30
15
3
—
5
1
Total¶
10,895
7,197
2,625
642
224
205
571
Omaha, NE
87
52
23
10
2
—
5
St. Louis, MO
88
46
31
2
2
6
4
St. Paul, MN
51
36
13
1
—
1
4
Wichita, KS
90
48
37
3
1
1
3
U: Unavailable. —: No reported cases.
* Mortality data in this table are voluntarily reported from 122 cities in the United States, most of which have populations of >100,000. A death is reported by the place of its occurrence and by the week that the death certificate was filed. Fetal deaths are not included.
† Pneumonia and influenza.
§ Because of changes in reporting methods in this Pennsylvania city, these numbers are partial counts for the current week. Complete counts will be available in 4 to 6 weeks.