Table I Provisional cases of selected† infrequently reported notifiable diseases (<1,000 cases reported during the preceding year) — United States, week ending April 16, 2016 (15th week)
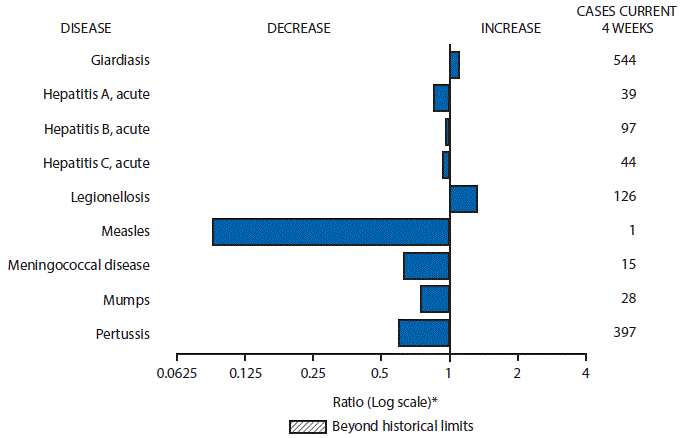
Figure I Selected notifiable disease reports, United States, comparison of provisional 4-week totals April 16, 2016, with historical data
Table II Provisional cases of selected† notifiable diseases (=1,000 cases reported during the preceding year), and selected low frequency diseases, United States and U.S. territories, weeks ending April 16, 2016, and April 18, 2015 (15th week)
Table III Deaths in 122 U.S. cities, week ending April 16, 2016 (15th week)
$title
TABLE I. Provisional* cases of selected† infrequently reported notifiable diseases (<1,000 cases reported during the preceding year) — United States, week ending April 16, 2016 (15th week) (Export data)
TABLE I. (Continued) Provisional* cases of selected† infrequently reported notifiable diseases (<1,000 cases reported during the preceding year) — United States, week ending April 16, 2016 (15th week) (Export data)
Disease
Current week
Cum 2016
5-year weekly average§
Total cases reported for previous years
States reporting cases during current week (No.)
2015
2014
2013
2012
2011
Viral hemorrhagic fevers§§§§:
Crimean-Congo hemorrhagic fever
—
—
—
—
NP
NP
NP
NP
Ebola hemorrhagic fever
—
—
—
—
4
NP
NP
NP
Guanarito hemorrhagic fever
—
—
—
—
NP
NP
NP
NP
Junin hemorrhagic fever
—
—
—
—
NP
NP
NP
NP
Lassa fever
—
—
—
—
1
NP
NP
NP
Lujo virus
—
—
—
—
NP
NP
NP
NP
Machupo hemorrhagic fever
—
—
—
—
NP
NP
NP
NP
Marburg fever
—
—
—
—
NP
NP
NP
NP
Sabia-associated hemorrhagic fever
—
—
—
—
NP
NP
NP
NP
Yellow fever
—
—
—
—
—
—
—
—
—: No reported cases. N: Not reportable. NN: Not Nationally Notifiable. NP: Nationally notifiable but not published. Cum: Cumulative year-to-date counts.
† This table does not include cases from the U.S. territories. Three low incidence conditions, rubella, rubella congenital, and tetanus, are in Table II to facilitate case count verification with reporting jurisdictions.
§ Calculated by summing the incidence counts for the current week, the 2 weeks preceding the current week, and the 2 weeks following the current week, for a total of 5 preceding years. Additional information is available at http://wwwn.cdc.gov/nndss/document/5yearweeklyaverage.pdf.
¶ Includes both neuroinvasive and nonneuroinvasive. Updated weekly reports from the Division of Vector-Borne Diseases, National Center for Emerging and Zoonotic Infectious Diseases (ArboNET Surveillance). Data for West Nile virus are available in Table II.
** Not reportable in all reporting jurisdictions. Data from states where the condition is not reportable are excluded from this table, except for the arboviral diseases and influenza-associated pediatric mortality. Reporting exceptions are available at http://wwwn.cdc.gov/nndss/downloads.html.
†† Data for Chikungunya virus and Hantavirus infection, non-HPS. Office of Management and Budget approval of the NNDSS Revision #0920-0728 on January 21, 2016, authorized CDC to receive data for these conditions. CDC is in the process of soliciting data for these conditions
§§ Jamestown Canyon virus and Lacrosse virus have replaced California serogroup diseases.
¶¶ This table does not include cases from the U.S. territories. There may be some delay between identification of a case and reporting to CDC. All cases reported are travel related. Office of Management and Budget approval of the NNDSS Revision #0920-0728 on January 21, 2016, authorized CDC to receive data for these conditions. CDC is in the process of soliciting data for these conditions.
*** Data for H. influenzae (all ages, all serotypes) are available in Table II.
††† Updated weekly from reports to the Influenza Division, National Center for Immunization and Respiratory Diseases. Since October 4, 2015, 56 influenza-associated pediatric deaths occurring during the 2015-16 influenza season have been reported.
§§§ No measles cases were reported for the current week.
¶¶¶ Data for meningococcal disease (all serogroups) are available in Table II.
**** All cases of novel influenza A virus infection reported to CDC since 2011 have been variant viruses. Influenza viruses that circulate in swine are called swine influenza viruses when isolated from swine, but are called variant viruses when isolated from humans. Variant influenza viruses are different from the influenza A (H1N1)pdm09 virus. Total case counts are provided by the Influenza Division, National Center for Immunization and Respiratory Diseases (NCIRD).
†††† Updated weekly from reports to the Division of STD Prevention, National Center for HIV/AIDS, Viral Hepatitis, STD, and TB Prevention.
§§§§ Prior to 2015, CDC’s National Notifiable Diseases Surveillance System (NNDSS) did not receive electronic data about incident cases of specific viral hemorrhagic fevers; instead data were collected in aggregate as “viral hemorrhagic fevers”. Beginning in 2015, NNDSS has been updated to receive data for each of the viral hemorrhagic fevers listed below. In addition to the four cases of Ebola diagnosed in the United States to date in 2014, six residents of the United States have been medically evacuated to the United States for care after developing Ebola in West Africa. Ten of the 11 Viral Hemorrhagic Fever cases reported for 2014 are confirmed as Ebola and one as Lassa fever.
* Ratio of current 4-week total to mean of 15 4-week totals (from previous, comparable, and subsequent 4-week periods for the past 5 years). The point where the hatched area begins is based on the mean and two standard deviations of these 4-week totals.
TABLE II. Provisional* cases of selected† notifiable diseases (=1,000 cases reported during the preceding year), and selected low frequency diseases, United States and U.S. territories, weeks ending April 16, 2016, and April 18, 2015 (15th week) (Export data)
Reporting area
Babesiosis
Campylobacteriosis
Current week
Previous 52 weeks
Cum 2016
Cum 2015
Current week
Previous 52 weeks
Cum 2016
Cum 2015
Med
Max
Med
Max
United States
1
16
171
37
41
417
955
1,532
8,733
10,756
New England
—
9
103
15
15
8
53
113
514
599
Connecticut
—
1
39
1
5
2
13
35
107
155
Maine
—
0
6
2
1
1
4
11
36
41
Massachusetts
—
3
48
6
6
—
26
47
250
292
New Hampshire
—
1
5
1
3
3
4
12
37
57
Rhode Island
—
1
25
5
—
—
4
21
45
30
Vermont
—
0
3
—
—
2
3
11
39
24
Mid. Atlantic
1
7
109
21
18
60
135
250
1,360
1,683
New Jersey
—
1
32
—
5
—
29
63
241
401
New York (Upstate)
—
4
109
14
8
13
32
86
290
362
New York City
1
0
11
7
5
32
29
127
397
376
Pennsylvania
N
0
0
N
N
15
41
98
432
544
E.N. Central
—
0
7
—
4
57
93
219
1,146
1,088
Illinois
—
0
1
—
1
U
0
0
U
U
Indiana
—
0
0
—
—
—
15
39
126
183
Michigan
—
0
1
—
1
5
22
53
228
279
Ohio
—
0
0
—
1
33
34
93
476
352
Wisconsin
—
0
7
—
1
19
27
45
316
274
W.N. Central
—
0
2
—
—
13
36
89
402
386
Iowa
N
0
0
N
N
6
14
43
173
102
Kansas
N
0
0
N
N
—
5
16
41
61
Minnesota
—
0
0
—
—
—
0
1
—
—
Missouri
N
0
0
N
N
—
0
0
—
88
Nebraska
—
0
0
—
—
7
8
25
86
96
North Dakota
—
0
2
—
—
—
0
4
29
—
South Dakota
—
0
0
—
—
—
7
23
73
39
S. Atlantic
—
0
1
1
1
56
163
274
1,325
2,026
Delaware
—
0
1
—
—
—
3
7
27
32
District of Columbia
N
0
0
N
N
—
0
2
—
5
Florida
N
0
0
N
N
29
67
106
492
932
Georgia
N
0
0
N
N
4
13
27
124
146
Maryland
—
0
0
—
—
8
13
32
165
167
North Carolina
N
0
0
N
N
—
18
76
130
279
South Carolina
—
0
1
1
1
2
6
16
77
75
Virginia
N
0
0
N
N
13
28
81
299
320
West Virginia
—
0
0
—
—
—
5
18
11
70
E.S. Central
—
0
1
—
2
13
44
78
509
508
Alabama
—
0
1
—
2
3
11
31
157
127
Kentucky
N
0
0
N
N
3
15
35
146
174
Mississippi
N
0
0
N
N
—
4
10
46
39
Tennessee
—
0
1
—
—
7
14
29
160
168
W.S. Central
—
0
1
—
—
33
107
237
582
935
Arkansas
—
0
0
—
—
4
9
21
88
76
Louisiana
—
0
1
—
—
13
8
23
93
142
Oklahoma
N
0
0
N
N
—
18
59
167
99
Texas
—
0
1
—
—
16
70
198
234
618
Mountain
—
0
0
—
—
28
78
141
581
875
Arizona
—
0
0
—
—
19
25
53
257
331
Colorado
N
0
0
N
N
—
19
40
1
169
Idaho
N
0
0
N
N
5
7
20
84
73
Montana
—
0
0
—
—
4
6
15
79
57
Nevada
N
0
0
N
N
—
3
8
9
37
New Mexico
N
0
0
N
N
—
8
19
69
98
Utah
—
0
0
—
—
—
8
21
62
83
Wyoming
—
0
0
—
—
—
3
9
20
27
Pacific
—
0
2
—
1
149
231
364
2,314
2,656
Alaska
N
0
0
N
N
—
2
5
14
15
California
—
0
2
—
—
82
173
223
1,716
2,070
Hawaii
N
0
0
N
N
—
10
28
68
91
Oregon
—
0
1
—
1
9
15
32
184
212
Washington
—
0
0
—
—
58
24
187
332
268
Territories
American Samoa
U
0
0
U
U
—
0
0
—
—
C.N.M.I.
—
—
—
—
—
—
—
—
—
—
Guam
—
0
0
—
—
—
0
0
—
—
Puerto Rico
N
0
0
N
N
2
0
3
14
8
U.S. Virgin Islands
N
0
0
N
N
—
0
0
—
—
C.N.M.I.: Commonwealth of Northern Mariana Islands.
U: Unavailable. —: No reported cases. N: Not reportable. NN: Not Nationally Notifiable. NP: Nationally notifiable but not published. Cum: Cumulative year-to-date counts. Med: Median. Max: Maximum.
† Three low incidence conditions, rubella, rubella congenital, and tetanus, are in Table II to facilitate case count verification with reporting jurisdictions.
TABLE II. (Continued) Provisional* cases of selected† notifiable diseases (=1,000 cases reported during the preceding year), and selected low frequency diseases, United States and U.S. territories, weeks ending April 16, 2016, and April 18, 2015 (15th week) (Export data)
Reporting area
Chlamydia trachomatis infection
Coccidioidomycosis
Current week
Previous 52 weeks
Cum 2016
Cum 2015
Current week
Previous 52 weeks
Cum 2016
Cum 2015
Med
Max
Med
Max
United States
16,220
29,128
31,608
394,262
427,248
145
218
378
2,554
2,404
New England
295
994
1,449
11,704
13,265
—
0
0
—
—
Connecticut
28
258
484
3,042
3,456
N
0
0
N
N
Maine
11
72
119
684
1,175
N
0
0
N
N
Massachusetts
—
479
586
4,469
6,595
—
0
0
—
—
New Hampshire
104
103
338
1,996
135
—
0
0
—
—
Rhode Island
148
86
227
1,048
1,347
—
0
0
—
—
Vermont
4
34
58
465
557
N
0
0
N
N
Mid. Atlantic
2,784
3,767
4,245
56,653
53,471
—
0
0
—
—
New Jersey
260
640
802
9,191
9,385
N
0
0
N
N
New York (Upstate)
852
802
1,488
11,407
10,732
N
0
0
N
N
New York City
691
1,252
1,405
18,806
17,912
N
0
0
N
N
Pennsylvania
981
1,074
1,477
17,249
15,442
N
0
0
N
N
E.N. Central
1,703
4,311
5,126
55,505
64,365
1
1
4
16
11
Illinois
51
1,292
1,550
10,266
20,435
N
0
0
N
N
Indiana
335
578
1,223
9,007
8,060
N
0
0
N
N
Michigan
482
906
1,174
12,200
13,155
—
0
3
8
5
Ohio
532
1,158
1,369
16,940
16,061
1
0
4
8
2
Wisconsin
303
469
606
7,092
6,654
—
0
2
—
4
W.N. Central
454
1,688
1,965
24,630
26,480
—
1
8
12
33
Iowa
58
235
280
3,379
3,558
N
0
0
N
N
Kansas
4
223
297
3,173
3,452
N
0
0
N
N
Minnesota
1
413
525
5,043
6,280
—
1
8
9
27
Missouri
276
568
687
8,715
8,631
—
0
0
—
1
Nebraska
100
141
246
2,290
2,424
—
0
1
3
3
North Dakota
7
58
88
844
957
—
0
2
—
2
South Dakota
8
66
117
1,186
1,178
N
0
0
N
N
S. Atlantic
3,858
6,141
7,436
76,383
92,660
—
0
1
3
1
Delaware
91
92
150
1,478
1,196
—
0
1
1
—
District of Columbia
169
149
404
1,913
1,736
—
0
0
—
—
Florida
1,222
1,792
2,249
25,639
24,738
N
0
0
N
N
Georgia
335
1,116
1,289
12,459
17,635
N
0
0
N
N
Maryland
516
550
1,035
7,239
5,725
—
0
1
2
1
North Carolina
—
1,064
2,092
7,805
22,076
N
0
0
N
N
South Carolina
636
583
758
8,903
7,747
N
0
0
N
N
Virginia
889
685
1,358
10,078
10,669
N
0
0
N
N
West Virginia
—
66
161
869
1,138
N
0
0
N
N
E.S. Central
923
1,538
2,597
22,483
23,162
—
0
0
—
—
Alabama
—
430
1,191
5,678
7,906
N
0
0
N
N
Kentucky
618
296
1,464
3,778
3,976
—
0
0
—
—
Mississippi
305
339
651
5,596
2,014
N
0
0
N
N
Tennessee
—
552
794
7,431
9,266
N
0
0
N
N
W.S. Central
2,999
3,858
6,608
56,314
53,745
—
0
2
4
2
Arkansas
152
377
684
4,062
736
—
0
2
—
1
Louisiana
—
578
3,348
8,334
4,869
—
0
1
4
1
Oklahoma
—
270
350
3,045
4,573
N
0
0
N
N
Texas
2,847
2,704
4,611
40,873
43,567
N
0
0
N
N
Mountain
690
1,877
2,504
25,874
28,236
143
150
283
2,006
1,485
Arizona
478
623
852
8,605
8,832
143
146
282
1,996
1,434
Colorado
—
447
1,015
5,659
6,622
N
0
0
N
N
Idaho
—
111
209
1,729
1,570
N
0
0
N
N
Montana
68
83
118
1,378
1,250
—
0
1
3
3
Nevada
—
168
244
2,007
2,995
—
2
7
5
20
New Mexico
48
231
322
3,323
3,884
—
0
2
1
11
Utah
84
172
209
2,663
2,521
—
1
5
1
16
Wyoming
12
37
72
510
562
—
0
2
—
1
Pacific
2,514
4,807
5,292
64,716
71,864
1
64
113
513
872
Alaska
—
80
116
994
1,631
N
0
0
N
N
California
1,751
3,717
4,193
51,409
55,007
1
64
113
510
871
Hawaii
—
135
177
1,192
2,068
N
0
0
N
N
Oregon
330
317
435
4,559
4,803
—
0
1
3
1
Washington
433
524
744
6,562
8,355
N
0
0
N
N
Territories
American Samoa
—
0
0
—
—
N
0
0
N
N
C.N.M.I.
—
—
—
—
—
—
—
—
—
—
Guam
—
0
0
—
—
—
0
0
—
—
Puerto Rico
—
92
253
1,249
1,276
N
0
0
N
N
U.S. Virgin Islands
—
12
26
29
249
—
0
0
—
—
C.N.M.I.: Commonwealth of Northern Mariana Islands.
U: Unavailable. —: No reported cases. N: Not reportable. NN: Not Nationally Notifiable. NP: Nationally notifiable but not published. Cum: Cumulative year-to-date counts. Med: Median. Max: Maximum.
† Three low incidence conditions, rubella, rubella congenital, and tetanus, are in Table II to facilitate case count verification with reporting jurisdictions.
TABLE II. (Continued) Provisional* cases of selected† notifiable diseases (=1,000 cases reported during the preceding year), and selected low frequency diseases, United States and U.S. territories, weeks ending April 16, 2016, and April 18, 2015 (15th week) (Export data)
Reporting area
Cryptosporidiosis
Dengue Virus Infection
Dengue§
Severe Dengue
Current week
Previous 52 weeks
Cum 2016
Cum 2015
Current week
Previous 52 weeks
Cum 2016
Cum 2015
Current week
Previous 52 weeks
Cum 2016
Cum 2015
Med
Max
Med
Max
Med
Max
United States
51
130
381
1,498
1,523
—
16
43
151
128
—
0
0
—
—
New England
1
6
26
54
70
—
0
2
2
7
—
0
0
—
—
Connecticut
—
1
10
8
11
—
0
2
—
1
—
0
0
—
—
Maine
1
0
4
6
12
—
0
1
—
1
—
0
0
—
—
Massachusetts
—
4
12
32
31
—
0
1
—
2
—
0
0
—
—
New Hampshire
—
0
3
3
7
—
0
0
—
1
—
0
0
—
—
Rhode Island
—
0
4
2
2
—
0
1
2
1
—
0
0
—
—
Vermont
—
1
7
3
7
—
0
1
—
1
—
0
0
—
—
Mid. Atlantic
11
12
42
159
121
—
2
7
28
32
—
0
0
—
—
New Jersey
—
0
4
5
5
—
1
4
16
13
—
0
0
—
—
New York (Upstate)
4
4
20
47
36
—
0
3
6
5
—
0
0
—
—
New York City
—
2
13
28
17
—
0
4
—
11
—
0
0
—
—
Pennsylvania
7
6
17
79
63
—
0
3
6
3
—
0
0
—
—
E.N. Central
10
25
90
327
305
—
1
7
8
10
—
0
0
—
—
Illinois
—
3
60
29
39
—
0
4
—
4
—
0
0
—
—
Indiana
—
3
9
36
46
—
0
1
1
—
—
0
0
—
—
Michigan
1
4
13
61
53
—
0
3
3
2
—
0
0
—
—
Ohio
9
7
26
98
70
—
0
1
2
3
—
0
0
—
—
Wisconsin
—
9
30
103
97
—
0
1
2
1
—
0
0
—
—
W.N. Central
1
14
58
135
156
—
0
3
7
2
—
0
0
—
—
Iowa
—
5
20
51
56
—
0
1
1
1
—
0
0
—
—
Kansas
—
2
16
17
23
—
0
1
—
1
—
0
0
—
—
Minnesota
—
0
0
—
—
—
0
2
3
—
—
0
0
—
—
Missouri
—
0
0
—
18
—
0
2
3
—
—
0
0
—
—
Nebraska
—
3
21
32
26
—
0
1
—
—
—
0
0
—
—
North Dakota
—
0
2
2
5
—
0
0
—
—
—
0
0
—
—
South Dakota
1
3
19
33
28
—
0
1
—
—
—
0
0
—
—
S. Atlantic
9
32
94
292
328
—
3
9
31
22
—
0
0
—
—
Delaware
—
0
2
—
2
—
0
1
1
1
—
0
0
—
—
District of Columbia
—
0
1
—
2
—
0
1
—
3
—
0
0
—
—
Florida
3
12
57
126
166
—
1
6
18
9
—
0
0
—
—
Georgia
3
6
17
65
69
—
0
2
3
2
—
0
0
—
—
Maryland
—
1
7
18
13
—
0
2
5
—
—
0
0
—
—
North Carolina
—
2
62
19
25
—
0
1
1
1
—
0
0
—
—
South Carolina
2
1
5
26
16
—
0
1
—
1
—
0
0
—
—
Virginia
1
4
46
38
33
—
0
2
3
4
—
0
0
—
—
West Virginia
—
0
3
—
2
—
0
0
—
1
—
0
0
—
—
E.S. Central
4
10
66
108
147
—
0
1
—
8
—
0
0
—
—
Alabama
2
2
41
39
78
—
0
0
—
—
—
0
0
—
—
Kentucky
2
2
6
29
17
—
0
0
—
1
—
0
0
—
—
Mississippi
—
1
2
7
11
—
0
1
—
—
—
0
0
—
—
Tennessee
—
4
22
33
41
—
0
1
—
7
—
0
0
—
—
W.S. Central
5
19
49
168
147
—
0
4
6
6
—
0
0
—
—
Arkansas
1
1
8
16
11
—
0
1
—
—
—
0
0
—
—
Louisiana
—
2
9
27
45
—
0
1
—
1
—
0
0
—
—
Oklahoma
—
2
9
26
8
—
0
1
1
1
—
0
0
—
—
Texas
4
13
33
99
83
—
0
3
5
4
—
0
0
—
—
Mountain
1
10
26
97
103
—
1
4
7
1
—
0
0
—
—
Arizona
—
1
5
15
10
—
0
4
—
1
—
0
0
—
—
Colorado
—
2
10
1
10
—
0
2
1
—
—
0
0
—
—
Idaho
—
2
8
28
16
—
0
1
1
—
—
0
0
—
—
Montana
1
1
4
8
4
—
0
2
—
—
—
0
0
—
—
Nevada
—
0
3
4
2
—
0
1
1
—
—
0
0
—
—
New Mexico
—
1
5
9
8
—
0
3
4
—
—
0
0
—
—
Utah
—
3
7
32
41
—
0
0
—
—
—
0
0
—
—
Wyoming
—
0
3
—
12
—
0
0
—
—
—
0
0
—
—
Pacific
9
12
58
158
146
—
4
30
62
40
—
0
0
—
—
Alaska
—
0
2
4
1
—
0
1
—
—
—
0
0
—
—
California
4
7
14
73
88
—
2
6
11
32
—
0
0
—
—
Hawaii
—
0
5
—
—
—
1
25
46
3
—
0
0
—
—
Oregon
5
4
12
74
46
—
0
1
—
1
—
0
0
—
—
Washington
—
0
38
7
11
—
0
3
5
4
—
0
0
—
—
Territories
American Samoa
N
0
0
N
N
—
0
0
—
—
—
0
0
—
—
C.N.M.I.
—
—
—
—
—
—
—
—
—
—
—
—
—
—
—
Guam
—
0
0
—
—
—
0
0
—
—
—
0
0
—
—
Puerto Rico
—
0
0
—
—
—
1
19
71
22
—
0
0
—
—
U.S. Virgin Islands
—
0
0
—
—
—
0
4
10
—
—
0
0
—
—
C.N.M.I.: Commonwealth of Northern Mariana Islands.
U: Unavailable. —: No reported cases. N: Not reportable. NN: Not Nationally Notifiable. NP: Nationally notifiable but not published. Cum: Cumulative year-to-date counts. Med: Median. Max: Maximum.
† Three low incidence conditions, rubella, rubella congenital, and tetanus, are in Table II to facilitate case count verification with reporting jurisdictions.
§ Includes data for dengue and dengue-like illness. Office of Management and Budget approval of the NNDSS Revision #0920-0728 on January 21, 2016, authorized CDC to receive data for these conditions. CDC is in the process of soliciting data for these conditions.
TABLE II. (Continued) Provisional* cases of selected† notifiable diseases (=1,000 cases reported during the preceding year), and selected low frequency diseases, United States and U.S. territories, weeks ending April 16, 2016, and April 18, 2015 (15th week) (Export data)
Reporting area
Ehrlichiosis/Anaplasmosis§
Ehrlichia chaffeensis
Anaplasma phagocytophilum
Undetermined
Current week
Previous 52 weeks
Cum 2016
Cum 2015
Current week
Previous 52 weeks
Cum 2016
Cum 2015
Current week
Previous 52 weeks
Cum 2016
Cum 2015
Med
Max
Med
Max
Med
Max
United States
3
14
69
42
59
9
46
198
75
68
—
2
12
6
11
New England
—
1
7
6
7
4
20
102
36
22
—
0
1
2
—
Connecticut
—
0
0
—
—
—
1
20
—
2
—
0
0
—
—
Maine
—
0
1
—
1
2
2
16
7
1
—
0
1
2
—
Massachusetts
—
0
2
—
—
—
9
62
17
7
—
0
0
—
—
New Hampshire
—
0
2
2
1
—
2
10
—
4
—
0
0
—
—
Rhode Island
—
0
5
3
5
—
2
10
4
4
—
0
0
—
—
Vermont
—
0
2
1
—
2
2
12
8
4
—
0
1
—
—
Mid. Atlantic
1
2
36
15
9
5
15
61
28
14
—
0
3
2
—
New Jersey
—
0
5
—
6
—
0
12
1
6
—
0
2
—
—
New York (Upstate)
—
1
36
14
1
3
12
53
22
6
—
0
3
—
—
New York City
1
0
2
1
2
2
1
6
5
2
—
0
1
2
—
Pennsylvania
—
0
2
—
—
—
0
0
—
—
—
0
0
—
—
E.N. Central
—
1
8
—
5
—
8
49
2
17
—
1
6
1
10
Illinois
—
0
5
—
1
—
0
2
—
2
—
0
1
—
1
Indiana
—
0
0
—
—
—
0
0
—
—
—
0
2
—
1
Michigan
—
0
2
—
1
—
0
1
1
4
—
0
0
—
—
Ohio
—
0
2
—
1
—
0
0
—
1
—
0
1
—
—
Wisconsin
—
0
3
—
2
—
8
48
1
10
—
0
6
1
8
W.N. Central
—
2
20
2
7
—
0
3
2
2
—
0
3
—
—
Iowa
N
0
0
N
N
N
0
0
N
N
N
0
0
N
N
Kansas
—
0
5
—
2
—
0
1
—
1
—
0
1
—
—
Minnesota
—
0
0
—
—
—
0
0
—
—
—
0
0
—
—
Missouri
—
2
17
2
5
—
0
2
1
1
—
0
3
—
—
Nebraska
—
0
1
—
—
—
0
1
—
—
—
0
0
—
—
North Dakota
—
0
1
—
—
—
0
1
1
—
—
0
0
—
—
South Dakota
—
0
0
—
—
—
0
0
—
—
—
0
0
—
—
S. Atlantic
1
2
23
5
20
—
0
6
5
7
—
0
2
—
1
Delaware
—
0
3
—
—
—
0
1
1
—
—
0
0
—
—
District of Columbia
—
0
1
—
—
—
0
0
—
—
—
0
0
—
—
Florida
—
0
3
—
2
—
0
2
2
1
—
0
1
—
—
Georgia
—
0
2
—
—
—
0
0
—
—
—
0
1
—
—
Maryland
—
0
7
2
2
—
0
1
1
1
—
0
1
—
—
North Carolina
—
0
22
2
11
—
0
5
1
4
—
0
0
—
—
South Carolina
—
0
1
—
1
—
0
1
—
—
—
0
0
—
—
Virginia
1
0
9
1
4
—
0
2
—
1
—
0
2
—
1
West Virginia
—
0
1
—
—
—
0
0
—
—
—
0
1
—
—
E.S. Central
1
1
14
5
1
—
0
3
1
2
—
0
6
1
—
Alabama
—
0
3
1
—
—
0
2
1
2
—
0
1
1
—
Kentucky
—
0
6
2
—
—
0
0
—
—
—
0
0
—
—
Mississippi
—
0
1
—
—
—
0
0
—
—
—
0
1
—
—
Tennessee
1
1
7
2
1
—
0
2
—
—
—
0
6
—
—
W.S. Central
—
2
17
9
10
—
0
2
1
3
—
0
1
—
—
Arkansas
—
2
16
6
8
—
0
2
1
3
—
0
0
—
—
Louisiana
—
0
1
1
—
—
0
0
—
—
—
0
1
—
—
Oklahoma
—
0
0
—
2
—
0
0
—
—
—
0
0
—
—
Texas
—
0
1
2
—
—
0
1
—
—
—
0
0
—
—
Mountain
—
0
0
—
—
—
0
2
—
1
—
0
1
—
—
Arizona
—
0
0
—
—
—
0
0
—
—
—
0
1
—
—
Colorado
N
0
0
N
N
N
0
0
N
N
N
0
0
N
N
Idaho
N
0
0
N
N
N
0
0
N
N
N
0
0
N
N
Montana
—
0
0
—
—
—
0
1
—
—
—
0
0
—
—
Nevada
—
0
0
—
—
—
0
0
—
—
—
0
0
—
—
New Mexico
N
0
0
N
N
N
0
0
N
N
N
0
0
N
N
Utah
—
0
0
—
—
—
0
1
—
1
—
0
0
—
—
Wyoming
—
0
0
—
—
—
0
0
—
—
—
0
0
—
—
Pacific
—
0
0
—
—
—
0
1
—
—
—
0
1
—
—
Alaska
N
0
0
N
N
N
0
0
N
N
N
0
0
N
N
California
—
0
0
—
—
—
0
0
—
—
—
0
1
—
—
Hawaii
N
0
0
N
N
N
0
0
N
N
N
0
0
N
N
Oregon
—
0
0
—
—
—
0
1
—
—
—
0
1
—
—
Washington
—
0
0
—
—
—
0
0
—
—
—
0
0
—
—
Territories
American Samoa
N
0
0
N
N
N
0
0
N
N
N
0
0
N
N
C.N.M.I.
—
—
—
—
—
—
—
—
—
—
—
—
—
—
—
Guam
N
0
0
N
N
N
0
0
N
N
N
0
0
N
N
Puerto Rico
N
0
0
N
N
N
0
0
N
N
N
0
0
N
N
U.S. Virgin Islands
—
0
0
—
—
—
0
0
—
—
—
0
0
—
—
C.N.M.I.: Commonwealth of Northern Mariana Islands.
U: Unavailable. —: No reported cases. N: Not reportable. NN: Not Nationally Notifiable. NP: Nationally notifiable but not published. Cum: Cumulative year-to-date counts. Med: Median. Max: Maximum.
† Three low incidence conditions, rubella, rubella congenital, and tetanus, are in Table II to facilitate case count verification with reporting jurisdictions.
§ Cumulative total E. ewingii cases reported for year 2016 = 0, and 11 cases reported for 2015.
TABLE II. (Continued) Provisional* cases of selected† notifiable diseases (=1,000 cases reported during the preceding year), and selected low frequency diseases, United States and U.S. territories, weeks ending April 16, 2016, and April 18, 2015 (15th week) (Export data)
Reporting area
Giardiasis
Gonorrhea
Haemophilus influenzae, invasive§ All ages, all serotypes
Current week
Previous 52 weeks
Cum 2016
Cum 2015
Current week
Previous 52 weeks
Cum 2016
Cum 2015
Current week
Previous 52 weeks
Cum 2016
Cum 2015
Med
Max
Med
Max
Med
Max
United States
163
234
381
2,980
3,170
3,895
7,665
8,912
104,771
103,879
107
76
148
1,311
1,199
New England
5
21
42
241
248
45
141
213
1,679
1,897
1
5
10
71
80
Connecticut
—
4
10
42
52
39
41
99
560
501
—
1
3
15
14
Maine
3
2
10
29
17
—
7
20
14
53
—
0
3
7
11
Massachusetts
—
13
26
132
155
—
75
109
736
1,092
—
2
7
35
43
New Hampshire
2
2
6
23
22
1
5
53
195
64
—
0
2
6
4
Rhode Island
—
0
7
15
2
2
10
29
130
154
1
0
2
4
3
Vermont
N
0
0
N
N
3
3
8
44
33
—
0
1
4
5
Mid. Atlantic
47
44
74
570
666
554
898
1,052
13,197
12,429
12
12
24
206
171
New Jersey
—
0
9
6
92
50
137
174
1,966
2,131
—
2
7
34
36
New York (Upstate)
19
16
34
223
177
156
170
344
2,301
2,114
6
4
20
61
54
New York City
20
16
29
226
235
161
332
400
4,764
4,651
2
1
7
36
27
Pennsylvania
8
12
22
115
162
187
257
377
4,166
3,533
4
5
11
75
54
E.N. Central
8
26
59
292
335
297
1,095
1,357
14,382
14,800
3
13
31
204
181
Illinois
N
0
0
N
N
9
313
407
2,311
4,595
—
4
8
44
52
Indiana
—
3
11
28
33
87
160
304
2,568
1,992
—
2
8
27
13
Michigan
—
8
20
82
113
135
206
273
2,984
2,842
1
2
10
47
33
Ohio
7
7
15
95
114
—
336
434
4,813
4,370
2
3
8
64
54
Wisconsin
1
8
34
87
75
66
110
162
1,706
1,001
—
2
6
22
29
W.N. Central
1
9
30
123
158
190
424
551
6,596
5,714
2
3
9
25
65
Iowa
—
2
10
35
25
12
45
66
602
534
—
0
1
—
—
Kansas
—
2
7
21
31
3
52
66
724
648
—
1
5
7
14
Minnesota
—
0
1
—
—
2
78
123
1,129
1,191
—
1
4
—
31
Missouri
—
0
0
—
25
141
186
238
3,048
2,425
—
0
0
—
12
Nebraska
1
2
9
35
46
30
36
63
575
424
1
1
3
8
3
North Dakota
—
0
3
8
9
1
12
28
192
184
1
0
2
5
4
South Dakota
—
2
8
24
22
1
15
39
326
308
—
0
1
5
1
S. Atlantic
57
49
71
666
618
876
1,644
2,324
20,686
24,322
72
19
65
353
291
Delaware
—
0
3
4
6
24
29
45
459
314
—
0
2
4
6
District of Columbia
—
0
4
—
12
60
57
142
734
482
—
0
3
7
1
Florida
28
20
33
294
265
309
487
727
6,974
6,075
66
4
57
149
52
Georgia
20
13
34
218
188
122
303
364
3,497
4,698
2
4
10
62
62
Maryland
1
4
13
53
59
114
135
252
1,971
1,492
3
1
6
37
34
North Carolina
N
0
0
N
N
—
323
822
1,953
6,492
—
2
10
30
51
South Carolina
4
2
9
36
30
197
170
271
2,791
2,184
1
2
5
22
36
Virginia
4
5
26
59
45
50
142
359
2,114
2,342
—
2
16
35
34
West Virginia
—
1
5
2
13
—
13
29
193
243
—
1
3
7
15
E.S. Central
4
4
13
81
57
267
438
647
6,684
6,385
2
6
19
109
110
Alabama
4
4
13
81
57
—
126
250
1,641
2,176
1
1
5
27
34
Kentucky
—
0
2
—
—
189
75
407
1,149
989
—
1
4
13
10
Mississippi
N
0
0
N
N
78
105
238
1,725
747
—
1
3
15
15
Tennessee
N
0
0
N
N
—
140
236
2,169
2,473
1
3
10
54
51
W.S. Central
1
6
15
72
64
813
1,162
1,791
16,523
14,812
8
6
15
137
92
Arkansas
1
2
12
35
19
44
109
222
1,200
203
—
1
5
15
17
Louisiana
—
4
12
37
45
—
185
762
2,604
1,494
1
2
9
29
34
Oklahoma
N
0
0
N
N
—
90
114
986
1,383
—
1
6
19
36
Texas
N
0
0
N
N
769
769
1,422
11,733
11,732
7
0
11
74
5
Mountain
5
19
49
144
243
169
414
541
5,835
5,291
3
8
17
132
135
Arizona
1
3
7
42
44
140
165
252
2,275
2,022
—
2
11
51
53
Colorado
—
5
18
—
64
—
91
172
1,290
991
3
2
6
34
26
Idaho
2
3
9
41
30
—
9
30
120
99
—
0
3
14
11
Montana
1
1
6
22
16
12
17
31
293
236
—
0
2
3
—
Nevada
—
0
4
4
18
—
51
75
567
816
—
0
3
4
10
New Mexico
—
1
5
11
22
3
48
84
729
689
—
1
4
21
25
Utah
1
3
13
24
45
14
34
49
537
402
—
1
4
5
9
Wyoming
—
0
4
—
4
—
3
10
24
36
—
0
2
—
1
Pacific
35
59
180
791
781
684
1,321
1,546
19,189
18,229
4
3
11
74
74
Alaska
—
2
6
16
18
—
17
25
215
311
—
0
3
8
3
California
9
41
71
561
545
493
1,080
1,313
16,132
14,699
—
1
2
11
20
Hawaii
—
1
4
14
6
—
21
38
160
409
—
0
5
15
2
Oregon
8
6
14
86
117
72
68
98
1,042
835
2
2
4
36
48
Washington
18
8
115
114
95
119
133
211
1,640
1,975
2
0
2
4
1
Territories
American Samoa
—
0
0
—
—
—
0
0
—
—
—
0
0
—
—
C.N.M.I.
—
—
—
—
—
—
—
—
—
—
—
—
—
—
—
Guam
—
0
0
—
—
—
0
0
—
—
—
0
0
—
—
Puerto Rico
—
0
3
1
3
—
10
40
86
157
—
0
0
—
1
U.S. Virgin Islands
—
0
0
—
—
—
0
6
3
20
N
0
0
N
N
C.N.M.I.: Commonwealth of Northern Mariana Islands.
U: Unavailable. —: No reported cases. N: Not reportable. NN: Not Nationally Notifiable. NP: Nationally notifiable but not published. Cum: Cumulative year-to-date counts. Med: Median. Max: Maximum.
† Three low incidence conditions, rubella, rubella congenital, and tetanus, are in Table II to facilitate case count verification with reporting jurisdictions.
§ Data for H. influenzae (age <5 for serotype b, non typable serotype, other serotype, and unknown serotype) are available in Table I.
TABLE II. (Continued) Provisional* cases of selected† notifiable diseases (=1,000 cases reported during the preceding year), and selected low frequency diseases, United States and U.S. territories, weeks ending April 16, 2016, and April 18, 2015 (15th week) (Export data)
Reporting area
Hepatitis (viral, acute), by type
A
B
C
Current week
Previous 52 weeks
Cum 2016
Cum 2015
Current week
Previous 52 weeks
Cum 2016
Cum 2015
Current week
Previous 52 weeks
Cum 2016
Cum 2015
Med
Max
Med
Max
Med
Max
United States
11
25
45
305
354
31
59
86
609
977
12
42
58
372
685
New England
—
1
3
21
14
1
1
2
15
12
—
4
10
21
96
Connecticut
—
0
2
3
1
—
0
1
—
4
—
0
2
7
5
Maine
—
0
1
2
1
1
0
2
10
—
—
0
3
9
10
Massachusetts
—
1
3
12
10
—
0
2
4
8
—
4
9
3
81
New Hampshire
—
0
1
—
—
—
0
0
—
—
N
0
0
N
N
Rhode Island
—
0
2
3
1
U
0
0
U
U
U
0
0
U
U
Vermont
—
0
1
1
1
—
0
1
1
—
—
0
1
2
—
Mid. Atlantic
3
4
9
43
65
5
4
7
40
58
4
5
17
71
101
New Jersey
—
0
3
2
20
—
1
5
6
19
—
1
6
3
28
New York (Upstate)
1
1
6
14
12
2
0
3
10
8
3
2
10
41
26
New York City
1
1
5
15
20
2
1
3
14
17
—
0
5
3
3
Pennsylvania
1
1
4
12
13
1
1
4
10
14
1
2
5
24
44
E.N. Central
—
3
12
35
39
4
10
17
137
261
1
8
16
98
117
Illinois
—
1
9
13
16
—
1
2
9
25
—
0
3
6
8
Indiana
—
0
3
6
5
—
2
5
12
43
—
2
7
17
37
Michigan
—
1
4
13
10
—
1
4
16
9
—
2
7
45
26
Ohio
—
0
5
3
6
4
6
12
94
182
1
2
7
28
34
Wisconsin
—
0
1
—
2
—
0
1
6
2
—
0
3
2
12
W.N. Central
—
1
3
9
20
—
1
4
10
20
—
1
3
15
26
Iowa
—
0
3
2
2
—
0
2
2
7
—
0
0
—
—
Kansas
—
0
1
—
3
—
0
2
5
2
—
0
2
3
11
Minnesota
—
0
1
—
10
—
0
2
—
6
—
0
3
3
10
Missouri
—
0
0
—
1
—
0
0
—
4
—
0
0
—
3
Nebraska
—
0
2
7
—
—
0
1
1
—
—
0
1
5
2
North Dakota
—
0
1
—
4
—
0
1
1
—
—
0
0
—
—
South Dakota
—
0
1
—
—
—
0
1
1
1
—
0
2
4
—
S. Atlantic
3
5
14
75
63
9
21
31
229
309
2
8
21
90
142
Delaware
—
0
0
—
2
—
0
1
—
4
U
0
0
U
U
District of Columbia
—
0
0
—
—
—
0
0
—
—
—
0
0
—
—
Florida
2
2
8
24
20
7
9
15
120
106
1
2
7
49
25
Georgia
—
1
3
15
10
—
2
5
20
27
—
1
4
5
30
Maryland
—
0
2
6
4
—
1
4
10
12
1
0
3
9
11
North Carolina
—
0
3
7
13
—
2
9
8
69
—
1
17
2
46
South Carolina
—
0
3
5
3
1
0
2
10
12
—
0
2
3
—
Virginia
1
1
5
18
9
1
1
11
17
18
—
1
4
10
7
West Virginia
—
0
2
—
2
—
5
12
44
61
—
1
4
12
23
E.S. Central
—
1
4
10
18
5
10
21
93
165
2
6
11
44
110
Alabama
—
0
2
8
7
1
2
6
22
28
—
1
6
7
25
Kentucky
—
0
2
—
6
—
2
9
10
52
—
1
6
4
36
Mississippi
—
0
1
2
—
—
0
4
7
15
U
0
0
U
U
Tennessee
—
0
2
—
5
4
5
10
54
70
2
3
7
33
49
W.S. Central
2
3
12
52
35
4
5
18
36
64
1
1
6
6
27
Arkansas
—
0
1
—
3
1
1
4
13
7
—
0
1
—
1
Louisiana
1
0
2
7
2
3
2
7
13
30
1
0
4
3
11
Oklahoma
—
0
3
4
3
—
0
10
4
1
—
0
2
3
6
Texas
1
3
10
41
27
—
2
9
6
26
—
0
4
—
9
Mountain
1
2
6
22
29
—
1
8
9
23
—
1
8
10
39
Arizona
—
1
4
12
10
—
0
3
4
5
U
0
0
U
U
Colorado
1
0
2
6
7
—
0
4
—
7
—
0
3
1
16
Idaho
—
0
1
1
3
—
0
1
4
3
—
0
1
2
1
Montana
—
0
1
1
—
—
0
2
—
—
—
0
2
5
3
Nevada
—
0
1
—
3
—
0
2
1
5
—
0
1
—
6
New Mexico
—
0
1
—
3
—
0
1
—
—
—
0
1
—
9
Utah
—
0
1
2
1
—
0
1
—
3
—
0
4
2
4
Wyoming
—
0
1
—
2
—
0
0
—
—
—
0
0
—
—
Pacific
2
4
11
38
71
3
4
10
40
65
2
2
13
17
27
Alaska
—
0
1
—
2
—
0
1
3
—
N
0
0
N
N
California
—
3
9
27
58
1
3
8
22
46
—
1
4
7
15
Hawaii
—
0
3
3
—
—
0
1
—
7
—
0
0
—
—
Oregon
1
0
3
5
8
—
0
3
5
4
—
0
1
3
3
Washington
1
0
5
3
3
2
1
3
10
8
2
1
12
7
9
Territories
American Samoa
—
0
0
—
—
—
0
0
—
—
—
0
0
—
—
C.N.M.I.
—
—
—
—
—
—
—
—
—
—
—
—
—
—
—
Guam
—
0
0
—
—
—
0
0
—
—
—
0
0
—
—
Puerto Rico
—
0
0
—
2
—
0
2
3
14
N
0
0
N
N
U.S. Virgin Islands
—
0
0
—
—
—
0
0
—
—
—
0
0
—
—
C.N.M.I.: Commonwealth of Northern Mariana Islands.
U: Unavailable. —: No reported cases. N: Not reportable. NN: Not Nationally Notifiable. NP: Nationally notifiable but not published. Cum: Cumulative year-to-date counts. Med: Median. Max: Maximum.
† Three low incidence conditions, rubella, rubella congenital, and tetanus, are in Table II to facilitate case count verification with reporting jurisdictions.
TABLE II. (Continued) Provisional* cases of selected† notifiable diseases (=1,000 cases reported during the preceding year), and selected low frequency diseases, United States and U.S. territories, weeks ending April 16, 2016, and April 18, 2015 (15th week) (Export data)
Reporting area
Invasive Pneumococcal Disease§
Legionellosis
All ages
Age <5
Current week
Previous 52 weeks
Cum 2016
Cum 2015
Current week
Previous 52 weeks
Cum 2016
Cum 2015
Current week
Previous 52 weeks
Cum 2016
Cum 2015
Med
Max
Med
Max
Med
Max
United States
305
298
659
5,586
6,286
11
22
33
331
399
26
97
234
741
1,102
New England
3
21
39
365
427
1
0
4
22
26
—
5
15
33
44
Connecticut
—
4
11
78
95
—
0
1
5
3
—
1
4
5
7
Maine
3
3
9
51
51
1
0
2
5
2
—
0
2
6
1
Massachusetts
—
9
20
167
197
—
0
2
9
12
—
2
8
15
27
New Hampshire
—
2
6
35
43
—
0
1
1
5
—
0
5
2
3
Rhode Island
—
1
5
11
17
—
0
1
1
1
—
0
6
3
4
Vermont
—
1
5
23
24
—
0
1
1
3
—
0
3
2
2
Mid. Atlantic
47
43
109
754
957
—
2
7
32
40
13
20
101
177
220
New Jersey
—
0
20
2
219
—
0
1
—
7
—
2
10
2
41
New York (Upstate)
21
17
70
316
276
—
1
4
18
14
5
7
26
74
78
New York City
18
13
24
249
263
—
0
3
6
11
7
5
84
67
48
Pennsylvania
8
10
16
187
199
—
0
3
8
8
1
6
23
34
53
E.N. Central
45
58
127
1,060
1,006
1
3
9
52
47
3
18
101
146
177
Illinois
N
0
0
N
N
—
0
2
—
—
—
4
48
29
30
Indiana
1
11
28
193
205
—
0
3
3
13
—
2
10
16
25
Michigan
9
14
46
272
277
—
1
3
14
12
—
2
13
15
32
Ohio
25
20
41
435
369
1
1
5
27
14
3
7
74
75
75
Wisconsin
10
7
25
160
155
—
1
2
8
8
—
2
7
11
15
W.N. Central
5
16
34
211
375
—
1
4
11
32
—
4
22
35
44
Iowa
N
0
0
N
N
N
0
0
N
N
—
0
3
3
9
Kansas
—
3
9
64
65
—
0
2
4
8
—
0
4
3
4
Minnesota
—
6
20
—
182
—
0
3
—
17
—
1
5
8
7
Missouri
N
0
0
N
N
—
0
0
—
2
—
2
19
20
15
Nebraska
4
3
8
74
55
—
0
2
6
3
—
0
2
—
7
North Dakota
—
1
6
23
30
—
0
1
1
2
—
0
1
1
1
South Dakota
1
2
11
50
43
N
0
0
N
N
—
0
2
—
1
S. Atlantic
101
50
102
1,059
1,137
4
4
11
73
78
4
18
35
162
228
Delaware
3
1
5
24
37
—
0
1
—
2
—
0
3
5
3
District of Columbia
2
1
5
22
22
—
0
1
—
4
—
0
1
—
—
Florida
62
8
29
299
173
3
1
4
23
24
3
5
13
72
85
Georgia
13
15
35
319
432
1
1
5
22
20
—
2
7
22
17
Maryland
13
8
23
174
165
—
0
3
12
8
—
2
9
21
27
North Carolina
N
0
0
N
N
N
0
0
N
N
—
3
8
21
48
South Carolina
5
7
18
146
216
—
0
2
4
10
1
1
3
7
13
Virginia
—
1
2
9
6
—
1
2
9
6
—
2
9
14
24
West Virginia
3
4
11
66
86
—
0
2
3
4
—
0
3
—
11
E.S. Central
18
29
70
595
674
—
2
6
30
40
2
5
15
51
53
Alabama
—
5
18
118
120
—
0
5
8
13
2
1
6
15
11
Kentucky
—
4
11
76
98
—
0
2
1
1
—
1
7
10
14
Mississippi
—
5
12
98
84
—
0
2
7
6
—
0
4
4
10
Tennessee
18
15
35
303
372
—
1
3
14
20
—
2
8
22
18
W.S. Central
54
40
205
855
854
4
4
13
71
71
4
8
20
41
84
Arkansas
13
5
24
99
122
—
0
3
9
7
—
0
4
3
5
Louisiana
7
6
17
130
152
2
0
3
12
10
—
0
4
4
15
Oklahoma
N
0
0
N
N
—
0
2
5
6
—
0
9
1
6
Texas
34
28
178
626
580
2
3
11
45
48
4
5
19
33
58
Mountain
30
36
63
620
799
1
2
6
37
61
—
4
10
27
70
Arizona
26
12
37
383
310
1
1
4
23
24
—
1
4
17
35
Colorado
—
7
21
—
176
—
0
2
—
11
—
1
6
—
8
Idaho
N
0
0
N
N
—
0
1
2
3
—
0
1
5
4
Montana
2
1
5
31
21
—
0
1
2
—
—
0
2
2
1
Nevada
—
2
10
31
71
—
0
1
2
6
—
0
2
—
9
New Mexico
2
4
15
129
136
—
0
4
6
7
—
0
2
3
3
Utah
—
3
7
33
75
—
0
1
2
9
—
0
2
—
10
Wyoming
—
0
4
13
10
—
0
0
—
1
—
0
2
—
—
Pacific
2
3
10
67
57
—
0
2
3
4
—
9
20
69
182
Alaska
2
2
10
40
34
—
0
1
3
3
—
0
0
—
—
California
N
0
0
N
N
N
0
0
N
N
—
6
18
52
155
Hawaii
—
1
6
27
23
—
0
1
—
1
—
0
1
2
3
Oregon
N
0
0
N
N
N
0
0
N
N
—
1
3
6
8
Washington
N
0
0
N
N
N
0
0
N
N
—
0
7
9
16
Territories
American Samoa
N
0
0
N
N
—
0
0
—
—
N
0
0
N
N
C.N.M.I.
—
—
—
—
—
—
—
—
—
—
—
—
—
—
—
Guam
—
0
0
—
—
—
0
0
—
—
—
0
0
—
—
Puerto Rico
—
0
0
—
—
—
0
0
—
—
—
0
2
2
5
U.S. Virgin Islands
—
0
0
—
—
—
0
0
—
—
—
0
0
—
—
C.N.M.I.: Commonwealth of Northern Mariana Islands.
U: Unavailable. —: No reported cases. N: Not reportable. NN: Not Nationally Notifiable. NP: Nationally notifiable but not published. Cum: Cumulative year-to-date counts. Med: Median. Max: Maximum.
† Three low incidence conditions, rubella, rubella congenital, and tetanus, are in Table II to facilitate case count verification with reporting jurisdictions.
§ Includes drug resistant and susceptible cases of Invasive Pneumococcal Disease. This condition was previously named Streptococcus pneumoniae invasive disease and cases were reported to CDC using different event codes to specify whether the cases were drug resistant or in a defined age group, such as <5 years.
TABLE II. (Continued) Provisional* cases of selected† notifiable diseases (=1,000 cases reported during the preceding year), and selected low frequency diseases, United States and U.S. territories, weeks ending April 16, 2016, and April 18, 2015 (15th week) (Export data)
Reporting area
Lyme disease
Malaria
Meningococcal disease, invasive§ All serogroups
Current week
Previous 52 weeks
Cum 2016
Cum 2015
Current week
Previous 52 weeks
Cum 2016
Cum 2015
Current week
Previous 52 weeks
Cum 2016
Cum 2015
Med
Max
Med
Max
Med
Max
United States
55
519
2,376
2,228
2,748
10
23
58
221
178
1
7
14
102
139
New England
1
109
745
256
879
—
2
7
19
12
—
0
2
9
9
Connecticut
—
31
186
44
212
—
0
2
1
1
—
0
1
2
2
Maine
1
16
79
67
91
—
0
3
4
—
—
0
2
1
1
Massachusetts
—
41
414
4
382
—
1
3
11
10
—
0
2
6
3
New Hampshire
—
2
65
29
89
—
0
3
3
—
—
0
1
—
—
Rhode Island
—
11
72
85
64
—
0
3
—
1
—
0
1
—
2
Vermont
—
8
59
27
41
—
0
0
—
—
—
0
0
—
1
Mid. Atlantic
35
253
1,291
1,393
1,301
5
5
24
47
41
—
0
4
10
13
New Jersey
—
44
325
48
421
—
1
5
3
11
—
0
2
2
2
New York (Upstate)
15
46
231
246
154
—
1
7
7
13
—
0
1
1
3
New York City
—
2
560
21
28
5
3
17
33
12
—
0
2
3
4
Pennsylvania
20
134
881
1,078
698
—
0
3
4
5
—
0
2
4
4
E.N. Central
—
27
219
89
113
—
2
7
19
24
—
1
5
12
15
Illinois
—
3
29
4
14
—
1
3
6
10
—
0
2
3
3
Indiana
—
1
17
2
9
—
0
2
1
3
—
0
1
3
3
Michigan
—
3
11
19
4
—
0
2
4
1
—
0
1
1
2
Ohio
—
2
18
12
13
—
1
3
7
8
—
0
4
3
5
Wisconsin
—
18
159
52
73
—
0
1
1
2
—
0
2
2
2
W.N. Central
—
4
30
16
17
—
0
3
5
7
—
0
2
2
8
Iowa
—
2
28
11
13
—
0
2
2
3
—
0
1
1
2
Kansas
—
0
3
4
2
—
0
1
—
—
—
0
1
—
2
Minnesota
—
0
0
—
1
—
0
0
—
—
—
0
1
—
1
Missouri
—
0
0
—
—
—
0
0
—
2
—
0
0
—
2
Nebraska
—
0
2
1
1
—
0
1
1
1
—
0
1
—
1
North Dakota
—
0
4
—
—
—
0
1
—
—
—
0
0
—
—
South Dakota
—
0
1
—
—
—
0
1
2
1
—
0
1
1
—
S. Atlantic
18
72
237
423
391
3
6
17
73
48
—
1
3
15
31
Delaware
6
8
31
85
39
—
0
2
5
—
—
0
0
—
—
District of Columbia
—
1
10
7
23
—
0
1
2
3
—
0
0
—
3
Florida
2
3
15
28
20
—
1
3
9
10
—
0
2
5
13
Georgia
—
0
0
—
—
—
1
6
11
11
—
0
2
2
7
Maryland
3
24
114
175
152
3
2
9
27
13
—
0
1
1
1
North Carolina
—
1
55
14
22
—
0
6
7
2
—
0
1
1
2
South Carolina
—
1
3
11
7
—
0
1
2
1
—
0
2
3
—
Virginia
7
23
120
85
103
—
1
5
9
8
—
0
2
3
5
West Virginia
—
3
24
18
25
—
0
1
1
—
—
0
1
—
—
E.S. Central
—
2
12
22
14
—
0
4
8
5
—
0
2
4
5
Alabama
—
0
4
12
10
—
0
2
2
3
—
0
1
2
3
Kentucky
—
1
6
7
4
—
0
1
1
1
—
0
1
—
1
Mississippi
—
0
1
—
—
—
0
1
2
—
—
0
0
—
—
Tennessee
—
0
4
3
—
—
0
2
3
1
—
0
1
2
1
W.S. Central
—
1
6
4
1
—
2
9
19
6
—
0
5
10
15
Arkansas
—
0
0
—
—
—
0
2
—
2
—
0
1
1
1
Louisiana
—
0
0
—
—
—
0
2
4
1
—
0
4
2
4
Oklahoma
—
0
0
—
—
—
0
1
1
1
—
0
1
1
1
Texas
—
1
6
4
1
—
1
8
14
2
—
0
3
6
9
Mountain
1
1
2
7
9
—
1
6
4
7
—
0
3
3
2
Arizona
—
0
2
2
5
—
0
2
1
1
—
0
1
1
—
Colorado
—
0
0
—
—
—
0
5
—
3
—
0
1
—
1
Idaho
1
0
2
3
1
—
0
2
—
—
—
0
0
—
—
Montana
—
0
1
1
—
—
0
1
3
—
—
0
1
—
—
Nevada
—
0
1
—
1
—
0
2
—
—
—
0
1
—
—
New Mexico
—
0
0
—
—
—
0
1
—
1
—
0
1
1
1
Utah
—
0
1
1
2
—
0
2
—
2
—
0
1
1
—
Wyoming
—
0
1
—
—
—
0
1
—
—
—
0
1
—
—
Pacific
—
3
15
18
23
2
2
7
27
28
1
2
6
37
41
Alaska
—
0
2
2
1
—
0
2
1
1
—
0
2
2
2
California
—
2
12
3
16
—
2
6
13
21
—
1
4
25
23
Hawaii
N
0
0
N
N
—
0
1
—
—
—
0
2
—
1
Oregon
—
1
4
12
6
—
0
2
4
5
—
0
3
6
11
Washington
—
0
3
1
—
2
0
3
9
1
1
0
4
4
4
Territories
American Samoa
N
0
0
N
N
—
0
0
—
—
—
0
0
—
—
C.N.M.I.
—
—
—
—
—
—
—
—
—
—
—
—
—
—
—
Guam
—
0
0
—
—
—
0
0
—
—
—
0
0
—
—
Puerto Rico
N
0
0
N
N
—
0
5
—
—
—
0
0
—
—
U.S. Virgin Islands
N
0
0
N
N
—
0
0
—
—
—
0
0
—
—
C.N.M.I.: Commonwealth of Northern Mariana Islands.
U: Unavailable. —: No reported cases. N: Not reportable. NN: Not Nationally Notifiable. NP: Nationally notifiable but not published. Cum: Cumulative year-to-date counts. Med: Median. Max: Maximum.
† Three low incidence conditions, rubella, rubella congenital, and tetanus, are in Table II to facilitate case count verification with reporting jurisdictions.
§ Data for meningococcal disease, invasive caused by serogroups ACWY, serogroup B, other serogroup, and unknown serogroup are available in Table I.
TABLE II. (Continued) Provisional* cases of selected† notifiable diseases (=1,000 cases reported during the preceding year), and selected low frequency diseases, United States and U.S. territories, weeks ending April 16, 2016, and April 18, 2015 (15th week) (Export data)
Reporting area
Mumps
Pertussis
Rabies, animal
Current week
Previous 52 weeks
Cum 2016
Cum 2015
Current week
Previous 52 weeks
Cum 2016
Cum 2015
Current week
Previous 52 weeks
Cum 2016
Cum 2015
Med
Max
Med
Max
Med
Max
United States
7
31
75
643
122
110
338
543
3,460
6,464
53
66
125
525
866
New England
—
0
18
58
—
3
12
26
139
248
4
5
13
68
48
Connecticut
—
0
3
7
—
—
1
4
13
21
1
3
12
33
34
Maine
—
0
1
4
—
1
3
15
58
148
2
1
6
19
5
Massachusetts
—
0
16
40
—
—
4
13
18
61
—
0
0
—
—
New Hampshire
—
0
5
7
—
—
1
3
8
7
—
0
2
4
3
Rhode Island
—
0
1
—
—
—
0
5
7
7
—
0
2
3
4
Vermont
—
0
1
—
—
2
1
8
35
4
1
0
2
9
2
Mid. Atlantic
3
2
12
22
30
25
47
77
731
598
24
14
33
138
173
New Jersey
—
0
2
2
6
—
8
18
90
91
—
0
0
—
—
New York (Upstate)
3
0
4
11
6
16
12
48
207
175
24
7
33
138
66
New York City
—
1
10
8
12
—
8
22
73
57
—
0
0
—
—
Pennsylvania
—
0
2
1
6
9
19
35
361
275
—
6
26
—
107
E.N. Central
2
12
46
199
26
20
56
92
745
816
—
1
18
3
10
Illinois
—
8
33
128
11
—
14
30
149
148
—
1
18
—
2
Indiana
—
0
12
52
—
—
4
9
38
47
—
0
0
—
—
Michigan
—
0
2
5
1
2
8
25
84
154
—
0
4
1
—
Ohio
2
0
2
10
13
18
14
34
278
281
—
0
5
2
8
Wisconsin
—
0
17
4
1
—
13
28
196
186
N
0
0
N
N
W.N. Central
—
8
38
280
5
2
23
47
166
779
3
2
9
22
51
Iowa
—
7
33
249
2
—
2
7
16
49
—
0
0
—
—
Kansas
—
0
2
6
—
—
4
18
8
137
3
1
6
17
36
Minnesota
—
0
4
17
2
—
8
27
71
165
—
0
0
—
—
Missouri
—
0
0
—
1
—
0
0
—
50
—
0
0
—
—
Nebraska
—
0
1
1
—
2
4
13
64
368
—
0
5
2
6
North Dakota
—
0
3
7
—
—
0
4
2
6
—
0
0
—
—
South Dakota
—
0
0
—
—
—
0
2
5
4
—
0
2
3
9
S. Atlantic
—
1
8
28
31
6
29
69
284
482
4
13
31
87
239
Delaware
—
0
1
—
1
—
0
3
6
3
—
0
0
—
—
District of Columbia
—
0
0
—
—
1
0
2
5
1
—
0
0
—
—
Florida
—
0
1
4
2
4
7
14
103
100
—
0
8
17
84
Georgia
—
0
0
—
—
—
3
10
26
63
—
0
0
—
—
Maryland
—
0
5
—
3
—
2
7
22
48
—
4
20
4
70
North Carolina
—
0
8
18
1
—
6
28
36
150
4
7
12
60
76
South Carolina
—
0
1
2
—
1
2
17
31
43
N
0
0
N
N
Virginia
—
0
2
4
23
—
5
35
47
54
—
0
0
—
—
West Virginia
—
0
0
—
1
—
1
7
8
20
—
0
3
6
9
E.S. Central
—
0
3
7
5
13
11
34
269
180
1
2
6
22
26
Alabama
—
0
1
1
—
2
3
8
55
61
1
1
6
21
23
Kentucky
—
0
3
5
3
9
4
27
183
32
—
0
2
1
3
Mississippi
—
0
0
—
—
—
0
2
1
3
—
0
2
—
—
Tennessee
—
0
1
1
2
2
2
8
30
84
—
0
0
—
—
W.S. Central
1
0
6
16
7
15
32
117
265
358
17
19
71
164
264
Arkansas
—
0
1
—
2
1
1
7
14
10
—
0
7
5
20
Louisiana
—
0
1
—
1
—
2
8
17
32
—
0
0
—
—
Oklahoma
—
0
0
—
1
—
0
9
—
12
—
0
23
11
24
Texas
1
0
5
16
3
14
28
113
234
304
17
16
70
148
220
Mountain
1
0
6
26
11
14
42
83
469
1,044
—
1
6
1
1
Arizona
—
0
1
3
—
4
9
30
141
222
N
0
0
N
N
Colorado
1
0
3
8
4
10
17
26
242
322
—
0
0
—
—
Idaho
—
0
1
—
7
—
2
13
21
74
—
0
1
—
—
Montana
—
0
6
15
—
—
1
18
4
126
—
0
0
—
—
Nevada
—
0
0
—
—
—
1
8
—
40
—
0
2
—
—
New Mexico
—
0
1
—
—
—
3
13
25
68
—
0
1
1
—
Utah
—
0
0
—
—
—
6
26
33
185
—
0
4
—
—
Wyoming
—
0
0
—
—
—
0
4
3
7
—
0
2
—
1
Pacific
—
0
3
7
7
12
54
229
392
1,959
—
4
13
20
54
Alaska
—
0
0
—
—
—
2
10
37
44
—
0
3
8
2
California
—
0
2
4
4
—
35
120
195
1,470
—
3
11
12
52
Hawaii
—
0
1
2
—
—
1
4
10
9
—
0
0
—
—
Oregon
—
0
2
1
—
—
8
28
38
160
—
0
4
—
—
Washington
—
0
3
—
3
12
13
118
112
276
—
0
0
—
—
Territories
American Samoa
—
0
0
—
—
—
0
0
—
—
U
0
0
U
U
C.N.M.I.
—
—
—
—
—
—
—
—
—
—
—
—
—
—
—
Guam
—
0
0
—
—
—
0
0
—
—
—
0
0
—
—
Puerto Rico
—
0
1
1
2
—
0
1
2
5
—
0
2
—
4
U.S. Virgin Islands
—
0
0
—
—
—
0
0
—
—
—
0
0
—
—
C.N.M.I.: Commonwealth of Northern Mariana Islands.
U: Unavailable. —: No reported cases. N: Not reportable. NN: Not Nationally Notifiable. NP: Nationally notifiable but not published. Cum: Cumulative year-to-date counts. Med: Median. Max: Maximum.
† Three low incidence conditions, rubella, rubella congenital, and tetanus, are in Table II to facilitate case count verification with reporting jurisdictions.
TABLE II. (Continued) Provisional* cases of selected† notifiable diseases (=1,000 cases reported during the preceding year), and selected low frequency diseases, United States and U.S. territories, weeks ending April 16, 2016, and April 18, 2015 (15th week) (Export data)
Reporting area
Rubella
Rubella, congenital syndrome
Salmonellosis
Current week
Previous 52 weeks
Cum 2016
Cum 2015
Current week
Previous 52 weeks
Cum 2016
Cum 2015
Current week
Previous 52 weeks
Cum 2016
Cum 2015
Med
Max
Med
Max
Med
Max
United States
—
0
2
5
1
—
0
1
—
—
320
992
1,698
6,970
8,773
New England
—
0
1
1
—
—
0
0
—
—
4
34
87
296
387
Connecticut
—
0
0
—
—
—
0
0
—
—
—
7
22
68
104
Maine
—
0
0
—
—
—
0
0
—
—
—
2
8
16
22
Massachusetts
—
0
1
1
—
—
0
0
—
—
—
19
50
165
204
New Hampshire
—
0
0
—
—
—
0
0
—
—
—
3
12
17
30
Rhode Island
—
0
0
—
—
—
0
0
—
—
4
1
44
12
11
Vermont
—
0
0
—
—
—
0
0
—
—
—
1
6
18
16
Mid. Atlantic
—
0
0
—
—
—
0
1
—
—
33
88
167
608
885
New Jersey
—
0
0
—
—
—
0
0
—
—
—
14
47
28
218
New York (Upstate)
—
0
0
—
—
—
0
0
—
—
17
26
49
226
242
New York City
—
0
0
—
—
—
0
1
—
—
9
17
37
164
185
Pennsylvania
—
0
0
—
—
—
0
0
—
—
7
28
69
190
240
E.N. Central
—
0
1
—
—
—
0
0
—
—
31
103
194
742
1,136
Illinois
—
0
0
—
—
—
0
0
—
—
—
35
71
195
382
Indiana
—
0
0
—
—
—
0
0
—
—
—
12
28
58
130
Michigan
—
0
0
—
—
—
0
0
—
—
5
16
35
157
202
Ohio
—
0
0
—
—
—
0
0
—
—
26
26
48
300
247
Wisconsin
—
0
1
—
—
—
0
0
—
—
—
14
90
32
175
W.N. Central
—
0
0
—
1
—
0
0
—
—
7
29
59
297
487
Iowa
—
0
0
—
—
—
0
0
—
—
—
11
27
121
166
Kansas
—
0
0
—
—
—
0
0
—
—
2
8
25
70
94
Minnesota
—
0
0
—
—
—
0
0
—
—
—
0
0
—
—
Missouri
—
0
0
—
1
—
0
0
—
—
—
0
0
—
86
Nebraska
—
0
0
—
—
—
0
0
—
—
5
5
13
45
71
North Dakota
—
0
0
—
—
—
0
0
—
—
—
2
8
26
18
South Dakota
—
0
0
—
—
—
0
0
—
—
—
4
11
35
52
S. Atlantic
—
0
2
3
—
—
0
0
—
—
119
270
483
1,912
2,067
Delaware
—
0
0
—
—
—
0
0
—
—
—
2
11
11
22
District of Columbia
—
0
0
—
—
—
0
0
—
—
—
0
2
—
6
Florida
—
0
1
2
—
—
0
0
—
—
74
118
191
1,041
899
Georgia
—
0
0
—
—
—
0
0
—
—
12
33
88
260
317
Maryland
—
0
1
1
—
—
0
0
—
—
12
15
37
158
163
North Carolina
—
0
0
—
—
—
0
0
—
—
—
25
154
103
303
South Carolina
—
0
1
—
—
—
0
0
—
—
12
25
68
167
161
Virginia
—
0
0
—
—
—
0
0
—
—
9
21
55
153
156
West Virginia
—
0
0
—
—
—
0
0
—
—
—
3
12
19
40
E.S. Central
—
0
0
—
—
—
0
0
—
—
18
72
134
587
519
Alabama
—
0
0
—
—
—
0
0
—
—
4
21
47
209
169
Kentucky
—
0
0
—
—
—
0
0
—
—
—
11
60
116
94
Mississippi
—
0
0
—
—
—
0
0
—
—
—
21
56
114
117
Tennessee
—
0
0
—
—
—
0
0
—
—
14
16
33
148
139
W.S. Central
—
0
1
—
—
—
0
0
—
—
67
164
404
1,038
1,085
Arkansas
—
0
0
—
—
—
0
0
—
—
9
15
34
69
74
Louisiana
—
0
0
—
—
—
0
0
—
—
13
26
62
199
143
Oklahoma
—
0
0
—
—
—
0
0
—
—
—
11
61
87
81
Texas
—
0
1
—
—
—
0
0
—
—
45
103
372
683
787
Mountain
—
0
0
—
—
—
0
0
—
—
17
59
176
397
734
Arizona
—
0
0
—
—
—
0
0
—
—
13
18
49
169
239
Colorado
—
0
0
—
—
—
0
0
—
—
—
10
30
—
113
Idaho
—
0
0
—
—
—
0
0
—
—
—
5
108
38
78
Montana
—
0
0
—
—
—
0
0
—
—
4
3
9
30
64
Nevada
—
0
0
—
—
—
0
0
—
—
—
4
14
8
51
New Mexico
—
0
0
—
—
—
0
0
—
—
—
7
26
53
71
Utah
—
0
0
—
—
—
0
0
—
—
—
7
30
88
97
Wyoming
—
0
0
—
—
—
0
0
—
—
—
2
7
11
21
Pacific
—
0
1
1
—
—
0
0
—
—
24
132
282
1,093
1,473
Alaska
—
0
0
—
—
—
0
0
—
—
2
2
7
21
13
California
—
0
0
—
—
—
0
0
—
—
2
100
209
805
1,190
Hawaii
—
0
0
—
—
—
0
0
—
—
—
5
12
52
64
Oregon
—
0
1
1
—
—
0
0
—
—
5
9
21
86
90
Washington
—
0
0
—
—
—
0
0
—
—
15
15
72
129
116
Territories
American Samoa
—
0
0
—
—
—
0
0
—
—
—
0
0
—
—
C.N.M.I.
—
—
—
—
—
—
—
—
—
—
—
—
—
—
—
Guam
—
0
0
—
—
—
0
0
—
—
—
0
0
—
—
Puerto Rico
—
0
0
—
—
—
0
0
—
—
—
11
25
104
143
U.S. Virgin Islands
—
0
0
—
—
—
0
0
—
—
—
0
0
—
—
C.N.M.I.: Commonwealth of Northern Mariana Islands.
U: Unavailable. —: No reported cases. N: Not reportable. NN: Not Nationally Notifiable. NP: Nationally notifiable but not published. Cum: Cumulative year-to-date counts. Med: Median. Max: Maximum.
† Three low incidence conditions, rubella, rubella congenital, and tetanus, are in Table II to facilitate case count verification with reporting jurisdictions.
TABLE II. (Continued) Provisional* cases of selected† notifiable diseases (=1,000 cases reported during the preceding year), and selected low frequency diseases, United States and U.S. territories, weeks ending April 16, 2016, and April 18, 2015 (15th week) (Export data)
Reporting area
Shiga toxin-producing E. coli (STEC)§
Shigellosis
Current week
Previous 52 weeks
Cum 2016
Cum 2015
Current week
Previous 52 weeks
Cum 2016
Cum 2015
Med
Max
Med
Max
United States
35
123
242
851
996
179
411
699
4,943
4,795
New England
—
4
35
81
45
—
5
17
54
55
Connecticut
—
1
33
55
16
—
1
4
8
17
Maine
—
0
3
4
4
—
0
1
—
1
Massachusetts
—
1
6
16
10
—
3
13
38
35
New Hampshire
—
0
4
2
8
—
0
2
1
—
Rhode Island
—
0
2
—
3
—
0
6
7
2
Vermont
—
0
4
4
4
—
0
1
—
—
Mid. Atlantic
16
13
22
140
88
15
25
55
307
702
New Jersey
—
0
6
10
19
—
5
13
32
99
New York (Upstate)
12
5
16
70
26
3
4
10
44
171
New York City
2
2
8
21
19
8
8
24
121
363
Pennsylvania
2
4
12
39
24
4
8
24
110
69
E.N. Central
1
17
35
84
146
28
49
115
893
602
Illinois
—
3
9
15
38
—
16
35
109
209
Indiana
—
2
8
5
11
—
5
10
69
90
Michigan
—
2
7
28
26
3
9
23
95
126
Ohio
1
4
19
30
31
13
17
54
391
117
Wisconsin
—
3
12
6
40
12
5
31
229
60
W.N. Central
1
10
22
73
84
12
26
61
356
285
Iowa
—
3
10
25
11
—
13
41
202
39
Kansas
—
2
5
14
18
—
4
14
91
17
Minnesota
—
0
0
—
—
—
0
0
—
—
Missouri
—
0
0
—
19
—
0
0
—
172
Nebraska
1
2
7
23
23
12
2
9
57
29
North Dakota
—
1
6
5
5
—
0
2
2
2
South Dakota
—
1
5
6
8
—
3
20
4
26
S. Atlantic
4
12
24
105
107
18
71
144
679
1,065
Delaware
—
0
1
1
1
—
0
3
7
12
District of Columbia
—
0
1
—
1
—
0
3
—
12
Florida
2
3
8
45
33
6
25
86
176
479
Georgia
—
1
7
11
28
4
23
41
211
313
Maryland
1
1
6
13
12
1
3
13
39
83
North Carolina
—
1
6
4
12
—
5
30
49
77
South Carolina
1
1
7
10
7
2
4
44
86
41
Virginia
—
2
7
19
11
5
7
22
111
46
West Virginia
—
0
3
2
2
—
0
4
—
2
E.S. Central
1
6
15
62
47
8
24
47
223
411
Alabama
—
1
5
8
12
6
10
31
110
150
Kentucky
—
1
6
11
8
—
5
21
54
140
Mississippi
—
0
3
3
6
—
1
7
13
31
Tennessee
1
3
11
40
21
2
3
10
46
90
W.S. Central
1
15
51
95
121
49
129
379
1,434
936
Arkansas
—
1
6
6
15
1
3
9
47
10
Louisiana
1
0
12
5
18
2
4
16
83
36
Oklahoma
—
1
32
9
6
—
16
165
186
94
Texas
—
10
41
75
82
46
101
361
1,118
796
Mountain
3
14
39
76
92
40
22
47
511
180
Arizona
—
2
11
27
16
39
14
41
448
128
Colorado
—
3
16
—
25
—
2
8
—
12
Idaho
2
3
9
28
12
1
1
5
26
2
Montana
1
2
6
13
11
—
0
2
3
8
Nevada
—
0
7
2
7
—
0
6
—
9
New Mexico
—
0
3
1
5
—
1
5
11
12
Utah
—
1
8
5
12
—
1
8
20
9
Wyoming
—
0
0
—
4
—
0
4
3
—
Pacific
8
24
137
135
266
9
47
168
486
559
Alaska
—
0
2
3
4
—
0
1
—
2
California
—
15
34
69
188
7
39
158
373
501
Hawaii
—
0
3
5
19
—
1
6
9
17
Oregon
5
4
11
34
41
—
2
10
59
7
Washington
3
0
124
24
14
2
2
26
45
32
Territories
American Samoa
—
0
0
—
—
—
0
0
—
—
C.N.M.I.
—
—
—
—
—
—
—
—
—
—
Guam
—
0
0
—
—
—
0
0
—
—
Puerto Rico
—
0
1
—
1
—
0
7
4
2
U.S. Virgin Islands
—
0
0
—
—
—
0
0
—
—
C.N.M.I.: Commonwealth of Northern Mariana Islands.
U: Unavailable. —: No reported cases. N: Not reportable. NN: Not Nationally Notifiable. NP: Nationally notifiable but not published. Cum: Cumulative year-to-date counts. Med: Median. Max: Maximum.
† Three low incidence conditions, rubella, rubella congenital, and tetanus, are in Table II to facilitate case count verification with reporting jurisdictions.
§ Includes E. coli O157:H7, Shiga toxin-positive, serogroup non-O157, and Shiga toxin-positive, not serogrouped.
TABLE II. (Continued) Provisional* cases of selected† notifiable diseases (=1,000 cases reported during the preceding year), and selected low frequency diseases, United States and U.S. territories, weeks ending April 16, 2016, and April 18, 2015 (15th week) (Export data)
Reporting area
Spotted Fever Rickettsiosis (including RMSF)§
Syphilis, primary and secondary
Confirmed
Probable
Current week
Previous 52 weeks
Cum 2016
Cum 2015
Current week
Previous 52 weeks
Cum 2016
Cum 2015
Current week
Previous 52 weeks
Cum 2016
Cum 2015
Med
Max
Med
Max
Med
Max
United States
—
1
7
3
12
14
53
215
165
196
87
449
548
5,324
6,465
New England
—
0
1
—
1
—
0
2
1
3
3
13
27
120
166
Connecticut
—
0
0
—
1
—
0
1
—
2
—
1
7
8
26
Maine
—
0
0
—
—
—
0
1
1
—
—
0
5
1
10
Massachusetts
—
0
1
—
—
—
0
1
—
1
—
8
17
67
101
New Hampshire
—
0
0
—
—
—
0
0
—
—
—
0
7
14
12
Rhode Island
—
0
0
—
—
—
0
1
—
—
2
2
5
24
13
Vermont
—
0
0
—
—
—
0
0
—
—
1
0
2
6
4
Mid. Atlantic
—
0
1
1
—
—
2
12
7
7
14
57
89
749
743
New Jersey
—
0
1
—
—
—
0
7
—
2
—
5
14
58
101
New York (Upstate)
—
0
1
1
—
—
0
3
1
2
7
9
45
108
89
New York City
—
0
0
—
—
—
0
3
4
3
2
30
45
409
387
Pennsylvania
—
0
0
—
—
—
0
4
2
—
5
13
24
174
166
E.N. Central
—
0
3
—
—
—
1
9
1
6
2
44
67
450
681
Illinois
—
0
3
—
—
—
0
6
—
3
—
17
35
107
261
Indiana
—
0
0
—
—
—
0
3
—
—
—
6
15
94
72
Michigan
—
0
0
—
—
—
0
2
—
—
—
6
12
36
138
Ohio
—
0
1
—
—
—
0
3
—
1
—
11
20
176
188
Wisconsin
—
0
0
—
—
—
0
1
1
2
2
2
5
37
22
W.N. Central
—
0
4
—
1
1
7
26
7
15
1
15
31
246
226
Iowa
—
0
0
—
—
—
0
1
—
1
—
1
4
15
18
Kansas
—
0
0
—
1
—
1
13
2
10
—
1
5
24
20
Minnesota
—
0
0
—
—
—
0
0
—
—
—
5
11
89
56
Missouri
—
0
1
—
—
1
4
18
5
3
1
6
16
105
96
Nebraska
—
0
3
—
—
—
0
2
—
—
—
0
4
5
18
North Dakota
—
0
1
—
—
—
0
1
—
1
—
0
2
4
4
South Dakota
—
0
1
—
—
—
0
1
—
—
—
0
2
4
14
S. Atlantic
—
0
4
—
3
2
10
78
36
46
7
113
161
1,299
1,796
Delaware
—
0
0
—
—
—
0
4
3
—
—
1
7
20
8
District of Columbia
—
0
0
—
—
—
0
0
—
—
—
1
6
14
34
Florida
—
0
1
—
—
1
0
5
3
6
2
40
65
530
547
Georgia
—
0
4
—
3
—
0
0
—
—
1
26
41
292
560
Maryland
—
0
0
—
—
—
0
2
5
1
1
9
18
97
117
North Carolina
—
0
1
—
—
—
3
67
8
32
—
21
42
137
332
South Carolina
—
0
1
—
—
—
1
3
2
3
3
5
15
107
87
Virginia
—
0
1
—
—
1
3
23
15
3
—
6
31
89
97
West Virginia
—
0
0
—
—
—
0
1
—
1
—
1
4
13
14
E.S. Central
—
0
3
2
—
9
15
65
76
63
2
17
34
226
253
Alabama
—
0
1
—
—
6
4
19
36
22
—
6
11
59
77
Kentucky
—
0
1
1
—
—
2
10
12
8
—
3
12
51
40
Mississippi
—
0
1
—
—
—
2
8
8
3
2
3
9
63
53
Tennessee
—
0
3
1
—
3
9
42
20
30
—
5
13
53
83
W.S. Central
—
0
1
—
—
2
13
72
32
47
36
50
70
684
676
Arkansas
—
0
1
—
—
1
12
71
26
39
1
3
9
36
5
Louisiana
—
0
1
—
—
—
0
2
—
2
—
11
30
114
146
Oklahoma
—
0
0
—
—
—
0
16
—
2
—
2
11
20
50
Texas
—
0
1
—
—
1
1
5
6
4
35
33
48
514
475
Mountain
—
0
2
—
7
—
0
3
4
5
2
26
39
286
366
Arizona
—
0
1
—
6
—
0
1
3
3
1
10
19
115
169
Colorado
—
0
0
—
—
—
0
1
—
2
—
4
9
38
64
Idaho
—
0
0
—
—
—
0
2
—
—
—
1
7
14
5
Montana
—
0
1
—
—
—
0
1
—
—
—
0
3
10
1
Nevada
—
0
1
—
—
—
0
0
—
—
—
6
15
68
81
New Mexico
—
0
0
—
—
—
0
1
1
—
1
2
10
40
30
Utah
—
0
0
—
1
—
0
2
—
—
—
1
5
1
15
Wyoming
—
0
0
—
—
—
0
1
—
—
—
0
1
—
1
Pacific
—
0
1
—
—
—
0
2
1
4
20
111
136
1,264
1,558
Alaska
—
0
0
—
—
—
0
0
—
—
—
0
2
—
—
California
—
0
1
—
—
—
0
1
1
2
11
96
120
1,106
1,327
Hawaii
—
0
0
—
—
—
0
0
—
—
—
1
6
14
24
Oregon
—
0
0
—
—
—
0
1
—
2
5
6
12
80
93
Washington
—
0
0
—
—
—
0
0
—
—
4
8
13
64
114
Territories
American Samoa
—
0
0
—
—
—
0
0
—
—
—
0
0
—
—
C.N.M.I.
—
—
—
—
—
—
—
—
—
—
—
—
—
—
—
Guam
—
0
0
—
—
—
0
0
—
—
—
0
0
—
—
Puerto Rico
—
0
0
—
—
—
0
0
—
—
—
9
38
115
119
U.S. Virgin Islands
—
0
0
—
—
—
0
0
—
—
—
0
0
—
—
C.N.M.I.: Commonwealth of Northern Mariana Islands.
U: Unavailable. —: No reported cases. N: Not reportable. NN: Not Nationally Notifiable. NP: Nationally notifiable but not published. Cum: Cumulative year-to-date counts. Med: Median. Max: Maximum.
† Three low incidence conditions, rubella, rubella congenital, and tetanus, are in Table II to facilitate case count verification with reporting jurisdictions.
§ Illnesses with similar clinical presentation that result from Spotted Fever Group Rickettsia infections are reported as Spotted Fever Rickettsioses. Rocky Mountain Spotted Fever (RMSF), caused by Rickettsia rickettsii, is the most common and well-known Spotted Fever.
TABLE II. (Continued) Provisional* cases of selected† notifiable diseases (=1,000 cases reported during the preceding year), and selected low frequency diseases, United States and U.S. territories, weeks ending April 16, 2016, and April 18, 2015 (15th week) (Export data)
Reporting area
Tetanus
Varicella (chickenpox)
Vibriosis§
Current week
Previous 52 weeks
Cum 2016
Cum 2015
Current week
Previous 52 weeks
Cum 2016
Cum 2015
Current week
Previous 52 weeks
Cum 2016
Cum 2015
Med
Max
Med
Max
Med
Max
United States
—
0
3
5
6
97
173
250
2,214
2,862
8
17
69
93
157
New England
—
0
1
—
1
6
16
33
206
304
—
1
13
10
7
Connecticut
—
0
0
—
—
1
3
10
49
49
—
0
7
1
3
Maine
—
0
0
—
—
5
4
9
56
68
—
0
3
—
—
Massachusetts
—
0
0
—
—
—
6
14
66
118
—
1
9
7
4
New Hampshire
—
0
1
—
1
—
1
7
1
36
—
0
2
1
—
Rhode Island
—
0
0
—
—
—
1
5
9
19
—
0
2
1
—
Vermont
—
0
0
—
—
—
0
6
25
14
—
0
1
—
—
Mid. Atlantic
—
0
1
—
—
10
20
38
229
334
1
1
7
3
3
New Jersey
—
0
0
—
—
—
5
18
56
112
—
0
4
—
—
New York (Upstate)
—
0
1
—
—
N
0
0
N
N
N
0
0
N
N
New York City
—
0
1
—
—
—
0
0
—
—
—
0
3
1
1
Pennsylvania
—
0
1
—
—
10
13
28
173
222
1
0
2
2
2
E.N. Central
—
0
1
1
1
28
36
80
599
545
1
1
6
7
12
Illinois
—
0
1
—
1
—
7
16
95
112
—
0
3
2
4
Indiana
—
0
0
—
—
1
3
7
49
55
—
0
1
2
1
Michigan
—
0
0
—
—
9
10
36
201
134
—
0
1
1
5
Ohio
—
0
1
1
—
9
9
21
159
133
1
0
2
2
1
Wisconsin
—
0
1
—
—
9
6
13
95
111
—
0
2
—
1
W.N. Central
—
0
0
—
1
1
13
25
151
261
1
0
2
2
—
Iowa
—
0
0
—
—
N
0
0
N
N
N
0
0
N
N
Kansas
—
0
0
—
—
—
2
12
—
75
1
0
2
1
—
Minnesota
—
0
0
—
—
—
6
14
71
115
—
0
0
—
—
Missouri
—
0
0
—
—
—
2
9
40
47
—
0
0
—
—
Nebraska
—
0
0
—
—
1
0
3
12
3
—
0
1
—
—
North Dakota
—
0
0
—
—
—
0
5
17
12
—
0
1
1
—
South Dakota
—
0
0
—
1
—
0
3
11
9
N
0
0
N
N
S. Atlantic
—
0
2
1
2
16
29
58
385
488
3
7
14
30
44
Delaware
—
0
0
—
—
—
0
3
3
10
—
0
2
—
—
District of Columbia
—
0
0
—
—
—
0
1
1
—
—
0
0
—
—
Florida
—
0
1
1
1
16
14
39
279
257
2
4
9
20
27
Georgia
—
0
0
—
—
—
2
8
20
45
—
0
2
4
7
Maryland
—
0
0
—
—
N
0
0
N
N
1
0
6
1
—
North Carolina
—
0
1
—
—
N
0
0
N
N
—
0
6
1
7
South Carolina
—
0
0
—
1
—
3
13
20
53
—
0
2
3
—
Virginia
—
0
0
—
—
—
6
13
57
98
—
0
3
1
2
West Virginia
—
0
0
—
—
—
2
9
5
25
—
0
1
—
1
E.S. Central
—
0
1
—
—
—
2
11
29
67
1
0
4
10
4
Alabama
—
0
1
—
—
—
2
11
28
60
—
0
4
3
2
Kentucky
—
0
0
—
—
—
0
0
—
—
—
0
2
3
—
Mississippi
—
0
0
—
—
—
0
2
1
7
—
0
2
—
1
Tennessee
—
0
0
—
—
N
0
0
N
N
1
0
2
4
1
W.S. Central
—
0
2
1
—
29
31
76
358
477
1
3
8
10
15
Arkansas
—
0
0
—
—
1
3
23
46
45
—
0
1
—
1
Louisiana
—
0
1
—
—
—
2
21
16
18
—
1
5
4
13
Oklahoma
—
0
0
—
—
N
0
0
N
N
—
0
1
—
—
Texas
—
0
1
1
—
28
25
72
296
414
1
1
8
6
1
Mountain
—
0
1
1
1
7
17
34
237
336
—
1
7
2
11
Arizona
—
0
1
1
—
5
5
18
96
80
—
0
6
1
9
Colorado
—
0
1
—
1
—
4
12
20
99
—
0
1
—
1
Idaho
—
0
0
—
—
N
0
0
N
N
N
0
0
N
N
Montana
—
0
0
—
—
2
0
13
24
69
—
0
0
—
—
Nevada
—
0
0
—
—
N
0
0
N
N
—
0
1
—
—
New Mexico
—
0
1
—
—
—
1
5
16
15
—
0
0
—
—
Utah
—
0
0
—
—
—
3
18
80
73
—
0
3
1
1
Wyoming
—
0
0
—
—
—
0
3
1
—
—
0
0
—
—
Pacific
—
0
1
1
—
—
2
9
20
50
—
5
30
19
61
Alaska
—
0
1
1
—
—
1
4
5
12
—
0
1
—
—
California
—
0
1
—
—
—
1
3
4
17
—
3
14
10
48
Hawaii
—
0
0
—
—
—
1
5
11
21
—
0
5
4
8
Oregon
—
0
1
—
—
N
0
0
N
N
—
0
3
4
3
Washington
—
0
0
—
—
N
0
0
N
N
—
0
17
1
2
Territories
American Samoa
—
0
0
—
—
N
0
0
N
N
N
0
0
N
N
C.N.M.I.
—
—
—
—
—
—
—
—
—
—
—
—
—
—
—
Guam
—
0
0
—
—
—
0
0
—
—
—
0
0
—
—
Puerto Rico
—
0
0
—
1
—
2
6
26
29
—
0
0
—
—
U.S. Virgin Islands
—
0
0
—
—
—
0
0
—
—
—
0
0
—
—
C.N.M.I.: Commonwealth of Northern Mariana Islands.
U: Unavailable. —: No reported cases. N: Not reportable. NN: Not Nationally Notifiable. NP: Nationally notifiable but not published. Cum: Cumulative year-to-date counts. Med: Median. Max: Maximum.
† Three low incidence conditions, rubella, rubella congenital, and tetanus, are in Table II to facilitate case count verification with reporting jurisdictions.
§ Any species of the family Vibrionaceae, other than toxigenic Vibrio cholerae O1 or O139.
TABLE II. (Continued) Provisional* cases of selected† notifiable diseases (=1,000 cases reported during the preceding year), and selected low frequency diseases, United States and U.S. territories, weeks ending April 16, 2016, and April 18, 2015 (15th week) (Export data)
Reporting area
West Nile virus disease§
Neuroinvasive
Nonneuroinvasive¶
Current week
Previous 52 weeks
Cum 2016
Cum 2015
Current week
Previous 52 weeks
Cum 2016
Cum 2015
Med
Max
Med
Max
United States
—
3
250
—
2
—
0
0
—
—
New England
—
0
4
—
—
—
0
0
—
—
Connecticut
—
0
2
—
—
—
0
0
—
—
Maine
—
0
1
—
—
—
0
0
—
—
Massachusetts
—
0
4
—
—
—
0
0
—
—
New Hampshire
—
0
0
—
—
—
0
0
—
—
Rhode Island
—
0
0
—
—
—
0
0
—
—
Vermont
—
0
0
—
—
—
0
0
—
—
Mid. Atlantic
—
0
16
—
—
—
0
0
—
—
New Jersey
—
0
5
—
—
—
0
0
—
—
New York (Upstate)
—
0
4
—
—
—
0
0
—
—
New York City
—
0
6
—
—
—
0
0
—
—
Pennsylvania
—
0
5
—
—
—
0
0
—
—
E.N. Central
—
0
30
—
—
—
0
0
—
—
Illinois
—
0
17
—
—
—
0
0
—
—
Indiana
—
0
4
—
—
—
0
0
—
—
Michigan
—
0
5
—
—
—
0
0
—
—
Ohio
—
0
5
—
—
—
0
0
—
—
Wisconsin
—
0
3
—
—
—
0
0
—
—
W.N. Central
—
0
31
—
—
—
0
0
—
—
Iowa
—
0
4
—
—
—
0
0
—
—
Kansas
—
0
8
—
—
—
0
0
—
—
Minnesota
—
0
2
—
—
—
0
0
—
—
Missouri
—
0
7
—
—
—
0
0
—
—
Nebraska
—
0
10
—
—
—
0
0
—
—
North Dakota
—
0
6
—
—
—
0
0
—
—
South Dakota
—
0
7
—
—
—
0
0
—
—
S. Atlantic
—
0
13
—
—
—
0
0
—
—
Delaware
—
0
2
—
—
—
0
0
—
—
District of Columbia
—
0
2
—
—
—
0
0
—
—
Florida
—
0
2
—
—
—
0
0
—
—
Georgia
—
0
4
—
—
—
0
0
—
—
Maryland
—
0
10
—
—
—
0
0
—
—
North Carolina
—
0
1
—
—
—
0
0
—
—
South Carolina
—
0
0
—
—
—
0
0
—
—
Virginia
—
0
5
—
—
—
0
0
—
—
West Virginia
—
0
0
—
—
—
0
0
—
—
E.S. Central
—
0
8
—
—
—
0
0
—
—
Alabama
—
0
2
—
—
—
0
0
—
—
Kentucky
—
0
1
—
—
—
0
0
—
—
Mississippi
—
0
7
—
—
—
0
0
—
—
Tennessee
—
0
2
—
—
—
0
0
—
—
W.S. Central
—
1
52
—
2
—
0
0
—
—
Arkansas
—
0
3
—
—
—
0
0
—
—
Louisiana
—
0
7
—
—
—
0
0
—
—
Oklahoma
—
0
13
—
1
—
0
0
—
—
Texas
—
1
37
—
1
—
0
0
—
—
Mountain
—
0
38
—
—
—
0
0
—
—
Arizona
—
0
14
—
—
—
0
0
—
—
Colorado
—
0
20
—
—
—
0
0
—
—
Idaho
—
0
3
—
—
—
0
0
—
—
Montana
—
0
2
—
—
—
0
0
—
—
Nevada
—
0
5
—
—
—
0
0
—
—
New Mexico
—
0
2
—
—
—
0
0
—
—
Utah
—
0
3
—
—
—
0
0
—
—
Wyoming
—
0
2
—
—
—
0
0
—
—
Pacific
—
1
81
—
—
—
0
0
—
—
Alaska
—
0
0
—
—
—
0
0
—
—
California
—
1
80
—
—
—
0
0
—
—
Hawaii
—
0
0
—
—
—
0
0
—
—
Oregon
—
0
1
—
—
—
0
0
—
—
Washington
—
0
4
—
—
—
0
0
—
—
Territories
American Samoa
—
0
0
—
—
—
0
0
—
—
C.N.M.I.
—
—
—
—
—
—
—
—
—
—
Guam
—
0
0
—
—
—
0
0
—
—
Puerto Rico
—
0
0
—
—
—
0
0
—
—
U.S. Virgin Islands
—
0
0
—
—
—
0
0
—
—
C.N.M.I.: Commonwealth of Northern Mariana Islands.
U: Unavailable. —: No reported cases. N: Not reportable. NN: Not Nationally Notifiable. NP: Nationally notifiable but not published. Cum: Cumulative year-to-date counts. Med: Median. Max: Maximum.
† Three low incidence conditions, rubella, rubella congenital, and tetanus, are in Table II to facilitate case count verification with reporting jurisdictions.
§ Updated weekly from reports to the Division of Vector-Borne Diseases, National Center for Emerging and Zoonotic Infectious Diseases (ArboNET Surveillance). Data for Jamestown Canyon virus, La Crosse virus, Chikungunya virus, Eastern equine encephalitis virus, Powassan virus, St. Louis virus, and Western equine encephalitis virus diseases are available in Table I.
¶ Not reportable in all states. Data from states where the condition is not reportable are excluded from this table, except for the arboviral diseases and influenza-associated pediatric mortality. Reporting exceptions are available at http://wwwn.cdc.gov/nndss/downloads.html.
TABLE III. Deaths in 122 U.S. cities,* week ending April 16, 2016 (15th week) (Export data)
Reporting area
All causes, by age (years)
P&I† Total
Reporting area (Continued)
All causes, by age (years)
P&I† Total
All Ages
=65
45–64
25–44
1–24
<1
All Ages
=65
45–64
25–44
1–24
<1
New England
580
394
143
33
7
2
52
S. Atlantic
1,176
786
279
74
22
15
105
Boston, MA
140
90
36
8
5
1
16
Atlanta, GA
162
101
47
9
4
1
13
Bridgeport, CT
30
26
3
1
—
—
3
Baltimore, MD
165
111
38
10
4
2
16
Cambridge, MA
22
16
5
1
—
—
3
Charlotte, NC
139
91
36
10
2
—
8
Fall River, MA
33
20
10
3
—
—
6
Jacksonville, FL
164
108
35
12
5
4
24
Hartford, CT
54
32
16
6
—
—
4
Miami, FL
77
57
10
9
1
—
4
Lowell, MA
27
21
4
2
—
—
3
Norfolk, VA
32
18
9
3
—
2
2
Lynn, MA
17
8
6
3
—
—
1
Richmond, VA
52
37
12
3
—
—
3
New Bedford, MA
23
15
7
1
—
—
3
Savannah, GA
63
45
11
6
1
—
4
New Haven, CT
32
22
6
3
1
—
2
St. Petersburg, FL
78
51
18
4
1
4
9
Providence, RI
78
59
16
3
—
—
4
Tampa, FL
135
97
29
4
4
1
13
Somerville, MA
4
3
1
—
—
—
—
Washington, D.C.
95
61
31
2
—
1
9
Springfield, MA
43
25
16
1
1
—
—
Wilmington, DE
14
9
3
2
—
—
—
Waterbury, CT
36
27
7
1
—
—
—
E.S. Central
1,024
649
260
81
19
15
84
Worcester, MA
41
30
10
—
—
1
7
Birmingham, AL
186
117
45
17
4
3
19
Mid. Atlantic
1,575
1,133
334
77
22
9
101
Chattanooga, TN
101
59
31
11
—
—
7
Albany, NY
54
39
10
5
—
—
5
Knoxville, TN
107
78
19
7
1
2
16
Allentown, PA
37
25
8
2
1
1
2
Lexington, KY
127
82
35
8
2
—
3
Buffalo, NY
71
49
17
2
3
—
12
Memphis, TN
198
126
49
16
4
3
16
Camden, NJ
32
17
9
3
2
1
1
Mobile, AL
87
58
22
4
2
1
3
Elizabeth, NJ
14
7
3
4
—
—
1
Montgomery, AL
43
26
10
6
1
—
2
Erie, PA
54
46
7
1
—
—
4
Nashville, TN
175
103
49
12
5
6
18
Jersey City, NJ
12
6
4
2
—
—
1
W.S. Central
1,818
1,164
447
132
40
35
121
New York City, NY
851
605
196
33
13
4
41
Austin, TX
97
59
26
6
5
1
5
Newark, NJ
47
27
8
11
1
—
—
Baton Rouge, LA
123
82
26
9
4
2
7
Paterson, NJ
13
8
2
1
—
2
—
Corpus Christi, TX
96
66
22
4
1
3
16
Philadelphia, PA
U
U
U
U
U
U
U
Dallas, TX
252
153
62
24
6
7
11
Pittsburgh, PA
U
U
U
U
U
U
U
El Paso, TX
132
93
29
6
3
1
—
Reading, PA
30
23
6
1
—
—
—
Fort Worth, TX
U
U
U
U
U
U
U
Rochester, NY
173
140
27
4
1
1
15
Houston, TX
416
258
109
38
4
7
33
Schenectady, NY
22
17
3
2
—
—
2
Little Rock, AR
122
71
34
8
3
6
12
Scranton, PA
32
25
7
—
—
—
3
New Orleans, LA
49
23
12
11
1
2
4
Syracuse, NY
101
77
20
3
1
—
11
San Antonio, TX
343
226
86
18
9
4
17
Trenton, NJ
8
4
2
2
—
—
—
Shreveport, LA
63
48
13
2
—
—
4
Utica, NY
15
12
3
—
—
—
2
Tulsa, OK
125
85
28
6
4
2
12
Yonkers, NY
9
6
2
1
—
—
1
Mountain
976
662
214
64
24
12
85
E.N. Central
2,214
1,468
498
156
55
37
155
Albuquerque, NM
145
104
24
12
4
1
15
Akron, OH
51
32
13
4
1
1
7
Boise, ID
66
47
13
5
1
—
6
Canton, OH
38
32
4
1
1
—
7
Colorado Springs, CO
3
3
—
—
—
—
—
Chicago, IL
266
156
73
24
10
3
14
Denver, CO
26
15
9
—
—
2
—
Cincinnati, OH
101
52
25
12
5
7
9
Las Vegas, NV
334
240
72
12
7
3
28
Cleveland, OH
294
213
58
14
4
5
21
Ogden, UT
33
27
5
1
—
—
4
Columbus, OH
264
174
60
16
5
9
13
Phoenix, AZ
186
113
51
15
5
2
18
Dayton, OH
182
119
42
17
3
1
13
Pueblo, CO
13
10
3
—
—
—
1
Detroit, MI
67
41
16
7
2
1
1
Salt Lake City, UT
170
103
37
19
7
4
13
Evansville, IN
51
34
14
3
—
—
4
Tucson, AZ
U
U
U
U
U
U
U
Fort Wayne, IN
104
76
14
8
5
1
7
Pacific
1,772
1,243
356
110
37
25
148
Gary, IN
10
4
5
1
—
—
—
Berkeley, CA
12
9
2
1
—
—
2
Grand Rapids, MI
65
42
17
4
2
—
5
Fresno, CA
142
90
32
13
4
3
17
Indianapolis, IN
222
142
58
14
4
4
19
Glendale, CA
33
30
—
3
—
—
7
Lansing, MI
52
39
8
3
2
—
5
Honolulu, HI
97
71
18
2
1
5
10
Milwaukee, WI
82
50
21
6
4
1
4
Long Beach, CA
83
51
27
3
—
2
10
Peoria, IL
60
40
13
5
—
2
4
Los Angeles, CA
266
180
59
17
8
2
24
Rockford, IL
66
56
6
2
2
—
2
Pasadena, CA
37
28
4
—
3
2
3
South Bend, IN
60
45
6
6
1
2
6
Portland, OR
112
73
31
5
1
2
3
Toledo, OH
112
74
30
7
1
—
7
Sacramento, CA
216
152
45
17
2
—
14
Youngstown, OH
67
47
15
2
3
—
7
San Diego, CA
169
119
29
13
5
2
15
W.N. Central
635
417
135
45
21
17
50
San Francisco, CA
135
81
34
15
1
4
8
Des Moines, IA
—
—
—
—
—
—
—
San Jose, CA
218
167
34
7
8
2
14
Duluth, MN
37
30
6
1
—
—
5
Santa Cruz, CA
33
29
2
2
—
—
1
Kansas City, KS
21
8
9
3
—
1
2
Seattle, WA
—
—
—
—
—
—
—
Kansas City, MO
83
50
26
2
2
3
6
Spokane, WA
79
60
14
3
1
1
3
Lincoln, NE
55
46
7
2
—
—
4
Tacoma, WA
140
103
25
9
3
—
17
Minneapolis, MN
64
36
15
6
3
4
6
Total§
11,770
7,916
2,666
772
247
167
901
Omaha, NE
109
77
18
5
4
5
10
St. Louis, MO
86
45
23
9
6
3
3
St. Paul, MN
76
59
9
5
2
1
4
Wichita, KS
104
66
22
12
4
—
10
U: Unavailable. —: No reported cases.
* Mortality data in this table are voluntarily reported from 122 cities in the United States, most of which have populations of >100,000. A death is reported by the place of its occurrence and by the week that the death certificate was filed. Fetal deaths are not included.
Use of trade names and commercial sources is for identification only and does not imply endorsement by the U.S. Department of Health and Human Services. References to non-CDC sites on the Internet are provided as a service to MMWR readers and do not constitute or imply endorsement of these organizations or their programs by CDC or the U.S. Department of Health and Human Services. CDC is not responsible for the content of pages found at these sites. URL addresses listed in MMWR were current as of the date of publication.
All HTML versions of MMWR articles are generated from final proofs through an automated process. This conversion might result in character translation or format errors in the HTML version. Users are referred to the electronic PDF version (https://www.cdc.gov/mmwr) and/or the original MMWR paper copy for printable versions of official text, figures, and tables.
Questions or messages regarding errors in formatting should be addressed to mmwrq@cdc.gov.