Final state-level influenza vaccination coverage estimates for the 2010–11 season–United States, National Immunization Survey and Behavioral Risk Factor Surveillance System, August 2010 through May 2011
To estimate monthly cumulative influenza vaccination coverage from August 2010 through May 2011, CDC analyzed the National Immunization Survey (NIS) data for children 6 months–17 years and the Behavioral Risk Factor Surveillance System (BRFSS) data for adults =18 years. The monthly estimates for each state, each Health and Human Services region, and the United States by age and racial/ethnic groups are provided in the (1) as interactive maps, figures, and tables. This report presents a summary of the findings from these surveys, provides additional national estimates by sex and race/ethnicity, and in combination with the , updates the estimates presented in the MMWR publication “Interim Results: State-Specific Influenza Vaccination Coverage — United States, August 2010–February 2011” (2).
Key Findings
Influenza vaccination coverage among children increased for the 2010–11 season compared to 2009–10 seasonal (trivalent) coverage. Over the past two seasons, coverage was stable for adults =18 years.
Coverage by age groups
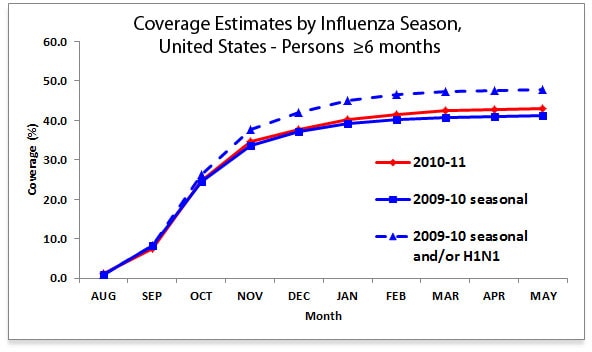
Among persons =6 months, the estimated national influenza vaccination cumulative coverage through May was 43.0% (Table 1), 1.8 percentage-points higher than 2009–10 seasonal (trivalent) coverage (3). State-specific coverage ranged from 55.6% (South Dakota) to 36.5% (Florida) (1).
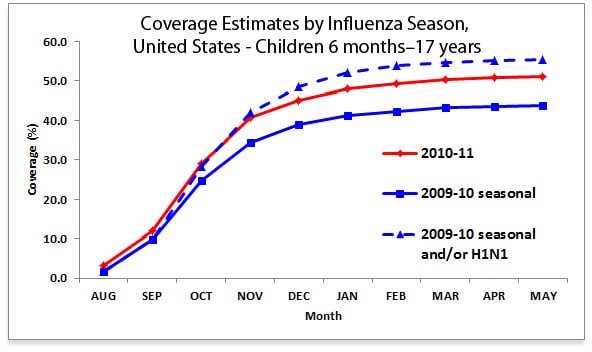
Among children 6 months–17 years, the estimated national coverage (=1 or more doses for children <9 years) was 51.0%, 7.3 percentage-points higher than 2009–10 seasonal (trivalent) coverage. State-specific coverage for children 6 months–17 years ranged from 79.3% (Rhode Island) to 37.3% (Montana).
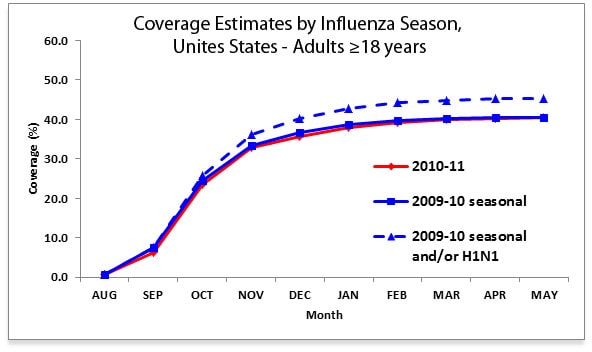
Among adults =18 years, the estimated national coverage was 40.5%, comparable to 2009–10 seasonal (trivalent) coverage (40.4%). State-specific coverage for adults =18 years ranged from 56.2% (South Dakota) to 32.7% (Nevada).
Among all age groups, the estimated national coverage varied widely. Coverage for children decreased with increasing age; 68.2% of children 6–23 months received 1 or more doses of influenza vaccine, compared to 60.6% among children 2–4 years, 54.7% among children 5–12 years and 34.5% among children 13–17 years. In contrast, the coverage for adults increased with increasing age. For adults 18–49 years coverage was 30.5%, for adults 50–64 years coverage was 44.5%, and for adults =65 years coverage was 66.6%.
Among adults 18–49 years, the estimated national coverage for the 2010–11 season was similar to 2009–10 seasonal (trivalent) coverage (29.9%, 95% Confidence Interval [CI] 29.4–30.4, for 2009–10 season) (CDC unpublished), and was 2.3 percentage-points higher than 2008–09 coverage (28.2%, CI 27.4–29.0).
Among adults 50–64 years, the estimated national coverage for the 2010–11 season was similar to 2009–10 seasonal (trivalent) coverage (45.0%, CI 44.4–45.6), and was 1.4 percentage-points lower than 2008–09 coverage (45.9%, CI 45.1–46.7).
Among adults =65 years, the estimated national coverage for the 2010–11 season was 3.0 percentage-points lower than 2009–10 seasonal (trivalent) coverage (69.6%, CI 69.0–70.2), and was 7.0 percentage-points lower than 2008–09 coverage (73.6%, CI 73.0–74.2).
Among adults 18–64 years with at least one selected high-risk condition measured by BRFSS (asthma, diabetes or heart disease), estimated national coverage was 46.7%, similar to 2009–10 seasonal (trivalent) coverage (46.2%, CI 45.2–47.2) and 2008–09 coverage (47.9%, CI 46.5–49.3). State-specific coverage varied widely, ranging from 68.4% (South Dakota) to 33.7% (Alaska).
Coverage by sex
Among adults 18–64 years, the estimated national coverage was 6.0 percentage-points higher for females compared with males, 37.8% and 31.8% respectively (Table 1). Among high-risk adults 18–64 years, coverage was 6.1 percentage-points higher for females compared to males, 49.4% and 43.3% respectively. For child age groups and adults =65 years, the coverage between sexes was comparable.
Coverage by race/ethnicity
Among persons =6 months, coverage among non-Hispanic whites (44.3%) was higher than that of non-Hispanic blacks (39.0%) and Hispanics (40.0%), and was similar to coverage among Asians (43.1%), American Indians and Alaska Natives (AIAN) (42.1%), and non-Hispanic others (42.9%) (Table 2).
Among children 6 months–17 years, coverage among non-Hispanic blacks (50.8%) was comparable to non-Hispanic whites (48.5%). Coverage was higher for Asians (59.4%), Non-Hispanic others (55.6%), and Hispanics (55.1%) compared to non-Hispanic whites (48.5%). The 2010–11 coverage was 5.3, 8.2, and 13.8 percentage-points higher than 2009–10 seasonal (trivalent) coverage for non-Hispanic whites (43.2%), Hispanics (46.9%), and non-Hispanic blacks (37.0%), respectively.
Among adults =18 years, non-Hispanic whites had the highest coverage (43.2%) compared to Hispanics (32.3%), non-Hispanic blacks (34.2%), non-Hispanic others (37.4%), and Asians (38.2%). Adult coverage for non-Hispanic whites, non-Hispanics blacks, and non-Hispanic others (Total) in 2010–11 was comparable to 2009–10 seasonal (trivalent) coverage (44.1%, 32.8%, 38.7%, respectively), but was 3.0 percentage-points higher in 2010–11 for Hispanics (29.3%).
Coverage by Month
Among persons =6 months, 2010–11 coverage was higher for all months except September and October compared to 2009–10 monthly seasonal (trivalent) influenza vaccination coverage (Figure 1).
Among children 6 months–17 years, monthly coverage was higher for 2010–11 season compared to 2009–10 monthly seasonal (trivalent) coverage (Figure 2).
Among adults =18 years, 2010–11 monthly coverage estimates were comparable to the 2009–10 monthly seasonal (trivalent) coverage (Figure 3).
Estimated Numbers of Persons Vaccinated
Among persons =6 months, the estimated number of those receiving one or more seasonal influenza vaccine doses were 36.6 million (CI 36.0–37.3 million) children (6 months–17 years) and 94.2 million (CI 93.3–95.1 million) adults (=18 years), for an estimated 130.9 million (CI 129.7–132.1 million) seasonal influenza vaccinees during August 2010 through May 2011.
Table 1: Estimated influenza vaccination coverage*by age groups and by sex – Behavioral Risk Factor Surveillance System (BRFSS) and National Immunization Survey (NIS), United States, † end of May 2011
Total
Male
Female
Age groups
Unweighted sample size
%‡
95% CI§
Unweighted sample size
%
95% CI
Unweighted sample size
%
95% CI
All persons
=6 mos
494,368
43.0
(±0.4))
202,213
40.6
(±0.7)
292,155
45.2
(±0.5)
Children
6 mos–17 yrs
116,799
51.0
(±0.9)
60,272
50.8
(±1.3)
56,527
51.2
(±1.3)
6 mos–4 yrs
37,895
63.6
(±1.7)
19,441
63.6
(±2.4)
18,454
63.6
(±2.4)
6–23 mos
14,508
68.2
(±2.4)
7,433
67.7
(±3.3)
7,075
68.6
(±3.4)
2–4 yrs
23,387
60.6
(±2.3)
12,008
60.9
(±3.2)
11,379
60.4
(±3.2)
5–12 yrs
46,058
54.7
(±1.5)
23,738
54.1
(±2.1)
22,320
55.4
(±2.2)
13–17 yrs
32,846
34.5
(±1.4)
17,093
34.7
(±2.0)
15,753
34.2
(±1.9)
Adults
18+ yrs
377,569
40.5
(±0.4)
141,941
37.4
(±0.8)
235,628
43.3
(±0.6)
18-64 yrs
244,933
34.8
(±0.6)
95,051
31.8
(±0.8)
149,882
37.8
(±0.6)
18-64 yrs HR ||
41,826
46.7
(±1.4)
15,522
43.3
(±2.4)
26,304
49.4
(±1.8)
18-49 yrs
116,113
30.5
(±0.6)
44,716
27.5
(±1.0)
71,397
33.6
(±0.8)
18-49 yrs HR
14,711
39.0
(±2.2)
4,676
33.8
(±3.5)
10,035
42.6
(±2.5)
50-64 yrs
128,820
44.5
(±0.6)
50,335
41.9
(±1.0)
78,485
46.9
(±0.8)
65+ yrs
132,636
66.6
(±0.6)
46,890
66.5
(±1.0)
85,746
66.7
(±0.8)
* Weighted coverage estimates are for persons interviewed September 2010 through June 2011 who reported being vaccinated August 2010 through May 2011.
† Excludes U.S. territories
‡ Month of vaccination was imputed for respondents with missing month of vaccination data. Percentages are weighted to the non–institutionalized, U.S. civilian population
§ Confidence interval
|| Selected high–risk conditions. Includes people with asthma, diabetes or heart disease.
Table 2: Estimated influenza vaccination coverage* by age groups and race/ethnicity–Behavioral Risk Factor Surveillance System (BRFSS) and National Immunization Survey (NIS), United States, † end of May 2011
Non-Hispanic white
Non-Hispanic black
Hispanic
Age groups
Unweighted sample size
%‡
95% CI§
Unweighted sample size
%
95% CI
Unweighted sample size
%
95% CI
All persons
=6 mos
377,124
44.3
(±0.4)
41,198
39.0
(±1.5)
40,119
40.0
(±1.4)
Children
6 mos–17 yrs
75,113
48.5
(±1.0)
12,182
50.8
(±2.9)
17,598
55.1
(±2.6)
6 mos–4 yrs
23,422
62.9
(±2.0)
3,923
59.1
(±6.1)
6,213
66.2
(±3.7)
6–23 mos
8,934
68.2
(±2.9)
1,542
65.1
(±8.2)
2,338
67.9
(±5.2)
2–4 yrs
14,488
59.6
(±2.5)
2,381
55.6
(±8.3)
3,875
65.0
(±5.0)
5–12 yrs
30,314
51.5
(±1.6)
4,563
54.6
(±4.5)
6,447
60.5
(±4.2)
13–17 yrs
21,377
32.9
(±1.4)
3,696
38.4
(±5.0)
4,938
34.6
(±3.7)
Adults
=18 yrs
302,011
43.2
(±0.4)
29,016
34.2
(±1.8)
22,521
32.3
(±1.6)
18-64 yrs
188,853
36.6
(±0.6)
21,059
30.9
(±1.8)
18,016
29.7
(±1.6)
18-64 yrs HR ||
30,818
48.1
(±1.6)
4,566
42.6
(±4.9)
2,984
44.6
(±5.3)
18-49 yrs
84,099
31.6
(±0.8)
10,743
28.1
(±2.4)
11,929
27.1
(±2.0)
18-49 yrs HR
10,209
39.2
(±2.4)
1,712
37.1
(±6.9)
1,415
37.3
(±6.5)
50-64 yrs
104,754
45.7
(±0.8)
10,316
38.4
(±2.4)
6,087
41.9
(±3.3)
=65 yrs
113,158
67.7
(±0.6)
7,957
56.1
(±3.3)
4,505
66.8
(±3.7)
Table 2 continued.
Non-Hispanic Other
Non-Hispanic Other (Total)
Asian
AIAN
Other**
Age groups
Unweighted sample size
%‡
95% CI§
Unweighted sample size
%
95% CI
Unweighted sample size
%
95% CI
Unweighted sample size
%
95% CI
All persons
=6 mos
31,453
42.9
(±1.6)
10,083
43.1
(±2.8)
6,731
42.1
(±4.0)
14,639
42.9
(±2.5)
Children
6 mos–17 yrs
11,906
57.1
(±2.9)
4,113
59.4
(±4.7)
1,786
55.7
(±8.0)
6,007
55.6
(±4.1)
6 mos–4 yrs
4,337
67.8
(±5.1)
1,414
70.2
(±8.5)
625
62.3
(±11.5)¶
2,298
67.0
(±7.3)
6–23 mos
1,694
74.0
(±6.5)
534
75.3
(±10.4)¶
253
71.7
(±15.3)¶
907
73.7
(±9.3)
2–4 yrs
2,643
63.6
(±7.2)
880
71.2
(±13.3)¶
372
56.3
(±16.1)¶
1,391
61.3
(±9.3)
5–12 yrs
4,734
60.2
(±4.4)
1,729
61.7
(±6.7)
743
62.4
(±13.1)¶
2,262
58.8
(±6.5)
13–17 yrs
2,835
39.3
(±4.9)
970
41.9
(±8.9)
418
33.7
(±9.2)
1,447
38.7
(±6.7)
Adults
=18 yrs
19,547
38.0
(±2.0)
5,970
38.2
(±3.3)
4,945
39.0
(±4.5)
8,632
37.4
(±3.1)
18-64 yrs
14,630
35.2
(±2.2)
4,624
36.1
(±3.5)
3,822
34.9
(±4.9)
6,184
34.3
(±3.3)
18-64 yrs HR ||
2,972
44.8
(±5.1)
484
42.8
(±10.4)¶
950
41.3
(±10.2)¶
1,538
47.3
(±7.1)
18-49 yrs
8,339
32.6
(±2.7)
2,982
33.4
(±3.9)
2,108
31.3
(±6.1)
3,249
32.1
(±4.3)
18-49 yrs HR
1,238
41.6
(±7.1)
217
34.0
(±12.5)¶
382
40.3
(±14.5)¶
639
45.5
(±9.8)
50-64 yrs
6,291
44.2
(±3.1)
1,642
49.3
(±5.7)
1,714
44.6
(±6.7)
2,935
40.5
(±4.3)
=65 yrs
4,917
64.5
(±3.3)
1,346
67.9
(±6.3)
1,123
68.7
(±8.0)
2,448
60.7
(±4.3)
* Weighted coverage estimates are for persons interviewed September 2010 through June 2011 who reported being vaccinated August 2010 through May 2011.
† Excludes U.S. territories
‡Month of vaccination was imputed for respondents with missing month of vaccination data. Percentages are weighted to the non-institutionalized, U.S. civilian population
|| Selected high-risk conditions. Includes people with asthma, diabetes or heart disease.
¶ Estimates might be unreliable because confidence interval half-width is >10.
** Includes Native Hawaiian or other Pacific Islander, multiracial, and other races.
Findings of this report are consistent with the previous published estimates (3). A moderate increase in child vaccination coverage was observed for each month of the 2010–11 season compared to 2009–10 seasonal (trivalent) coverage, whereas the monthly vaccination coverage levels among adults closely mirrored the 2009–10 seasonal (trivalent) coverage levels. This is the first season under the Advisory Committee on Immunization Practices (ACIP) recommendation for annual influenza vaccination for all persons =6 months and the second season under the ACIP recommendation for annual influenza vaccination for children 6 month–18 years (4).
During the 2010–11 season, influenza vaccination coverage between states varied widely, particularly for children and for adults aged 18–64 years with high-risk conditions. Possible reasons that may explain part of the variation by state could include differences in medical-care delivery infrastructure, population norms, and effectiveness of state and local immunization programs. The presence of advocates for influenza vaccination efforts using techniques such as school-located vaccination (5), drive through vaccination campaigns (6), and text messaging promotions (7) may positively affect local vaccination coverage.
Similar to what was observed for 2009–10 seasonal (trivalent) vaccination, Hispanic and non-Hispanic black adults had lower vaccination coverage than non-Hispanic white adults. However, no disparities were observed for Hispanic and non-Hispanic black children compared to non-Hispanic white children in 2010–11. This is in contrast to the disparities observed for seasonal (trivalent) influenza vaccination coverage in the 2009–10 season. Coverage among children increased for each of these racial/ethnic groups from 2009–10 to 2010–11 seasons, but the increases were larger for Hispanic and non-Hispanic blacks, resulting in lack of racial/ethnic disparities in child coverage for the 2010–11 season.
Overall, influenza vaccination coverage among children increased for the 2010–11 season compared to 2009–10 seasonal (trivalent) coverage, remained stable for adults 18–64 years, and decreased for adults =65 years. The 2009–10 season was unique for several reasons, such as the heightened awareness about influenza due to the 2009 H1N1 pandemic, and recommendation for two influenza vaccinations, the seasonal (trivalent) vaccine and the pandemic 2009 H1N1 (monovalent) vaccine (8). These unique circumstances likely affected uptake of influenza vaccination during the 2009–10 season, and may have influenced influenza vaccination behavior in 2010–11. For children, comparable BRFSS data from all states for the 2008–09 season were not collected. Estimates of influenza vaccination among children for the 2008–09 season were 24% from 19 states from BRFSS (9) and 29% from the National Health Interview Survey (10). Although the estimates from these two earlier surveys may not be directly comparable to the estimates in this report, these 2008–09 estimates are substantially lower than the 2009–10 seasonal (trivalent) coverage and 2010–11 child coverage estimates. The increases in child coverage may be related to implementation of the ACIP recommendations in this age group, and heightened awareness of risks of influenza associated with the 2009–10 pandemic (e.g., children were included in the initial target group for 2009 H1N1 vaccination). Among adults 18–49 years, influenza vaccination coverage increased from the 2008–09 to 2010–11 season by two percentage-points, which may reflect the first year under the ACIP recommendation for vaccination of all persons =6 months and effects of the pandemic season. Among adults =65 years, coverage dropped by four percentage-points from 2008–09 to 2009–10 seasonal (trivalent) coverage and by three percentage-points from 2009–10 to 2010–11. The decline in coverage for adults =65 years may be at least partially related the ACIP recommendation that 2009 H1N1 vaccination of this age group be considered only after demand for vaccination among the initial target groups had been met (11).
For all groups, influenza vaccination coverage for the 2010–11 season remained well below the Healthy People 2020 targets of 80% for persons 6 months–64 years and 90% for adults =65 years and adults 18–64 years with high-risk conditions. Racial/ethnic disparities in influenza vaccination among adults remained, coverage among adults =65 years appears to have declined the past two seasons, and considerable variation in coverage by state was observed. Substantial opportunities remain to increase coverage, such as expanding access through greater use of pharmacy, workplace, and school venues for vaccination, and better use of evidence-based practices at medical sites (e.g., standing orders, reminder/recall notification) (2, 12). Continued efforts are needed to ensure those at highest risk of influenza complications (i.e. elderly, young children, pregnant women, and persons with chronic health conditions) are vaccinated each year.
CDC analyzed data collected September 2010 through June 2011 from the NIS and the BRFSS from all 50 states and the District of Columbia to estimate national and state level influenza vaccination coverage for the 2010–11 influenza vaccination season. For comparison, 2008-09 coverage levels were estimated for adults using 2008-09 BRFSS data from all states, and for children from previously published estimates from the National Health Interview Survey (10) and from BRFSS in 19 states (9).
NIS is an ongoing, national landline list-assisted random-digit-dialed telephone survey of households with children who are 19–35 months or 13–17 years (NIS-Teen) at the time of interview. For children 6–18 months and 3–12 years identified during screening households for NIS and NIS-Teen, a short influenza vaccination module was added. A supplemental cellular phone sample was conducted as part of the NIS during 4th quarter 2010 and all quarters of 2011. NIS respondents =18 years were asked if their children had received a ‘flu’ vaccination since August 2010, and if so, in which month and year. The NIS Council of American Survey and Research Organizations (CASRO)* response rates across three quarters of data collection ranged from 38.1%–73.6% for landline and 26.4%–35.8% for cellular telephones. BRFSS is an on-going state-based monthly telephone survey which collects information on health conditions and risk behaviors from ~400,000 randomly selected persons =18 years among the non-institutionalized, U.S. civilian population. BRFSS respondents were asked if they had received a ‘flu’ vaccine in the past 12 months, and if so, in which month and year. The median state CASRO BRFSS response rate was 54.4%.
Kaplan-Meier survival analysis was used to determine the cumulative influenza vaccination coverage (=1 dose) during August 2010 through May 2011 using monthly interview data collected September 2010 through June 2011. NIS data (n=116,799) were used to estimate coverage for children 6 months–17 years and BRFSS data (n=377,569) were used to estimate coverage for adults =18 years. Coverage estimates for all persons =6 months was determined using combined state-level monthly estimates weighted by the age-specific populations of each state. For participants who indicated they had been vaccinated but had a missing month and year of vaccination, this information was imputed from donor pools matched for week of interview, age group, state of residence and race/ethnicity. Results from both surveys were weighted and analyzed with SAS and SUDAAN statistical software to account for the complex survey design. Student t tests were used to determine statistical significance in differences between groups and between 2009–10 and 2010–11 vaccination coverage levels.
These estimates are subject to the following limitations. First, influenza vaccination status was based on self or parental report, was not validated with medical records, and thus is subject to respondent recall bias. Second, NIS and BRFSS are telephone-based surveys that do not include households without telephone service, and BRFSS data analyzed here do not include households with cellular telephone service only which may affect some geographic areas and racial/ethnic groups more than others (13). Third, response rates for both surveys were low and nonresponse bias may remain even after weighting adjustments. Fourth, combining NIS and BRFSS estimates allowed estimation of coverage for all persons =6 months; however, differences in survey methodology (e.g., different sampling frame, survey design, exact survey question wording, response rates and weighting) may result in different levels of bias that are averaged for this group. Fifth, the estimated number of persons vaccinated might be overestimated, as previous estimates resulted in higher numbers vaccinated than doses distributed (8). Finally, some age-by-state-specific estimates in the accompanying interactive reports (1) may be unreliable due to small sample size. The final estimates in these online reports are based on an additional three months or more of data collection compared to the interim results (2), and may differ from the interim estimates, particularly for estimates based on smaller sample sizes. Both final and interim estimates flagged as potentially unreliable should be interpreted with caution.
CDC. Prevention and control of influenza with vaccines: recommendations of the Advisory Committee on Immunization Practices (ACIP), 2010. MMWR 2010;59(No. RR-8).
Singleton, JA. Who got H1N1 vaccine? Findings from the U.S. 2009–2010 Influenza Vaccination Surveillance Systems. 44th National Immunization Conference. Atlanta, GA. Available at http://cdc.confex.com/cdc/nic2010/webprogram/Paper23190.html . Accessed June 3, 2011.
45th National Immunization Conference. FluText: Using Text Messaging to Promote Timely Flu Vaccination In An Underserved Child Population. Available at http://cdc.confex.com/cdc/nic2011/webprogram/Paper25438.html . Accessed September 9, 2011.
CDC. Use of Influenza A (H1N1) 2009 Monovalent Vaccine: Recommendations of the Advisory Committee on Immunization Practices (ACIP), 2009. MMWR 2009;58(RR-10):1–8.
* The CASRO response rate is the product of three other rates: 1) the resolution rate, which is the proportion of telephone numbers that can be identified as either for a business or residence; 2) the screening rate, which is the proportion of qualified households that complete the screening process; and 3) the cooperation rate, which is the proportion of contacted eligible households for which a completed interview is obtained.