Vital Signs: Disparities in Antihypertensive Medication Nonadherence Among Medicare Part D Beneficiaries — United States, 2014Weekly / September 16, 2016 / 65(36);967-976 Article MetricsViews equals page views plus PDF downloadsViews:Citations:Altmetric:Metric DetailsOn September 13, 2016, this report was posted online as an MMWR Early Release. Matthew Ritchey, DPT1; Anping Chang, MS, MPH1; Christopher Powers, PharmD2; Fleetwood Loustalot, PhD1; Linda Schieb, MSPH1; Michelle Ketcham, PharmD3; Jeffrey Durthaler, MS1; Yuling Hong, MD, PhD1 (View author affiliations) View suggested citationKey Points• Cardiovascular disease (heart disease and stroke) is the leading cause of death in the United States. • Hypertension, or high blood pressure, is a primary risk factor for heart disease and stroke, and approximately 70% of adults aged =65 years have the condition. Only about half of persons with high blood pressure have it under control (i.e., blood pressure <140/90 mm Hg). • Nonadherence, or not following a health care professional’s instructions concerning taking their prescribed blood pressure medicine, is a well-known reason for uncontrolled high blood pressure and an important risk factor for adverse cardiovascular disease outcomes and increased health care costs. • In this study, 26.3% (4.9 million) Medicare Part D beneficiaries aged =65 years using blood pressure medicine were considered nonadherent. • Different groups and geographic regions had a high proportion of beneficiaries classified as nonadherent. For example, 24.3% of whites, 26.3% of Asian/Pacific Islanders, 33.8% of Hispanics, 35.7% of blacks, and 38.8% of American Indians or Alaska Natives were classified as being nonadherent. In addition, socioeconomic status classifications showed differences, with 32.1% of persons with a low-income subsidy being classified as nonadherent, compared with 25.4% of persons with no subsidy. The highest nonadherence prevalence tended to occur in the southern United States. • Factors and opportunities were identified that could be addressed by prescribers, health systems, and payers to improve adherence, including, especially among older adults, simplifying their blood pressure medication regimen. • Additional information is available at http://www.cdc.gov/vitalsigns. AbstractIntroduction: Nonadherence to taking prescribed antihypertensive medication (antihypertensive) regimens has been identified as a leading cause of poor blood pressure control among persons with hypertension and an important risk factor for adverse cardiovascular disease outcomes. CDC and the Centers for Medicare and Medicaid Services analyzed geographic, racial-ethnic, and other disparities in nonadherence to antihypertensives among Medicare Part D beneficiaries in 2014. Methods: Antihypertensive nonadherence, defined as a proportion of days a beneficiary was covered with antihypertensives of <80%, was assessed using prescription drug claims data among Medicare Advantage or Medicare fee-for-service beneficiaries aged =65 years with Medicare Part D coverage during 2014 (N = 18.5 million). Analyses were stratified by antihypertensive class, beneficiaries’ state and county of residence, type of prescription drug plan, and treatment and demographic characteristics. Results: Overall, 26.3% (4.9 million) of Medicare Part D beneficiaries using antihypertensives were nonadherent to their regimen. Nonadherence differed by multiple factors, including medication class (range: 16.9% for angiotensin II receptor blockers to 28.9% for diuretics); race-ethnicity (24.3% for non-Hispanic whites, 26.3% for Asian/Pacific Islanders, 33.8% for Hispanics, 35.7% for blacks, and 38.8% for American Indians/Alaska Natives); and state of residence (range 18.7% for North Dakota to 33.7% for the District of Columbia). Considerable county-level variation in nonadherence was found; the highest nonadherence tended to occur in the southern United States (U.S. Census region nonadherence = 28.9% [South], 26.7% [West], 24.1% [Northeast], and 22.8% [Midwest]) Conclusions and Implications for Public Health Practice: More than one in four Medicare Part D beneficiaries using antihypertensives were nonadherent to their regimen, and certain racial/ethnic groups, states, and geographic areas were at increased risk for nonadherence. These findings can help inform focused interventions among these groups, which might improve blood pressure control and cardiovascular disease outcomes. IntroductionHypertension is a leading risk factor for cardiovascular disease (1). Use of prescribed antihypertensive medication (antihypertensives), in conjunction with diet and lifestyle modifications to lower blood pressure among persons with hypertension substantially decreases their risk for adverse cardiovascular disease outcomes (1,2). Approximately 70% of U.S. adults aged =65 years have hypertension, only about half of whom have their blood pressure controlled (i.e., <140/90 mm Hg) (3). Medication nonadherence, or not following a health care professional’s instructions concerning taking prescribed antihypertensives (e.g., take one tablet twice daily), is a leading reason for poor blood pressure control among persons treated for hypertension, a strong risk factor for adverse cardiovascular disease outcomes, and a cause of excessive health care costs (2,4). The reasons for nonadherence to chronic disease medications, including antihypertensives, are numerous and complex. They include factors involving the patients, their health care professionals, and the policies and procedures of health systems and payers (5). In 2006, the Centers for Medicare and Medicaid Services (CMS) implemented the Medicare Part D prescription drug benefit program,* a United States federal government program to subsidize the costs of prescription drugs and prescription drug insurance premiums for Medicare beneficiaries, which has increased the affordability and accessibility of prescription medications among U.S. adults aged =65 years and the disabled. The program has decreased out-of-pocket prescription medication spending by about $150 per year per beneficiary and increased medication use by a mean of one to three more prescriptions per year per beneficiary (6). In 2015, approximately 39 million beneficiaries were enrolled in Medicare Part D, 61% of whom were enrolled in stand-alone prescription drug plans (PDPs) that supplement Original Medicare† coverage and 39% of whom were enrolled in Medicare Advantage§ prescription drug (MA-PD) plans (7). The implementation of the Medicare Part D program has been associated with up to a 13.5% improvement in antihypertensive adherence among beneficiaries (8). However, antihypertensive nonadherence continues to pose a threat to this population’s health, especially among certain demographic groups (9). This study used the most currently available data to describe antihypertensive nonadherence among Medicare Part D beneficiaries, and assessed nonadherence stratified by multiple factors, including antihypertensive class and beneficiaries’ state and county of residence, type of prescription drug plan, and treatment and demographic characteristics, to help identify and inform targeted interventions among the groups and regions most at risk. MethodsAdministrative data and prescription drug event data for all Medicare Part D beneficiaries in 2014 were accessed via the CMS Chronic Conditions Data Warehouse.¶ Among 30.0 million beneficiaries aged =65 years as of January 1, 2014, 10.5 million were excluded from analysis, including 1.1 million who were long-term institutionalized residents (e.g., resided in nursing home); 0.9 million who did not have continuous enrollment in full fee-for-service (FFS) Medicare (i.e., Part A and Part B coverage within Original Medicare) with additional PDP coverage or in a MA-PD plan during January 1–December 31, 2014 or until their death in 2014; and 8.5 million who did not have at least one antihypertensive prescription filled in 2014, leaving 19.5 million beneficiaries for analysis. Analyses were limited to beneficiaries with two or more antihypertensive prescriptions filled (fills) within the same pharmacologic therapeutic class on different service dates within a measurement period of >90 days** (N = 18.5 million). Therapeutic classes were identified using the Uniform System of Classification†† schema and included the following: angiotensin converting enzyme inhibitors and angiotensin II receptor blockers, which were assessed individually and collectively with direct renin inhibitors as renin-angiotensin system antagonists; beta blockers; calcium channel blockers; diuretics; and other antihypertensives.§§ Nonadherence was measured using the proportion of days covered (PDC) metric (10), which represents the percentage of days a beneficiary had access to the prescribed medication from the date of the first antihypertensive fill through the end of 2014 or the beneficiary’s death in 2014.¶¶ To align with current standards, beneficiaries with a PDC <80% were considered nonadherent (10). Among beneficiaries taking multiple antihypertensives, overall PDC was calculated as an average of the PDCs calculated for each therapeutic class.*** Nonadherence was calculated by plan type, and in the FFS-PDP population, among beneficiaries with and without a diagnosis of hypertension (i.e., had or had not received an administrative billing code for hypertension†††). Factors assessed for relationship with nonadherence were age, sex, race/ethnicity, low-income subsidy status§§§ (which includes persons eligible for both Medicare and Medicaid), end-stage renal disease (ESRD) classification, initial entitlement eligibility designation (i.e., age =65 years or disability and/or ESRD), and whether any of the antihypertensives filled were for fixed-dose combinations (i.e., >1 antihypertensive within each pill). The maximum number of antihypertensive classes on hand at any one time was used as a proxy for blood pressure treatment intensity; the number of unique prescription medications used to treat any condition as a proxy for health status; the number of non-antihypertensive prescription medications filled as a proxy for overall medication burden; and the number of antihypertensive prescribers as a proxy for continuity of care for blood pressure management.¶¶¶ Descriptive analyses included calculating the mean annual total and out-of-pocket spending on antihypertensives per beneficiary and the percentage of overall beneficiary prescription medication spending attributed to antihypertensives. For antihypertensives, mean days’ supply per fill (i.e., the mean number of days a prescription fill would last based on the amount of medication supplied), percentage of fills with generic rather than brand-name medications, and the percentage of fills with fixed-dose combinations were calculated. Nonadherence was stratified by beneficiaries’ U.S. Census Region and state or territory of residence and mapped by county of residence using a spatial empirical Bayesian smoothing technique to enhance estimate stability. The data used in these analyses represent 100% of the beneficiaries who met the inclusion criteria; therefore, no statistical testing was needed to assess for differences among subgroups for the previously described variables. ResultsAmong the 18.5 million Medicare Part D beneficiaries who were prescribed antihypertensives, 4.9 million (26.3%) were nonadherent ( Table 1). Nonadherence varied by race (24.3% [whites], 26.3% [Asian/Pacific Islanders], 33.8% [Hispanics], 35.7% [blacks], 38.8% [American Indians/Alaska Natives]); low-income subsidy status (32.1% [low-income subsidy], 25.4% [no subsidy]); and reason for initial entitlement, which was highest (42.4%) among beneficiaries with disability and ESRD. Nonadherence was slightly higher among older age groups and when a second class of antihypertensive was added (27.2%) compared with a single class (23.2%), and was slightly lower among beneficiaries with any fixed-dose combination medication use (Table 1). Nonadherence increased with decreases in health status and as the number of antihypertensive prescribers increased. There was little relationship between the overall medication burden proxy or plan type (FFS-PDP versus MA-PD) and nonadherence. Nonadherence differed by medication class, ranging from 16.9% (angiotensin II receptor blockers) to 28.9% (diuretics); 20.4% of beneficiaries who were prescribed renin-angiotensin system antagonists, the medication category used in the CMS Part C and D Star Ratings Program,**** were nonadherent ( Table 2). At the state level, beneficiaries in North Dakota (18.7%), Wisconsin (18.8%), and Minnesota (18.9%) had the lowest nonadherence, and beneficiaries in Washington, D.C. (33.7%), Mississippi (32.8%), and Louisiana (31.5%) had the highest ( Table 3; Supplemental Figure 1 [https://stacks.cdc.gov/view/cdc/40807]). Nonadherence was higher in the U.S. territories of Puerto Rico (39.6%) and the Virgin Islands (46.9%) than within the states (range: 18.7%–33.7%). At the county level, considerable variation in nonadherence was found (range: 15.9% to 56.2%). The greatest nonadherence tended to occur in the southern United States (nonadherence, by U.S. Census region, of 28.9% for the South, 26.7% for the West, 24.1% for the Northeast, and 22.8% for the Midwest) ( Figure). In 2014, the 215.9 million antihypertensive fills accounted for almost $5.9 billion in total spending, of which $2.1 billion (35.6%) was borne by beneficiaries (Table 1). On average, per-person out-of-pocket spending for antihypertensives was about $92 per year, reflecting 18.4% of beneficiaries’ overall annual prescription medication spending. Total annual spending on antihypertensives differed by beneficiary characteristics (Table 1), medication class (Table 2), and beneficiary state of residence (Table 3). The highest mean annual total spending occurred among beneficiaries using a maximum of four or more antihypertensive classes at one time ($693 per year), using angiotensin II receptor blockers ($476 spending per year on that class alone), and living in New Jersey ($472 per year). Overall, 95.5% of antihypertensive fills were for generic formulations. Fixed-dose combination fills accounted for 8.9% of antihypertensive fills (Table 1), with thiazide diuretics, a specific type of diuretic, being the antihypertensive most often prescribed in combination (46.5% of fills) (Table 2). Mean days’ supply per fill was 53.9 days and varied by beneficiary characteristics (Table 1), including state of residence (Table 3). Conclusions and CommentsMore than one fourth of Medicare Part D beneficiaries aged =65 years were nonadherent to their antihypertensive regimen. Uncontrolled blood pressure is a main risk factor for the first and third leading causes of death (heart disease and stroke, respectively) among adults aged =65 years (1).†††† Although multiple factors contribute to the high proportion of uncontrolled blood pressure among persons in this age group (11), persons who are adherent to their antihypertensives are 45% more likely to achieve blood pressure control and have up to a 38% decreased risk for having a cardiovascular event compared with persons who are nonadherent (2,4). Several groups had higher antihypertensive nonadherence, including blacks and American Indians/Alaska Natives, who are also at higher risk for poor blood pressure control and cardiovascular morbidity and mortality compared with other racial and ethnic groups (1). Moreover, beneficiaries living in the southern United States had the highest nonadherence. These differences in nonadherence could play a role in persistent disparities in blood pressure control and cardiovascular disease outcomes in these groups and regions (1,12). Although still suboptimal, if the average nonadherence rate of 18.9% among Medicare Part D beneficiary populations in the three states with the lowest nonadherence rates (North Dakota, Wisconsin, and Minnesota) were to be achieved in all states, the national nonadherence rate would decrease by about one third, and 1.4 million more beneficiaries would be taking their antihypertensives as directed. Factors and opportunities have been identified that prescribers, health systems, and payers can address to improve medication adherence. For older adults, who are often taking multiple chronic disease medications (13), including 72% of beneficiaries in this study taking two or more antihypertensives, an important factor in improving adherence is simplification of the antihypertensive regimen. Some strategies include decreasing pill count through the use of fixed-dose combination medications (14,15), which were underused among most beneficiary groups in this study; limiting the number of pharmacy visits needed by increasing the days’ supply per fill (e.g., prescribing 90-day versus 30-day allotments), which had wide variability among beneficiary groups, and synchronizing fills for all medication (14); and using reminder devices and technology aids that encourage patients to follow their recommended medication schedule (16). These strategies can be implemented by health care teams that are using standardized hypertension treatment approaches to manage patients’ blood pressure (15). These teams might include physicians and physician assistants, nurses and nurse practitioners, pharmacists, and community health workers, and their collective work can help ensure patients’ medication regimens and adherence are regularly assessed and their blood pressure controlled. Coordinated care might help overcome the finding of increased nonadherence when patients have more prescribers managing their antihypertensive regimens. Additional interventions to improve adherence include engaging patients in medication regimen decision making using motivational counseling techniques and educating patients about the risks associated with uncontrolled blood pressure (17); encouraging the use of home blood pressure monitoring (18); maximizing use of generic medication (19); leveraging health information technologies that allow for e-prescribing, additional patient engagement, and clinical-decision support that informs prescribing decisions (15,16); and implementing payment reforms that decrease spending, such as limiting deductibles and copayments (20). Although annual out-of-pocket antihypertensive spending for most beneficiaries was low (around $100 per year), it represented almost one fifth of their total prescription medication spending and might be a barrier to adherence among certain groups. CMS has taken steps to decrease cost-sharing in the Medicare Part D coverage gap (i.e., ‘donut hole’, where beneficiaries who meet a specific spending threshold are responsible for a higher percentage of prescription medication spending) (21), which could reduce nonadherence. In addition, CMS has included medication adherence measures as part of the Part C and D Star Ratings Program to encourage health plans that participate in Medicare Part D to support improved adherence for specific medications, including antihypertensives. Plans achieve this through using interventions such as medication therapy management programs to review beneficiaries’ medication regimens and follow up with those who are nonadherent. The findings in this report are subject to at least six limitations. First, PDC assesses only the availability of medication and not the actual taking of medication. However, use of measures, like PDC, which rely on administrative data to assess nonadherence have typically correlated well with self-reported nonadherence, plasma medication levels, physiologic markers, and cardiovascular disease outcomes (2,22), and might better assess nonadherence among older adults than self-reported or other objective measures (22). Second, because the PDC calculation excludes patients with only one antihypertensive fill and does not include persons who are prescribed medication but never initiate treatment, it probably underestimates nonadherence. Approximately 300,000 beneficiaries in this study had only one filled prescription within a class; in general, up to one fourth of prescriptions for newly prescribed antihypertensives are never filled (23). Third, nonadherence might be overestimated among beneficiaries who switched antihypertensive classes based on their clinician’s recommendation (e.g., because of side effects) or sometimes directly purchased low-priced generic antihypertensives without involvement of their prescription drug plan, but were considered nonadherent. Fourth, periods when beneficiaries were hospitalized were not censored because hospitalization data were not available for beneficiaries with MA-PD plans; however, the effect of this on nonadherence rates is small based on earlier research and guidance (10). Fifth, proxy measures used here might not accurately reflect their intended purpose. For example, a higher number of antihypertensive prescribers per patient might indicate better team-based care rather than splintered care, and methodologies accounting for these increasingly popular models of care should be considered in future analyses. Finally, subpopulation comparisons were not adjusted for other factors and should be addressed in future studies. More than one fourth of Medicare Part D beneficiaries assessed were nonadherent to their antihypertensive therapy. This was the first study to identify considerable geographic variation in antihypertensive nonadherence at the county level. Although recognized as challenging, improving adherence to antihypertensives is an effective way to improve blood pressure control and reduce cardiovascular events in this population, which is already at high risk for having cardiovascular disease. This study identified multiple groups at increased risk for nonadherence and potentially modifiable risk factors. Strategies to improve adherence range from individual patient engagement and intervention to systematic health system changes, and coordinated approaches are important to improving adherence and the cardiovascular health of this population. AcknowledgmentsMary G. George and Soyoun Park, Division for Heart Disease and Stroke Prevention, CDC. Corresponding author: Matthew Ritchey, MRitchey@cdc.gov, 770-488-7232. 1Division for Heart Disease and Stroke Prevention, CDC; 2Office of Enterprise Data and Analytics, Centers for Medicare & Medicaid Services; 3Medicare Drug Benefit and C&D Data Group, Centers for Medicare & Medicaid Services. References
* The Medicare Part D prescription drug benefit program was established by the Medicare Modernization Act of 2003. This entitlement went into effect in 2006, and provides voluntary coverage to disabled and older adults (https://www.medicare.gov/part-d/). † Original Medicare is administered directly through the federal government and includes the potential to enroll in both Part A and Part B. If a drug benefit is desired, the beneficiary must buy separate coverage through a Prescription Drug Plan from a private insurance company. Typically, beneficiaries pay a monthly premium covering 25.5% of the cost of the benefit and the Medicare Trust Funds subsidizes the remaining 74.5% (https://www.medicare.gov/sign-up-change-plans/decide-how-to-get-medicare/original-medicare/how-original-medicare-works.html). § Medicare Advantage plans are sold by private insurance companies, but are subsidized by the Medicare Trust Funds. At a minimum, they must provide Part A and Part B coverage. Beneficiaries who also want a drug benefit, typically select a plan that provides both health and drug coverage, called a Medicare Advantage Prescription Drug Plan (https://www.medicare.gov/sign-up-change-plans/medicare-health-plans/medicare-advantage-plans/how-medicare-advantage-plans-work.html). ¶ The CMS Chronic Condition Warehouse was accessed via the CMS Virtual Research Data Center (https://www.ccwdata.org/web/guest/home). ** Reflects a standard recommended by the Pharmacy Quality Alliance and used by CMS to help ensure an adequate amount of time to effectively assess adherence among beneficiaries. †† IMS Uniform System of Classification is a standard for pharmaceutical product classification (https://www.imshealth.com/files/web/IMSH%20Institute/USC_Classiification_Process_2011.pdf. §§ Other antihypertensives include selective aldosterone receptor inhibitors, peripheral vasodilators, alpha blockers, and centrally acting agents. ¶¶ The PDC measure is endorsed by the National Quality Forum and is the preferred method of measuring medication adherence by the Pharmacy Quality Alliance. A PDC was calculated for each class for which a beneficiary met the inclusion criteria. If multiple prescriptions for the same target medication (i.e., same generic ingredient) were dispensed on different days such that the prescriptions overlapped, the start date for the new prescription accounted for the remaining medication from the previous fill. Days’ supply that extended beyond the end of the measurement period was not included in the PDC calculation. All analyses were performed using SAS Version 9.4 (SAS Institute Inc, Cary, North Carolina). See Supplemental Document 1 (https://stacks.cdc.gov/view/cdc/40808) for the SAS coding used to perform the analyses in this study. *** Beneficiaries’ overall PDC is the average of their PDCs for renin-angiotensin system antagonists, beta blockers, calcium channel blockers, diuretics, and other antihypertensives. If the average PDC is <80%, they are considered nonadherent for the combined use of all antihypertensives. ††† The definition CMS used to determine if a FFS-PDP beneficiary ever received an administrative billing code for hypertension while enrolled with FFS coverage can be found at https://www.ccwdata.org/web/guest/condition-categories. Hypertension status could not be determined among MA-PD beneficiaries. §§§ Beneficiaries who receive a low-income subsidy include those who are automatically deemed eligible, as well as those who apply and are determined eligible (https://www.cms.gov/Medicare/Eligibility-and-Enrollment/LowIncSubMedicarePresCov/index.html?redirect=/LowIncSubMedicarePresCov/03_MedicareLINET.asp). ¶¶¶ The maximum number of antihypertensive classes on hand at any one time in 2014 variable was grouped in three categories (one antihypertensive class, two antihypertensive classes, and three or more antihypertensive classes). The health status proxy describes the number of unique prescriptions filled, by generic medication name, and was grouped into quartiles with the fourth quartile representing beneficiaries with potentially the worst health status (i.e., taking the most unique types of medication). The overall medication burden proxy describes the number of non-antihypertensive prescription medications filled for in 2014, and was grouped into quartiles with the fourth quartile representing beneficiaries with the greatest medication burden (i.e., most number of fills per year). The continuity of care for blood pressure management proxy describes the number of unique antihypertensive prescribers in 2014, and was grouped into three categories (one antihypertensive prescriber, two antihypertensive prescribers, and three or more antihypertensive prescribers). The larger the number of unique prescribers the potentially less the continuity of care. **** The Medicare Part C and D Star Ratings Program includes a medication adherence measure for renin-angiotensin system antagonists medication based on the Pharmacy Quality Alliance measure specifications (https://www.cms.gov/Medicare/Prescription-Drug-Coverage/PrescriptionDrugCovGenIn/PerformanceData.html). See Supplemental Table 1 (https://stacks.cdc.gov/view/cdc/40806) for renin-angiotensin system antagonist nonadherence results by U.S. state and territory. †††† The leading cause of death among U.S. adults aged =65 years in 2014 was obtained from CDC WONDER Online Database (http://wonder.cdc.gov/ucd-icd10.html). Data are from the Multiple Cause of Death Files, 1999–2014, as compiled from data provided by the 57 vital statistics jurisdictions through the Vital Statistics Cooperative Program.
|
|||||||||||||||||||||||||||||||||||||||||||||||||||||||||||||||||||||||||||||||||||||||||||||||||||||||||||||||||||||||||||||||||||||||||||||||||||||||||||||||||||||||||||||||||||||||||||||||||||||||||||||||||||||||||||||||||||||||||||||||||||||||||||||||||||||||||||||||||||||||||||||||||||||||||||||||||||||||||||||||||||||||||||||||||||||||||||||||||||||||||||||||||||||||||||||||||||||||||||||||||||||||||||||||||||||||||||||||||||||||||||||||||||||||||||||||||||||||||||||||||||||||||||||||||||||||||||||||||||||||||||||||||||||||||||||||||||||||||||||||||||||||||||||||||||||||||||||||||||||||||||||||||||||||||||||||||||||||||||||||||||||||||||||||||||||||||||||||||||||||||||||||||||||||||||||||||||||||||||||||||||||||||||||||||||||||||||||||||||||||||||||||||||||||||||||||||||||||||||||||||||||||||||||||||||||||||||||||||||||||||||||||||||||||||||||||||||||||||||||||||||||||||||||||||||||||||||||||||||||||||||||||||||||||||||||||||||||||||||||||||||||||||||||||||||||||||||||||||||||||
| Category | No. beneficiaries | AHM fills | Annual AHM spending | Percent nonadherent* | ||||
|---|---|---|---|---|---|---|---|---|
| Total (millions) | Percent fixed-dose combinations | Mean days’ supply per fill | Total spending per beneficiary ($) | Out-of-pocket spending per beneficiary ($) | Percent of out-of-pocket spending attributed to AHM | |||
| Total | 18,500,811 | 215.9 | 8.9 | 53.9 | 318† | 92† | 18.4 | 26.3 |
| Sex | ||||||||
| Female | 11,019,771 | 131.4 | 9.4 | 52.4 | 333 | 91 | 18.9 | 26.7 |
| Male | 7,481,040 | 84.4 | 8.2 | 56.2 | 297 | 93 | 17.6 | 25.8 |
| Age | ||||||||
| 65–74 | 10,083,964 | 111.5 | 10.5 | 55.3 | 305 | 88 | 17.7 | 25.4 |
| 75–84 | 6,187,631 | 74.9 | 7.9 | 53.7 | 335 | 95 | 17.8 | 27.0 |
| =85 | 2,229,216 | 29.4 | 5.4 | 49.0 | 333 | 100 | 20.2 | 29.0 |
| Race/Ethnicity | ||||||||
| White, non-Hispanic | 14,302,318 | 160.1 | 8.4 | 56.0 | 309 | 100 | 17.8 | 24.3 |
| Black | 1,715,144 | 24.9 | 10.7 | 47.0 | 382 | 79 | 24.1 | 35.7 |
| Asian/Pacific Islander | 571,551 | 6.3 | 9.9 | 54.6 | 392 | 57 | 22.0 | 26.3 |
| American Indian/Alaska Native | 50,261 | 0.7 | 3.7 | 41.0 | 267 | 60 | 15.5 | 38.8 |
| Hispanic | 1,635,662 | 21.5 | 10.6 | 45.9 | 307 | 48 | 19.9 | 33.8 |
| Other | 143,919 | 1.6 | 9.5 | 56.1 | 353 | 83 | 20.1 | 26.5 |
| Unknown | 81,956 | 0.9 | 10.9 | 56.5 | 318 | 93 | 18.5 | 22.6 |
| Initial Medicare entitlement reason | ||||||||
| Age =65 | 16,575,264 | 189.3 | 9.2 | 54.7 | 318 | 95 | 18.8 | 25.7 |
| Disability | 1,900,602 | 26.2 | 7.1 | 48.0 | 320 | 66 | 14.0 | 32.0 |
| ESRD | 12,934 | 0.2 | 1.2 | 47.0 | 427 | 90 | 12.2 | 40.7 |
| Disability and ESRD | 12,011 | 0.2 | 1.0 | 44.8 | 440 | 84 | 12.8 | 42.4 |
| ESRD | ||||||||
| No | 18,369,467 | 213.8 | 9.0 | 54.0 | 318 | 92 | 18.4 | 26.1 |
| Yes | 131,344 | 2.1 | 0.9 | 43.4 | 392 | 80 | 12.6 | 55.9 |
| Income status | ||||||||
| Standard | 15,875,135 | 175.0 | 9.2 | 56.6 | 307 | 104 | 18.3 | 25.4 |
| LIS or Medicaid dual eligible | 2,625,676 | 40.8 | 7.8 | 42.3 | 386 | 19 | 19.4 | 32.1 |
| Fixed-dose combination use§ | ||||||||
| No | 14,951,894 | 175.6 | 0.0 | 53.9 | 282 | 86 | 17.0 | 27.0 |
| Yes | 3,548,917 | 40.2 | 47.9 | 53.8 | 469 | 118 | 24.7 | 23.4 |
| Maximum treatment intensity¶ | ||||||||
| 1 AHM | 5,170,222 | 29.1 | 0.1 | 55.7 | 141 | 47 | 11.1 | 23.3 |
| 2 AHMs | 6,610,125 | 66.3 | 11.4 | 55.0 | 264 | 81 | 16.9 | 27.2 |
| 3 AHMs | 4,667,463 | 73.1 | 10.5 | 53.6 | 427 | 121 | 21.9 | 27.9 |
| =4 AHMs | 2,053,001 | 47.4 | 8.6 | 51.6 | 693 | 173 | 27.4 | 27.8 |
| Health status proxy quartile** | ||||||||
| Quartile 1 | 5,498,142 | 45.6 | 13.9 | 59.3 | 234 | 79 | 32.4 | 21.8 |
| Quartile 2 | 4,465,520 | 48.5 | 9.7 | 56.8 | 299 | 94 | 21.4 | 23.8 |
| Quartile 3 | 4,345,870 | 55.3 | 7.8 | 53.9 | 344 | 100 | 16.7 | 27.0 |
| Quartile 4 | 4,191,279 | 66.6 | 5.9 | 48.2 | 422 | 99 | 12.2 | 34.4 |
| Medication burden proxy quartile†† | ||||||||
| Quartile 1 | 4,926,566 | 38.8 | 12.5 | 68.4 | 253 | 83 | 40.2 | 26.4 |
| Quartile 2 | 4,528,839 | 46.4 | 10.3 | 59.6 | 299 | 91 | 23.6 | 25.0 |
| Quartile 3 | 4,812,272 | 60.5 | 8.6 | 52.4 | 337 | 97 | 16.8 | 26.2 |
| Quartile 4 | 4,233,134 | 70.0 | 6.3 | 43.4 | 393 | 99 | 11.2 | 27.8 |
| Continuity of care for blood pressure management proxy§§ | ||||||||
| 1 prescriber | 11,082,496 | 109.8 | 11.1 | 57.1 | 285 | 85 | 18.4 | 22.7 |
| 2 prescribers | 4,961,460 | 63.3 | 7.8 | 52.6 | 340 | 98 | 18.3 | 29.4 |
| =3 prescribers | 2,456,855 | 42.8 | 4.8 | 47.5 | 423 | 113 | 18.4 | 36.8 |
| Prescription drug plan type | ||||||||
| FFS-PDP | 10,265,439 | 122.4 | 8.7 | 53.1 | 350 | 103 | 18.2 | 26.3 |
| MA-PD | 8,235,372 | 93.4 | 9.2 | 55.0 | 278 | 79 | 18.6 | 26.4 |
Abbreviations: AHM = antihypertensive medication; ESRD = end-stage renal disease; FFS-PDP = Medicare fee-for-service prescription drug plan; LIS = low-income subsidy; MA-PD = Medicare Advantage prescription drug plan.
*Nonadherence is defined as patients not following their health care professional’s instructions concerning taking their prescribed medication. Using the proportion of days covered methodology, beneficiaries were considered nonadherent if they had access to AHM for <80% of the days from the date of their first AHM fill through the end of 2014 or until their death in 2014.
† Amounts to $5.9 billion in total spending on AHM fills, including almost $2.1 billion in beneficiary out-of-pocket spending.
§ Filled for a fixed-dose AHM combination medication (i.e., has >1 AHM per pill) at any point during 2014.
¶ Maximum number of AHM classes on hand at any one time as a proxy for blood pressure treatment intensity.
** Based on the number of unique prescriptions filled, by generic medication name, in 2014 as a proxy for overall health status.
†† Based on the number of non-AHM prescription medications filled for in 2014 as a proxy for overall medication burden.
§§ Number of unique AHM prescribers in 2014 as a proxy for continuity of care for blood pressure management (i.e., the greater the number of unique prescribers the potentially less the continuity).
 Table 2. National antihypertensive medication nonadherence among Medicare Part D beneficiaries aged =65 years, by medication class and plan type, United States, 2014
| AHM class/Plan type | Beneficiaries | AHM fills | Annual AHM spending | Percent nonadherent† | |||||
|---|---|---|---|---|---|---|---|---|---|
| No. | Percent with diagnosis of hypertension* | Total (millions) | Percent generic | Percent fixed-dose combinations | Mean days’ supply per fill | Total spending per beneficiary ($) | Out-of-pocket spending per beneficiary ($) | ||
| ACEI | 7,410,281 | — | 42.0 | 99.8 | 18.1 | 57.1 | 82 | 30 | 18.5 |
| FFS-PDP | 3,932,634 | 98.2 | 22.7 | 99.8 | 18.7 | 56.3 | 84 | 34 | 18.2 |
| MA-PD | 3,477,647 | — | 19.4 | 99.9 | 19.4 | 58.0 | 80 | 26 | 18.9 |
| ARB | 4,890,687 | — | 29.7 | 78.4 | 32.4 | 53.6 | 476 | 98 | 16.9 |
| FFS-PDP | 2,790,168 | 99.0 | 17.0 | 74.3 | 32.7 | 53.7 | 543 | 114 | 16.7 |
| MA-PD | 2,100,519 | — | 12.7 | 84.0 | 31.9 | 53.5 | 389 | 78 | 17.2 |
| RASA§ | 12,819,640 | — | 73.5 | 90.7 | 24.2 | 55.4 | 236 | 57 | 20.4 |
| FFS-PDP | 7,010,872 | 98.5 | 40.7 | 88.6 | 24.2 | 54.9 | 271 | 66 | 20.2 |
| MA-PD | 5,808,768 | — | 32.8 | 93.4 | 24.2 | 55.9 | 194 | 45 | 20.6 |
| BB | 9,645,375 | — | 54.3 | 95.1 | 2.5 | 54.1 | 139 | 48 | 23.4 |
| FFS-PDP | 5,458,653 | 97.6 | 31.3 | 94.1 | 2.4 | 53.2 | 152 | 54 | 23.1 |
| MA-PD | 4,186,722 | — | 22.9 | 96.4 | 2.6 | 55.4 | 122 | 41 | 23.8 |
| CCB | 7,144,600 | — | 40.5 | 97.0 | 8.0 | 53.0 | 176 | 49 | 22.9 |
| FFS-PDP | 3,992,363 | 98.9 | 23.0 | 96.5 | 8.3 | 52.4 | 183 | 53 | 22.5 |
| MA-PD | 3,152,237 | — | 17.6 | 97.6 | 7.7 | 53.7 | 167 | 45 | 23.4 |
| Diuretic | 9,969,492 | — | 56.6 | 97.4 | 28.8 | 53.7 | 111 | 35 | 28.9 |
| FFS-PDP | 5,603,616 | 98.1 | 32.6 | 97.0 | 27.5 | 52.8 | 119 | 38 | 28.9 |
| MA-PD | 4,365,876 | — | 24.1 | 98.0 | 30.6 | 54.9 | 101 | 31 | 28.9 |
| TD¶ | 6,874,909 | — | 35.1 | 96.0 | 46.5 | 57.4 | 135 | 39 | 27.2 |
| FFS-PDP | 3,762,961 | 98.3 | 19.4 | 95.2 | 46.1 | 56.8 | 149 | 44 | 27.1 |
| MA-PD | 3,111,948 | — | 15.6 | 97.0 | 47.0 | 58.2 | 118 | 34 | 27.3 |
| Other AHM** | 1,847,807 | — | 10.4 | 99.8 | <0.1 | 50.5 | 170 | 42 | 35.9 |
| FFS-PDP | 985,786 | 97.7 | 5.7 | 99.7 | 0.1 | 48.8 | 184 | 44 | 36.5 |
| MA-PD | 862,021 | — | 4.7 | 99.9 | <0.1 | 52.7 | 153 | 40 | 35.1 |
Abbreviations: ACEI = angiotensin converting enzyme inhibitor; AHM = antihypertensive medication; ARB = angiotensin II receptor blocker; BB = beta blocker; CCB = calcium channel blocker; FFS-PDP = Medicare fee-for-service prescription drug plan; MA-PD = Medicare Advantage prescription drug plan; RASA = renin-angiotensin system antagonist; TD = thiazide diuretic.
* Diagnosed hypertension status was only available for beneficiaries with FFS-PDP coverage.
† Nonadherence is defined as patients not following their health care professional’s instructions concerning taking their prescribed medication. Using the proportion of days covered methodology, beneficiaries were considered nonadherent if they had access to AHM for <80% of the days from the date of their first AHM fill through the end of 2014 or until their death in 2014.
§ RASAs include ACEIs, ARBs, and direct renin inhibitors.
¶ Thiazide diuretics, which also include thiazide-like diuretics (e.g. chlorthalidone), are a type of diuretic and are commonly used as a first-line medication to treat hypertension.
** Other AHMs include selective aldosterone receptor inhibitors, peripheral vasodilators, alpha blockers, and centrally acting agents.
Table 3. Antihypertensive medication nonadherence among Medicare Part D beneficiaries aged =65 years, by state and territory, United States, 2014
| State/Territory | No. beneficiaries | AHM fills | Annual AHM spending | Percent nonadherent† | |||||
|---|---|---|---|---|---|---|---|---|---|
| Total (millions) | Mean maximum treatment intensity* | Percent fixed-dose combinations | Mean days’ supply per fill | Total spending per beneficiary ($) | Out-of-pocket spending per beneficiary ($) | Percent of out-of-pocket spending attributed to AHM | |||
| Alabama | 314,946 | 4.02 | 2.33 | 11.5 | 49.6 | 303 | 89 | 16.9 | 29.9 |
| Alaska | 12,929 | 0.19 | 2.17 | 5.7 | 41.0 | 370 | 97 | 19.6 | 29.0 |
| Arizona | 358,006 | 3.63 | 2.11 | 6.0 | 59.6 | 278 | 95 | 18.1 | 28.2 |
| Arkansas | 180,717 | 2.57 | 2.27 | 10.4 | 43.7 | 294 | 91 | 17.9 | 30.4 |
| California | 1,941,483 | 20.56 | 2.16 | 7.2 | 58.6 | 307 | 81 | 19.5 | 27.1 |
| Colorado | 223,556 | 2.20 | 2.04 | 7.7 | 59.3 | 242 | 94 | 17.9 | 26.3 |
| Connecticut | 218,472 | 2.31 | 2.15 | 8.3 | 59.2 | 392 | 104 | 21.7 | 23.1 |
| Delaware | 62,885 | 0.55 | 2.20 | 10.4 | 71.0 | 399 | 109 | 19.5 | 23.0 |
| DC | 18,920 | 0.25 | 2.35 | 8.6 | 48.5 | 395 | 83 | 23.9 | 33.7 |
| Florida | 1,424,739 | 16.33 | 2.23 | 8.7 | 55.0 | 304 | 78 | 17.1 | 27.7 |
| Georgia | 487,641 | 6.44 | 2.30 | 11.0 | 46.8 | 334 | 106 | 18.2 | 31.0 |
| Hawaii | 84,596 | 0.87 | 2.03 | 10.5 | 55.5 | 362 | 82 | 21.7 | 25.5 |
| Idaho | 81,219 | 0.87 | 2.12 | 8.0 | 57.0 | 263 | 91 | 17.3 | 25.2 |
| Illinois | 622,034 | 7.31 | 2.25 | 8.1 | 55.6 | 320 | 102 | 18.3 | 23.8 |
| Indiana | 404,132 | 4.56 | 2.27 | 9.9 | 57.5 | 318 | 112 | 18.2 | 23.9 |
| Iowa | 216,867 | 2.75 | 2.19 | 7.4 | 51.6 | 253 | 97 | 17.2 | 19.7 |
| Kansas | 167,235 | 2.06 | 2.18 | 8.7 | 50.9 | 284 | 101 | 16.4 | 25.0 |
| Kentucky | 290,743 | 3.95 | 2.30 | 8.7 | 47.9 | 328 | 102 | 18.1 | 27.7 |
| Louisiana | 272,341 | 3.89 | 2.38 | 10.8 | 45.1 | 381 | 101 | 18.6 | 31.5 |
| Maine | 93,689 | 0.92 | 2.11 | 4.2 | 64.9 | 266 | 66 | 18.1 | 20.7 |
| Maryland | 257,600 | 2.55 | 2.26 | 9.5 | 64.7 | 362 | 107 | 20.1 | 25.4 |
| Massachusetts | 369,603 | 4.49 | 2.14 | 3.8 | 53.7 | 297 | 85 | 19.4 | 21.9 |
| Michigan | 688,611 | 6.70 | 2.22 | 8.5 | 65.9 | 260 | 89 | 17.7 | 23.3 |
| Minnesota | 326,243 | 3.33 | 2.16 | 6.0 | 64.2 | 224 | 89 | 17.6 | 18.9 |
| Mississippi | 181,510 | 2.66 | 2.36 | 12.6 | 42.8 | 339 | 94 | 18.2 | 32.8 |
| Missouri | 389,448 | 5.02 | 2.22 | 7.4 | 49.8 | 296 | 92 | 17.3 | 25.3 |
| Montana | 55,376 | 0.63 | 2.10 | 6.8 | 54.1 | 242 | 87 | 16.5 | 23.3 |
| Nebraska | 108,367 | 1.49 | 2.20 | 8.7 | 46.4 | 302 | 111 | 17.9 | 22.6 |
| Nevada | 135,396 | 1.38 | 2.15 | 8.6 | 59.1 | 250 | 73 | 15.6 | 28.2 |
| New Hampshire | 66,971 | 0.71 | 2.10 | 5.2 | 60.4 | 285 | 99 | 18.6 | 20.5 |
| New Jersey | 532,767 | 5.49 | 2.22 | 11.2 | 60.5 | 472 | 117 | 21.5 | 25.3 |
| New Mexico | 103,182 | 1.06 | 2.08 | 7.0 | 56.9 | 261 | 77 | 17.9 | 29.8 |
| New York | 1,243,971 | 15.11 | 2.23 | 9.6 | 52.3 | 404 | 83 | 20.2 | 25.3 |
| North Carolina | 615,702 | 8.05 | 2.24 | 10.4 | 47.4 | 307 | 93 | 17.4 | 28.1 |
| North Dakota | 42,929 | 0.54 | 2.24 | 7.3 | 53.5 | 272 | 109 | 17.5 | 18.7 |
| Ohio | 807,252 | 9.16 | 2.24 | 8.9 | 56.8 | 297 | 99 | 18.5 | 23.9 |
| Oklahoma | 212,004 | 2.50 | 2.27 | 9.6 | 53.0 | 327 | 102 | 17.4 | 29.6 |
| Oregon | 246,556 | 2.69 | 2.10 | 5.3 | 57.0 | 242 | 88 | 17.5 | 23.9 |
| Pennsylvania | 934,545 | 11.72 | 2.17 | 8.5 | 49.7 | 352 | 102 | 19.1 | 24.0 |
| Puerto Rico | 290,517 | 4.72 | 2.27 | 13.5 | 35.3 | 256 | 48 | 21.6 | 39.6 |
| Rhode Island | 72,279 | 1.04 | 2.18 | 6.7 | 44.6 | 298 | 84 | 18.4 | 22.9 |
| South Carolina | 307,134 | 3.80 | 2.27 | 13.1 | 49.0 | 350 | 100 | 17.7 | 29.6 |
| South Dakota | 51,359 | 0.65 | 2.18 | 7.0 | 51.2 | 268 | 100 | 16.7 | 21.0 |
| Tennessee | 427,203 | 5.38 | 2.29 | 9.2 | 51.0 | 302 | 91 | 17.1 | 28.0 |
| Texas | 1,184,240 | 13.31 | 2.26 | 11.3 | 54.3 | 354 | 94 | 17.8 | 30.8 |
| USVI | 6,041 | 0.09 | 2.28 | 17.7 | 36.1 | 280 | 138 | 29.3 | 46.9 |
| Utah | 94,690 | 0.89 | 2.08 | 11.2 | 60.5 | 246 | 96 | 15.6 | 28.7 |
| Vermont | 38,691 | 0.40 | 2.07 | 4.9 | 62.4 | 272 | 83 | 19.6 | 19.1 |
| Virginia | 387,911 | 4.57 | 2.24 | 9.6 | 53.9 | 313 | 100 | 17.8 | 25.7 |
| Washington | 326,047 | 3.48 | 2.11 | 4.7 | 58.8 | 237 | 88 | 17.4 | 24.1 |
| West Virginia | 137,169 | 1.78 | 2.28 | 8.9 | 50.3 | 332 | 95 | 18.6 | 25.8 |
| Wisconsin | 348,628 | 3.85 | 2.19 | 6.9 | 59.9 | 274 | 98 | 18.4 | 18.8 |
| Wyoming | 26,660 | 0.30 | 2.12 | 7.9 | 54.4 | 283 | 107 | 17.6 | 25.5 |
Abbreviation: AHM = antihypertensive medication; DC = District of Columbia; USVI = U.S. Virgin Islands.
* Mean of the maximum number of AHM classes on hand at any one time per beneficiary; proxy for blood pressure treatment intensity.
† Nonadherence is defined as patients not following their health care professional’s instructions concerning taking their prescribed medication. Using the proportion of days covered methodology, beneficiaries were considered nonadherent if they had access to AHM for <80% of the days from the date of their first AHM fill through the end of 2014 or their death in 2014.
FIGURE. Antihypertensive medication nonadherence* among Medicare Part D beneficiaries aged =65 years, by county — United States, Puerto Rico, and U.S. Virgin Islands, 2014†
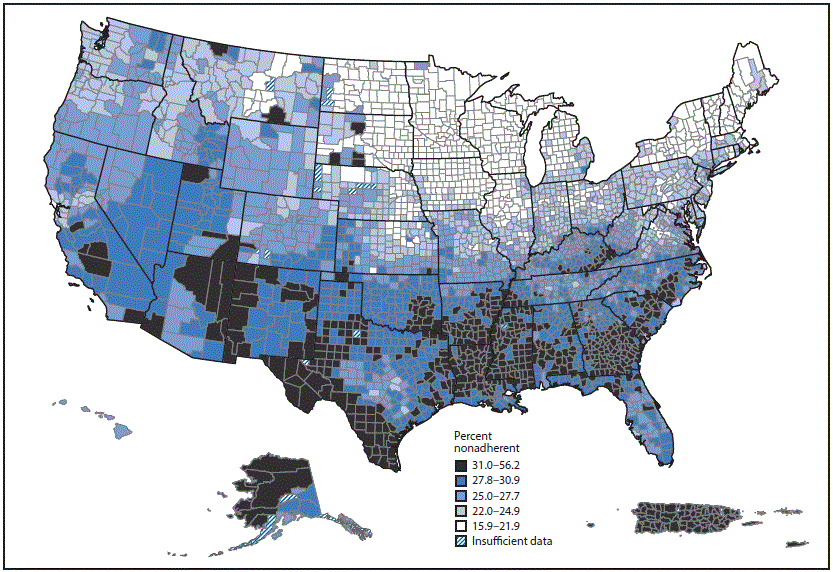
* Nonadherence is defined as patients not following their health care professional’s instructions concerning taking their prescribed medication. Using the proportion of days covered methodology, beneficiaries were considered nonadherent if they had access to antihypertensive medication for <80% of the days from the date of filling their first antihypertensive medication prescription through the end of 2014 or until their death in 2014.
† Additional maps of nonadherence by beneficiaries’ race/ethnicity and for renin-angiotensin system antagonists and diuretics are available on the Interactive Atlas for Heart Disease and Stroke at https://www.cdc.gov/dhdsp/maps/atlas/.
Suggested citation for this article: Ritchey M, Chang A, Powers C, et al. Vital Signs: Disparities in Antihypertensive Medication Nonadherence Among Medicare Part D Beneficiaries — United States, 2014. MMWR Morb Mortal Wkly Rep 2016;65:967-976. DOI: http://dx.doi.org/10.15585/mmwr.mm6536e1.
Use of trade names and commercial sources is for identification only and does not imply endorsement by the U.S. Department of Health and Human Services.
References to non-CDC sites on the Internet are provided as a service to MMWR readers and do not constitute or imply endorsement of these organizations or their programs by CDC or the U.S. Department of Health and Human Services. CDC is not responsible for the content of pages found at these sites. URL addresses listed in MMWR were current as of the date of publication.
All HTML versions of MMWR articles are generated from final proofs through an automated process. This conversion might result in character translation or format errors in the HTML version. Users are referred to the electronic PDF version (https://www.cdc.gov/mmwr) and/or the original MMWR paper copy for printable versions of official text, figures, and tables.
Questions or messages regarding errors in formatting should be addressed to mmwrq@cdc.gov.
Source URL: https://www.cdc.gov/mmwr/volumes/65/wr/mm6536e1.htm
Source Agency: Centers for Disease Control and Prevention (CDC)
Captured Date: 2016-09-14 00:14:02.0