Falls and Fall Injuries Among Adults Aged =65 Years — United States, 2014Weekly / September 23, 2016 / 65(37);993–998 Article MetricsViews equals page views plus PDF downloadsViews:Citations:Altmetric:Metric DetailsGwen Bergen, PhD1; Mark R. Stevens, MA, MSPH2; Elizabeth R. Burns, MPH1 (View author affiliations) View suggested citation and related materialsSummaryWhat is already known about this topic? Falls are the leading cause of fatal and nonfatal injuries among persons aged =65 years (older adults). What is added by this report? In 2014, 28.7% of older adults reported falling at least once in the preceding 12 months, resulting in an estimated 29.0 million falls. Of those who fell, 37.5% reported at least one fall that required medical treatment or restricted their activity for at least 1 day, resulting in an estimated 7.0 million fall injuries. What are the implications for public health practice? Although falls are common, approximately half of older adults who fall do not discuss it with their health care provider. However, older adult falls are largely preventable. Health care providers can play an important role in fall prevention by 1) screening older adults for fall risk, 2) reviewing and managing medications linked to falls, and 3) recommending vitamin D where appropriate for improved bone, muscle, and nerve health. Falls are the leading cause of fatal and nonfatal injuries among adults aged =65 years (older adults). During 2014, approximately 27,000 older adults died because of falls; 2.8 million were treated in emergency departments for fall-related injuries, and approximately 800,000 of these patients were subsequently hospitalized.* To estimate the numbers, percentages, and rates of falls and fall injuries among older adults by selected characteristics and state, CDC analyzed data from the 2014 Behavioral Risk Factor Surveillance System (BRFSS) survey. In 2014, 28.7% of older adults reported falling; the estimated 29.0 million falls resulted in 7.0 million injuries. Known effective strategies for reducing the number of older adult falls include a multifactorial clinical approach (e.g., gait and balance assessment, strength and balance exercises, and medication review). Health care providers can play an important role in fall prevention by screening older adults for fall risk, reviewing and managing medications linked to falls, and recommending vitamin D supplements to improve bone, muscle, and nerve health and reduce the risk for falls. BRFSS is an annual, random-digit–dialed telephone survey of the noninstitutionalized U.S. civilian population aged =18 years conducted annually in all 50 states, the District of Columbia, Guam, Puerto Rico, and the U.S. Virgin Islands. Detailed information regarding the survey is available online.† The median response rate for 2014 was 47.0%. In 2014, survey respondents were asked, “In the past 12 months, how many times have you fallen?” If the response was one or more times, they were asked, “How many of these falls caused an injury? By an injury, we mean the fall caused you to limit your regular activities for at least a day or to go see a doctor.” This analysis was limited to adults aged =65 years in all 50 states and the District of Columbia who were asked the questions about falls. The first question was used to estimate the percentage of older adults who reported one or more falls and the total number of falls; the second question was used to estimate the number of fall injuries. Response options ranged from zero to 76 or more with reported means of 0.67 falls and 0.16 fall injuries. The percentages and numbers of falls and fall injuries included all adults aged =65 years in the denominator. Adults with responses of “Don’t know/Not sure,” “Refused,” or “Not asked or missing” for questions about falls, fall injuries, or demographic characteristics were excluded, reducing the sample to 147,319 adults.§ The percentages and numbers were compared across the following subgroups: sex, age group, race/ethnicity, marital status, education, annual household income, health status, and state of residence. Orthogonal polynomial contrasts and pairwise t-tests were used to identify significant increases or decreases where appropriate. The 2014 BRFSS data were weighted by iterative proportional fitting (raking) to represent state-level population estimates and aggregated to represent a nationwide estimate.¶ All results presented are weighted. Analyses were conducted using statistical software to account for the complex sampling design. In 2014, 28.7% of older adults reported falling at least once in the preceding 12 months, resulting in an estimated 29.0 million falls (Table 1). Of those who fell, 37.5% reported at least one fall that required medical treatment or restricted activity for at least 1 day, resulting in 7.0 million fall injuries. Women (30.3%) were more likely to report falling than men (26.5%) (p<0.01) and were more likely to report a fall injury (12.6% compared with 8.3%; p<0.01). The percentage of older adults who fell increased with age (p<0.01), from 26.7% among persons aged 65–74 years, to 29.8% among persons aged 75–84 years, to 36.5% among persons aged =85 years. The percentage of older adults who fell was higher among whites (29.6%) and American Indian/Alaska Natives (AI/ANs) (34.2%) than among blacks (23.1%) and Asian/Pacific Islanders (19.8%). The percentage of older adults who reported a fall injury also increased with age (p<0.01), from 9.9% among persons aged 65–74 years to 11.4% among persons aged 75–84 years, to 13.5% among persons aged =85 years. AI/ANs were more likely to report a fall-related injury (16.8%) than were whites (10.9%), Hispanics (10.7%), and blacks (7.8%). The rate of fall-related injuries was significantly higher in the population reporting poor health (480 per 1,000) than the population reporting excellent health (69 per 1,000). Among states and the District of Columbia, the percentage of older adults who reported a fall ranged from 20.8% in Hawaii to 34.3% in Arkansas. Several states had either significantly higher or lower percentages of reported falls among older adults compared with the national average (Figure) (Table 2). The percentage of older adults experiencing fall injuries ranged from 7.0% in Hawaii to 12.9% in Missouri. DiscussionIn 2014, 28.7% of older adults in the United States reported an estimated 29.0 million falls in the preceding 12 months. Older adult falls can result in death, serious injury, and loss of independence (1,2). This analysis found that an estimated 7 million falls required medical treatment or caused restricted activity for at least 1 day. Women and those in older age groups were at higher risk for falling and being injured in a fall. Reduced muscle strength is a risk factor for falls, and aging and female sex are associated with reduced muscle mass (1,2). Women have been found to be more likely to report falls than men (3). Aging also is associated with changes in gait and balance, increased inactivity, more severe chronic conditions, and more prescription medication use, all of which are risk factors for falls (1). Limited research exists on the causes for racial/ethnic differences, but these differences might be related to differences in health and behavior (4,5). Reasons for state differences are unknown; however, even in Hawaii, the state with the lowest incidence, 20.8% of older adults reported a fall. Annual Medicare costs for older adult falls have been estimated at $31.3 billion (6), and the older adult population is expected to increase 55% by 2030.** Applying the number of falls from this analysis to the projected 2030 population would result in an estimated 48.8 million falls and 11.9 million fall injuries, unless effective interventions are implemented nationwide. The findings in this report are subject to at least four limitations. First, BRFSS data are self-reported and subject to recall bias. Second, BRFSS does not include persons in long-term care facilities who are at higher risk for falls (7). Third, the broad definition of fall injury for this analysis might have resulted in a higher estimate of injurious falls compared with other reports. Finally, the response rate (median = 47%) could have resulted in nonresponse bias; however, weighting and survey methodology are used to adjust the estimates and reduce the effect of nonresponse bias. Older adult falls are largely preventable, and health care providers (e.g., physicians, nurses, nurse practitioners, physician assistants, pharmacists, physical therapists, and occupational therapists) can play an important part by discussing falls with older adult patients and providing appropriate interventions (8). The American and British Geriatrics Societies (AGS/BGS) Clinical Practice Guideline recommends that health care providers use a multifactorial approach to prevent falls that includes activities such as asking about falls, assessing gait and balance, reviewing medications, and prescribing interventions such as strength and balance exercises, or taking vitamin D.†† This type of approach has been estimated to be capable of reducing falls by 24% (8). Based on the AGS/BGS guidelines, CDC has developed the STEADI (Stopping Elderly Accidents, Deaths, and Injuries) initiative§§ to provide resources to help health care providers incorporate fall prevention into primary care (3). STEADI stresses three initial steps that can be completed in one patient visit: 1) ask patients if they have fallen in the past year, feel unsteady, or worry about falling; 2) review medications and stop, switch, or reduce the dosage of drugs that increase fall risk; and 3) recommend daily vitamin D supplementation for improved bone, muscle, and nerve health (with dosage of vitamin D and decision on whether to co-supplement with calcium to be determined based on the patient’s history). Health care providers should discuss fall prevention with their patients because approximately half of older adults who fall do not discuss it with their health care provider, often because they fear this will lead to a loss of independence (9). Health care providers cite limited time and cost as barriers to incorporating preventive services, such as those proposed by STEADI, into their clinical practice (10). However, the Centers for Medicare & Medicaid Services (CMS) now provides incentives for health care providers to conduct fall prevention activities through payment and delivery reforms (e.g., Welcome to Medicare Visit, Medicare Annual Wellness Visit, and the Medicare Shared Savings Accountable Care Organization Program).¶¶ CMS also links health care provider incentives to fall prevention quality measures through the Physician Quality Reporting System (PQRS) in the Merit-Based Incentive Program. PQRS includes two quality measures for falls: Falls Risk Assessment and Falls Plan of Care.*** Mechanisms such as payment and delivery reforms and quality reporting measures are opportunities to make fall prevention a routine part of clinical practice and reduce the barriers to providing services that can prevent falls among older adults. AcknowledgmentsSusan Dugan, Hilary Eiring, MPH, Robin Lee, PhD, Judy A. Stevens, PhD, National Center for Injury Prevention and Control, CDC. Corresponding author: Gwen Bergen, gbergen@cdc.gov, 770-488-1394. 1Division of Unintentional Injury, National Center for Injury Prevention and Control, CDC; 2Division of Analysis, Research and Practice Integration, National Center for Injury Prevention and Control, CDC. References
|
||||||||||||||||||||||||||||||||||||||||||||||||||||||||||||||||||||||||||||||||||||||||||||||||||||||||||||||||||||||||||||||||||||||||||||||||||||||||||||||||||||||||||||||||||||||||||||||||||||||||||||||||||||||||||||||||||||||||||||||||||||||||||||||||||||||||||||||||||||||||||||||||||||||||||||||||||||||||||||||||||||||||||||||||||||||||||||||||||||||||||||||||||||||||||||||||||||||||||||||||||||||||||||||||||||||||||||||||||||||||||||||||||||||||||||||||||||||||||||||||||||||||||||||||||||||||||||||||||||||||||||||||||||||||||||||||||||||||||||||||||||||||||||||||||||||||||||||||||||||||||||||||||||||||||||||||||||||||||||||||||||||||||||||||||||||||||||||||||||||||||||||||||||||||||||||||||||||||||||||||||||||||||||||||||||||||||||||||||||||||||||||||||||||||||||||||||||||||||||||||||||||||||||||||||||||||||||||||||||||||||||||||
| Characteristic | No. reporting a fall§ | % (95% CI) | No. of falls reported (millions) | Rate¶ (95% CI) | No. reporting a fall injury | % (95% CI) | No. of fall injuries reported (millions) | Rate** (95% CI) |
|---|---|---|---|---|---|---|---|---|
| Overall | 43,958 | 28.7 (28.2–29.1) | 29.0 | 672 (648–695) | 16,083 | 10.7 (10.4–11.0) | 7.0 | 164 (156–171) |
| Sex | ||||||||
| Men | 15,668 | 26.5 (25.8–27.2) | 12.4 | 657 (620–694) | 4,731 | 8.3 (7.9–8.8) | 2.4 | 127 (118–136) |
| Women | 28,290 | 30.3 (29.7–31.0) | 16.5 | 683 (653–714) | 11,352 | 12.6 (12.1–13.0) | 4.6 | 192 (181–203) |
| Age group (yrs) | ||||||||
| 65–74 | 23,859 | 26.7 (26.2–27.3) | 16.2 | 650 (619–680) | 8,650 | 9.9 (9.5–10.3) | 3.8 | 154 (146–163) |
| 75–84 | 14,379 | 29.8 (29.0–30.7) | 9.5 | 669 (634–703) | 5,267 | 11.4 (10.8–12.1) | 2.4 | 170 (155–185) |
| =85 | 5,720 | 36.5 (35.0–38.0) | 3.3 | 820 (705–935) | 2,166 | 13.5 (12.4–14.6) | 0.8 | 199 (172–226) |
| Race/Ethnicity | ||||||||
| White | 38,180 | 29.6 (29.1–30.0) | 23.3 | 683 (661–706) | 13,869 | 10.9 (10.6–11.2) | 5.6 | 163 (156–170) |
| Black | 2,204 | 23.1 (21.5–24.8) | 1.8 | 487 (432–542) | 795 | 7.8 (6.9–8.8) | 0.4 | 115 (93–137) |
| American Indian/Alaska Native | 542 | 34.2 (29.6–39.2) | 0.4 | 1,322 (838–1,805) | 234 | 16.8 (13.0–21.3) | 0.1 | 441 (233–649) |
| Asian/Pacific Islander | 271 | 19.8 (14.0–27.1) | —†† | — | — | — | — | — |
| Hispanic | 1,191 | 26.4 (23.8–29.2) | 1.8 | 655 (483–827) | 489 | 10.7 (9.0–12.7) | 0.4 | 164 (132–196) |
| Multiple/Other | 844 | 33.5 (29.5–37.8) | 0.5 | 971 (734–1,208) | 340 | 15.4 (12.5–18.7) | 0.2 | 314 (171–456) |
| Marital status | ||||||||
| Married | 19,241 | 26.2 (25.6–26.8) | 14.2 | 597 (570–624) | 6,491 | 9.3 (8.9–9.8) | 3.3 | 140 (129–150) |
| Divorced | 6,582 | 32.7 (31.3–34.1) | 4.3 | 825 (741–908) | 2,613 | 13.3 (12.3–14.4) | 1.1 | 209 (190–229) |
| Widowed | 15,062 | 31.7 (30.9–32.6) | 8.0 | 703 (669–736) | 5,858 | 12.2 (11.6–12.8) | 2.1 | 182 (169–194) |
| Separated | 491 | 30.2 (25.5–35.3) | 0.5 | 928 (709–1,148) | 208 | 12.8 (9.8–16.4) | 0.1 | 275 (172–378) |
| Never married | 2,116 | 29.6 (27.3–31.9) | 1.3 | 813 (641–986) | 743 | 10.7 (9.4–12.3) | 0.3 | 177 (136–218) |
| Member of unmarried couple | 318 | 32.8 (26.5–39.8) | — | — | — | — | 0.1 | 291 (138–445) |
| Education | ||||||||
| Less than high school graduate | 4,439 | 30.2 (28.7–31.7) | 5.6 | 810 (724–896) | 1,728 | 11.9 (10.9–12.9) | 1.3 | 193 (172–215) |
| High school graduate | 13,317 | 27.2 (26.5–28.0) | 8.1 | 600 (572–628) | 4,856 | 9.9 (9.4–10.4) | 1.9 | 143 (134–152) |
| Some college | 11,614 | 29.9 (29.0–30.9) | 8.9 | 721 (669–772) | 4,438 | 11.9 (11.1–12.6) | 2.3 | 189 (171–207) |
| College graduate or more | 14,460 | 28.1 (27.3–28.8) | 6.2 | 607 (577–636) | 5,005 | 9.6 (9.1–10.1) | 1.4 | 139 (129–149) |
| Annual household income ($) | ||||||||
| <15,000 | 4,832 | 34.9 (33.1–36.7) | 4.0 | 987 (893–1,080) | 2,119 | 15.1 (13.8–16.5) | 1.1 | 277 (243–312) |
| 15,000–24,999 | 8,726 | 30.7 (29.6–31.8) | 6.2 | 802 (746–858) | 3,438 | 12.3 (11.6–13.1) | 1.5 | 198 (181–216) |
| 25,000–34,999 | 5,480 | 30.2 (28.9–31.6) | 3.5 | 665 (619–712) | 1,920 | 10.6 (9.8–11.5) | 0.8 | 157 (139–175) |
| 35,000–49,999 | 6,054 | 28.0 (26.9–29.2) | 3.9 | 647 (592–702) | 2,084 | 10.0 (9.2–10.9) | 0.9 | 145 (130–160) |
| 50,000–74,999 | 5,007 | 26.1 (24.9–27.3) | 3.1 | 587 (511–663) | 1,728 | 9.4 (8.6–10.2) | 0.7 | 129 (116–143) |
| =75,000 | 5,911 | 24.8 (23.7–25.9) | 3.7 | 532 (461–604) | 1,885 | 8.6 (7.8–9.4) | 0.8 | 119 (104–134) |
| Health status | ||||||||
| Excellent | 3,922 | 19.2 (18.1–20.3) | 1.8 | 340 (307–374) | 1,136 | 5.9 (5.2–6.6) | 0.4 | 69 (60–77) |
| Very good | 11,089 | 23.7 (22.9–24.4) | 5.7 | 457 (410–505) | 3,479 | 7.9 (7.4–8.4) | 1.2 | 101 (92–109) |
| Good | 14,481 | 28.3 (27.4–29.1) | 8.3 | 578 (547–608) | 5,055 | 10.1 (9.5–10.7) | 2.0 | 138 (125–151) |
| Fair | 9,285 | 36.7 (35.5–37.9) | 7.4 | 979 (918–1,040) | 3,883 | 15.3 (14.4–16.2) | 1.9 | 253 (232–275) |
| Poor | 4,936 | 47.3 (45.3–49.3) | 5.5 | 1771 (1,619–1,923) | 2,440 | 22.1 (20.6–23.6) | 1.5 | 480 (430–530) |
Abbreviation: CI = confidence interval.
* Number of falls in the preceding 12 months.
† An injury caused by a fall in the preceding 12 months that caused respondents to limit their regular activities for =1 days or to go see a doctor.
§ Unweighted number of older adults reporting a fall. Because of varying question-specific nonresponse, sample sizes vary among questions.
¶ Number of falls per 1,000 adults aged =65 years.
** Number of fall injuries per 1,000 adults aged =65 years.
†† Sample size <50 or relative standard error >30%.
 FIGURE. Percentages of falls and fall injuries* in the preceding 12 months reported by adults aged =65 years (N = 147,319) — Behavioral Risk Factor Surveillance System, United States, 2014
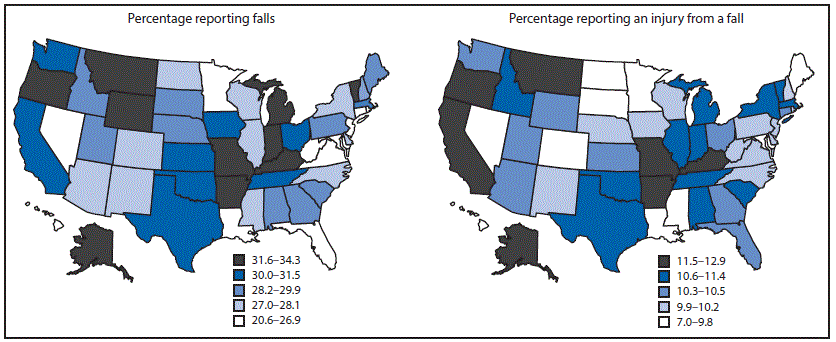
* Injuries resulting from falls that caused respondents to limit their regular activities for =1 days or to go see a doctor.
TABLE 2. Percentages and rates* of falls and fall injuries† in the preceding 12 months reported by adults aged =65 years (N = 147,319), by states ranked by percentage of older adults reporting =1 fall — Behavioral Risk Factor Surveillance System, United States, 2014
| State | No. reporting a fall§ | % (95% CI) | No. of falls reported (thousands) | Rate¶ (95% CI) | No. reporting a fall injury | % (95% CI) | No. of fall injuries reported (thousands) | Rate** (95% CI) |
|---|---|---|---|---|---|---|---|---|
| Overall | 43,958 | 28.7 (28.2–29.1) | 29,000 | 672 (648–695) | 16,083 | 10.7 (10.4–11.0) | 7,000 | 164 (156–171) |
| Arkansas | 727 | 34.3 (31.6–37.0)†† | 377 | 868 (725–1011)†† | 275 | 11.5 (9.9–13.4) | 79 | 183 (148–218) |
| Alaska | 324 | 32.9 (29.0–37.0)†† | 65 | 940 (683–1197)†† | 114 | 11.9 (9.4–15.0) | 12 | 178 (128–227) |
| Michigan | 901 | 32.6 (30.5–34.8)†† | 1,216 | 810 (671–949) | 323 | 11.4 (10.0–13.0) | 265 | 177 (137–217) |
| Missouri | 865 | 32.4 (29.9–35.0)†† | 741 | 823 (639–1008) | 326 | 12.9 (11.2–14.9)†† | 187 | 208 (150–266) |
| Montana | 908 | 32.2 (29.7–34.7)†† | 137 | 824 (670–977) | 351 | 12.1 (10.5–13.9) | 27 | 163 (139–187) |
| Kentucky | 1,174 | 32.1 (29.7–34.6)†† | 473 | 770 (660–880) | 445 | 11.9 (10.3–13.6) | 108 | 176 (145–208) |
| Wyoming | 836 | 32.1 (29.7–34.5)†† | 65 | 831 (668–994) | 276 | 10.5 (9.1–12.2) | 15 | 196 (122–270) |
| Indiana | 1,272 | 31.8 (29.9–33.7) †† | 685 | 762 (659–864) | 441 | 11.0 (9.8–12.3) | 156 | 174 (142–207) |
| Oregon | 626 | 31.8 (29.4–34.4)†† | 495 | 822 (684–960)†† | 251 | 12.3 (10.6–14.2) | 145 | 241 (125–357) |
| Vermont | 561 | 31.7 (29.2–34.3)†† | 78 | 777 (646–909) | 197 | 11.1 (9.5–12.9) | 15 | 151 (126–177) |
| Iowa | 887 | 31.5 (29.5–33.7) †† | 322 | 686 (604–767) | 289 | 9.9 (8.7–11.3) | 70 | 149 (118–179) |
| Washington | 1,120 | 31.2 (29.3–33.2)†† | 813 | 840 (652–1028) | 406 | 10.5 (9.3–11.8) | 150 | 155 (131–179) |
| Oklahoma | 920 | 30.9 (28.9–32.9)†† | 488 | 891 (706–1075)†† | 322 | 11.1 (9.9–12.6) | 120 | 219 (122–315) |
| California | 613 | 30.7 (28.0–33.5) | 3,134 | 801 (631–970) | 225 | 12.4 (10.4–14.8) | 807 | 207 (156–257) |
| Kansas | 1,321 | 30.5 (28.9–32.0)†† | 292 | 735 (619–851) | 455 | 10.4 (9.4–11.4) | 76 | 191 (106–275) |
| Texas | 1,504 | 30.2 (27.9–32.7) | 1,906 | 654 (563–745) | 551 | 11.4 (9.9–13.2) | 476 | 164 (136–191) |
| Tennessee | 600 | 30.1 (27.5–32.8) | 685 | 737 (614–860) | 213 | 11.4 (9.6–13.4) | 166 | 179 (131–228) |
| Ohio | 1,209 | 30.1 (28.0–32.3) | 1,210 | 688 (610–767) | 452 | 10.4 (9.1–11.9) | 259 | 147 (124–171) |
| District of Columbia | 427 | 30.1 (26.9–33.4) | 51 | 687 (548–826) | 155 | 11.7 (9.5–14.3) | 13 | 175 (121–230) |
| Maine | 1,014 | 29.9 (27.9–31.9) | 195 | 836 (640–1032) | 327 | 9.3 (8.1–10.5)§§ | 35 | 151 (116–185) |
| Idaho | 586 | 29.9 (27.2–32.8) | 154 | 697 (600–794) | 201 | 10.6 (8.8–12.7) | 37 | 170 (131–209) |
| Utah | 1,049 | 29.6 (27.8–31.6) | 192 | 668 (591–744) | 383 | 10.5 (9.3–11.8) | 43 | 149 (126–172) |
| Alabama | 925 | 29.4 (27.3–31.6) | 524 | 733 (630–836) | 342 | 10.7 (9.4–12.3) | 121 | 170 (134–206) |
| South Carolina | 1,097 | 29.2 (27.4–31.1) | 553 | 749 (623–874) | 431 | 11.4 (10.2–12.8) | 155 | 211 (140–281) |
| Massachusetts | 1,591 | 28.6 (26.8–30.5) | 588 | 611 (532–689) | 613 | 10.6 (9.5–11.9) | 146 | 152 (127–177) |
| Pennsylvania | 1,083 | 28.6 (26.7–30.5) | 1,208 | 588 (524–651)§§ | 380 | 9.9 (8.7–11.2) | 271 | 132 (114–151)§§ |
| Georgia | 615 | 28.6 (26.2–31.1) | 769 | 649 (560–738) | 227 | 10.5 (8.9–12.2) | 190 | 160 (124–196) |
| South Dakota | 720 | 28.5 (25.6–31.6) | 74 | 577 (473–681) | 242 | 9.7 (8.0–11.8) | 18 | 143 (103–183) |
| Nebraska | 2,235 | 28.2 (26.8–29.6) | 187 | 701 (614–789) | 751 | 9.9 (9.0–10.9) | 39 | 146 (120–172) |
| Delaware | 441 | 28.1 (25.4–31.0) | 97 | 660 (495–826) | 160 | 10.0 (8.3–12.0) | 21 | 143 (112–175) |
| Mississippi | 457 | 28.1 (25.3–31.0) | 282 | 674 (526–822) | 163 | 8.9 (7.4–10.6)§§ | 55 | 133 (98–167) |
| North Carolina | 642 | 28.0 (25.9–30.2) | 868 | 616 (543–688) | 234 | 10.0 (8.7–11.6) | 237 | 168 (132–205) |
| New Hampshire | 619 | 28.0 (25.5–30.6) | 131 | 649 (530–768) | 228 | 9.6 (8.2–11.3) | 33 | 162 (108–217) |
| New Mexico | 828 | 27.8 (25.5–30.2) | 190 | 661 (567–755) | 294 | 10.2 (8.7–11.9) | 46 | 158 (125–192) |
| Wisconsin | 505 | 27.8 (24.9–30.9) | 496 | 690 (470–911) | 192 | 10.1 (8.3–12.2) | 104 | 145 (111–179) |
| New York | 547 | 27.7 (25.2–30.3) | 1,598 | 584 (507–661)§§ | 205 | 10.7 (9.1–12.6) | 422 | 154 (126–183) |
| Arizona | 1,722 | 27.5 (26.0–29.1) | 676 | 707 (591–824) | 677 | 10.4 (9.4–11.5) | 142 | 148 (130–167) |
| Illinois | 457 | 27.4 (24.7–30.3) | 1,058 | 610 (485–736) | 178 | 11.1 (9.3–13.2) | 277 | 160 (125–195) |
| North Dakota | 732 | 27.2 (24.8–29.7) | 71 | 677 (539–815) | 264 | 9.5 (8.1–11.2) | 15 | 145 (101–188) |
| Colorado | 1,107 | 27.1 (25.4–28.8) | 374 | 601 (515–688) | 395 | 9.4 (8.4–10.5)§§ | 85 | 137 (115–158)§§ |
| Nevada | 386 | 26.9 (23.6–30.5) | 233 | 605 (475–735) | 141 | 9.8 (7.8–12.2) | 76 | 198 (124–272) |
| Rhode Island | 550 | 26.8 (24.4–29.3) | 90 | 566 (457–674) | 219 | 10.2 (8.6–12.0) | 24 | 150 (113–186) |
| West Virginia | 536 | 26.6 (24.4–28.9) | 208 | 642 (533–751) | 206 | 9.9 (8.5–11.6) | 48 | 149 (121–177) |
| Connecticut | 661 | 26.5 (24.2–29.0) | 263 | 496 (425–567)§§ | 266 | 10.3 (8.8–12.1) | 79 | 149 (117–182) |
| Minnesota | 1,185 | 26.1 (24.5–27.6)§§ | 448 | 591 (514–669) | 415 | 9.0 (8.0–10.1)§§ | 105 | 139 (114–164) |
| Virginia | 700 | 25.6 (23.5–27.8)§§ | 602 | 534 (468–600)§§ | 265 | 9.9 (8.5–11.4) | 154 | 137 (112–162)§§ |
| Florida | 1,060 | 25.1 (23.4–26.9)§§ | 2,087 | 599 (513–686) | 440 | 10.4 (9.3–11.7) | 526 | 151 (129–174) |
| Maryland | 1,179 | 25.1 (23.1–27.2)§§ | 405 | 506 (437–576)§§ | 418 | 8.1 (7.0–9.3)§§ | 93 | 116 (98–134)§§ |
| Louisiana | 530 | 24.9 (22.7–27.1)§§ | 365 | 591 (511–670) | 193 | 8.6 (7.3–10.1)§§ | 92 | 150 (108–191) |
| New Jersey | 937 | 23.6 (21.6–25.7)§§ | 653 | 525 (421–629)§§ | 397 | 10.2 (8.9–11.8) | 187 | 151 (111–190) |
| Hawaii | 467 | 20.8 (18.5–23.4)§§ | 85 | 399 (331–467)§§ | 169 | 7.0 (5.6–8.6)§§ | 18 | 83 (66–101)§§ |
Abbreviation: CI = confidence interval.
* Number of falls in the preceding 12 months.
† An injury caused by a fall in the preceding 12 months that caused respondents to limit their regular activities for =1 days or to go see a doctor.
§ Unweighted number of older adults reporting a fall. Because of varying question-specific nonresponse, sample sizes vary among questions.
¶ Number of falls per 1,000 adults aged =65 years.
** Number of fall injuries per 1,000 adults aged =65 years.
†† Significantly higher than the overall percentage or rate.
§§ Significantly lower than the overall percentage or rate.
Suggested citation for this article: Bergen G, Stevens MR, Burns ER. Falls and Fall Injuries Among Adults Aged =65 Years — United States, 2014. MMWR Morb Mortal Wkly Rep 2016;65:993–998. DOI: http://dx.doi.org/10.15585/mmwr.mm6537a2.
Use of trade names and commercial sources is for identification only and does not imply endorsement by the U.S. Department of Health and Human Services.
References to non-CDC sites on the Internet are provided as a service to MMWR readers and do not constitute or imply endorsement of these organizations or their programs by CDC or the U.S. Department of Health and Human Services. CDC is not responsible for the content of pages found at these sites. URL addresses listed in MMWR were current as of the date of publication.
All HTML versions of MMWR articles are generated from final proofs through an automated process. This conversion might result in character translation or format errors in the HTML version. Users are referred to the electronic PDF version (https://www.cdc.gov/mmwr) and/or the original MMWR paper copy for printable versions of official text, figures, and tables.
Questions or messages regarding errors in formatting should be addressed to mmwrq@cdc.gov.
Source URL: https://www.cdc.gov/mmwr/volumes/65/wr/mm6537a2.htm
Source Agency: Centers for Disease Control and Prevention (CDC)
Captured Date: 2016-09-23 00:14:16.0