
 |
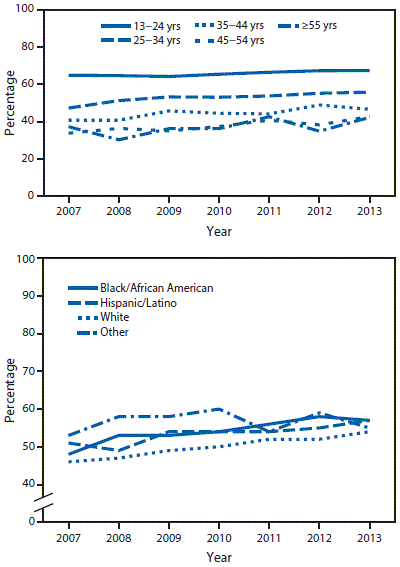
HIV Testing Experience Before HIV Diagnosis Among Men Who Have Sex with Men — 21 Jurisdictions, United States, 2007–2013Weekly / September 23, 2016 / 65(37);999–1003 Article MetricsViews equals page views plus PDF downloadsViews:Citations:Altmetric:Metric DetailsLaurie Linley, MPH1; Qian An, PhD1; Ruiguang Song, PhD1; Eduardo Valverde, DrPH1; Alexandra M. Oster, MD1; Xiaona Qian, MS1; Angela L. Hernandez, MD1 (View author affiliations) View suggested citationSummaryWhat is already known about this topic? Because subgroups of men who have sex with men (MSM) are at high risk for human immunodeficiency virus (HIV) infection, CDC has recommended that sexually active MSM be tested at least annually for HIV to foster early detection of HIV infection and link infected persons to clinical and prevention services to improve health outcomes and prevent HIV transmission. What is added by this report? CDC’s National HIV Surveillance System data suggest that more MSM with HIV diagnosed in the 21 U.S. jurisdictions included in the analysis might be receiving testing annually, as indicated by the increasing percentage of MSM who had a negative HIV test in the 12 months before diagnosis, from 48% in 2007 to 56% in 2013 (among those with a known date of previous negative HIV test). What are the implications for public health practice? Although there is evidence of increased HIV testing among MSM, there is still a need to promote annual HIV testing, particularly among subgroups at high risk, to increase early detection of HIV infection and to provide rapid linkage to care to improve health among infected persons and reduce their risk for transmission. Gay, bisexual, and other men who have sex with men (MSM) continue to be the population most affected by human immunodeficiency virus (HIV) in the United States. In 2014, 81% of diagnoses of HIV infection were among adult and adolescent males, and among these, 83% of infections were attributable to male-to-male sexual contact (1). Since 2006, CDC has recommended HIV testing at least annually for sexually active MSM to foster early detection of HIV infection and prevent HIV transmission (2,3). Several initiatives and strategies during the past decade have aimed to expand HIV testing among MSM to increase early diagnosis and treatment and reduce transmission. To better understand HIV testing patterns among MSM with diagnosed HIV infection, CDC analyzed data for 2007–2013 from jurisdictions conducting HIV incidence surveillance as part of CDC’s National HIV Surveillance System (NHSS). Findings from this analysis suggest that increasing percentages of MSM have had a negative HIV test during the 12 months before diagnosis (48% in 2007, 56% in 2013, among those with a known date of previous negative HIV test), indicating a trend toward increased HIV testing and earlier HIV diagnosis among persons most at risk for HIV. Data from the NHSS were used to assess trends in HIV testing patterns among MSM with HIV infection diagnosed during 2007–2013. HIV case surveillance data and supplemental information, including testing history data from patient and provider reports, were collected by 21 jurisdictions participating in HIV incidence surveillance (18 states, two cities, and the District of Columbia)* and reported to NHSS through December 31, 2015 (4). This analysis included males aged =13 years with HIV infection attributed to male-to-male sexual contact. Testing history data indicative of a negative HIV test, a date of most recent negative HIV test, or the number of negative HIV tests during the 2 years before diagnosis were used to categorize MSM as having a previous negative HIV test before diagnosis. The date of most recent negative HIV test was used to establish the number of months between the last negative HIV test and HIV infection diagnosis. The estimated annual percent change (EAPC) and the associated 95% confidence interval (CI) were used to assess trends from 2007 to 2013 in the proportion of MSM with a previous negative HIV test among those with a testing history, and the proportion of MSM with a negative HIV test =12 months before HIV diagnosis among those who had information on the date of last negative HIV test, by age group and race/ethnicity (black/African American [black], Hispanic/Latino [regardless of race], white, or other race). In the 21 jurisdictions, the number of MSM aged =13 years with diagnosed HIV infection attributed to male-to-male sexual contact was 16,788 in 2007 and 15,951 in 2013 (Table 1). The percentage of these MSM who had any testing history data was 51% in 2007 and 69% in 2013. Overall, among MSM with testing history data, the percentage who had a previous negative HIV test increased significantly from 70% in 2007 to 74% in 2013 (EAPC = 1.15, 95% CI = 0.92–1.38). By race/ethnicity, significant increases from 2007 to 2013 occurred for black MSM (from 64% to 73%; EAPC = 2.67, 95% CI = 2.24–3.11), for white MSM (from 75% to 77%; EAPC = 0.68, 95% CI = 0.32–1.05), and MSM of other races (from 73% to 77%; EAPC = 1.34, 95% CI = 0.45–2.24). By age group, significant increases from 2007 to 2013 occurred among MSM of all age groups except those aged =55 years. Although the trend from 2007 to 2013 in the percentage with a previous negative HIV test among Hispanic/Latino MSM was not significant overall, there was a significant increase among Hispanic/Latino MSM aged 25–34 years. Among black MSM, significant increases were observed for all age groups. Among white MSM, significant increases were observed among those aged 35–44 and 45–54 years. Among MSM with a known date of negative HIV test before HIV diagnosis (30% of all MSM in 2007 and 47% in 2013), the trend in the percentage of those with a negative test =12 months before diagnosis increased overall from 48% in 2007 to 56% in 2013 (EAPC = 2.34, 95% CI = 1.89–2.78) (Table 2). By race/ethnicity, from 2007 to 2013 the percentage of MSM with a negative test =12 months before HIV diagnosis increased among blacks (from 48% to 57%; EAPC = 2.49, 95% CI = 1.73–3.26), Hispanics/Latinos (from 51% to 57%; EAPC = 1.87, 95% CI = 1.03–2.72), and whites (from 46% to 54%; EAPC = 2.69, 95% CI = 1.88–3.51). By age group, the percentage with a negative test =12 months before HIV diagnosis increased significantly for MSM among all age groups except for those aged =55 years (Figure). Among black MSM, significant increases were observed among those aged 13–24, 25–34, and 35–44 years; among Hispanics/Latinos, increases were only observed among those aged 25–34 and 45–54 years; among whites, increases were observed among those aged 25–34, 35–44, and 45–54 years (Table 2). DiscussionThese results indicate that during 2007–2013, an increasing percentage of MSM with HIV diagnosed in the jurisdictions included in the analysis were tested for HIV before diagnosis. The results also suggest more MSM might be testing annually, as indicated by the increasing percentage of those tested in the 12 months before diagnosis, which could facilitate diagnosis sooner after infection. Although the findings in this report only assess the previous HIV testing pattern among those MSM with diagnosed HIV infections, the trend in HIV testing is consistent with earlier findings of an increase in the percentage of MSM tested in the previous 12 months, from 63% in 2008 to 67% in 2011 (5). The findings in this report differ slightly from previous reports from national surveys of the general U.S. population that conducted subgroup analyses of MSM; those analyses found only modest or nonsignificant increases in HIV testing among MSM before and after the 2006 publication of CDC guidelines, although these surveys might have had limited power to detect changes among this subgroup because of small sample sizes of MSM (6,7). The findings in this report are subject to at least three limitations. First, results are based on data from only 21 jurisdictions that are not representative of the entire United States; however, these accounted for 73% of reported HIV cases in the United States during 2013. Second, approximately one half to two thirds of MSM with HIV diagnosed during the analysis period had testing history data available. Finally, testing history data obtained from self-reports or chart abstraction could be biased, but the potential impact of this is unclear. Since the release of the 2006 CDC HIV testing recommendations, several national initiatives and strategies have aimed to raise general awareness of HIV, increase HIV testing, and strengthen HIV prevention for those most affected. The National HIV/AIDS Strategy, released in 2010,† established a framework for intensified HIV prevention efforts in the communities where HIV is most concentrated (particularly among MSM, persons who are black or Hispanic/Latino, and persons who inject drugs) (8). To achieve National HIV/AIDS Strategy goals, CDC funds state and local health departments and community-based organizations across the United States for expanded HIV testing and HIV prevention activities and directs resources to disproportionately affected populations, including MSM.§ CDC has also implemented programs such as the MSM Testing Initiative, which was intended to scale up HIV testing among blacks and Hispanics/Latinos to identify those HIV-infected MSM previously unaware of their infections and link them to care, and the Expanded Testing Initiative, which was implemented to support HIV testing among MSM of all races and ethnicities, as well as persons who inject drugs. Other strategies include the Act Against AIDS campaign, a national campaign launched in 2009 by CDC and the White House that focuses on raising HIV awareness among all persons in the United States and reducing the risk for infection among the most affected populations, including MSM, blacks, Hispanics/Latinos, and other communities at increased risk.¶ Findings from this analysis indicate that these strategies and programs might be reaching the intended groups and leading to increased HIV testing and earlier HIV diagnosis. However, there are still racial/ethnic differences; for example, a lower percentage of black and Hispanic/Latino MSM had prior negative HIV tests than did whites. Although testing facilitates early detection of HIV, given the large numbers of MSM still acquiring HIV (many after having a negative HIV test), enhanced HIV testing efforts might incorporate provision of biomedical prevention interventions such as preexposure prophylaxis for persons testing negative but still at risk for infection to reduce HIV acquisition (9). Preexposure prophylaxis, which involves taking antiretroviral medications before becoming exposed to HIV, can substantially reduce the risk for HIV infection in persons at high risk for infection.** Corresponding author: Laurie Linley, LLinley@cdc.gov, 404-639-2086. 1Division of HIV/AIDS Prevention, National Center for HIV, Viral Hepatitis, STD, and TB Prevention, CDC. References
* The 21 jurisdictions contributing data to this analysis were the states of Alabama, Arizona, California, Colorado, Connecticut, Florida, Indiana, Louisiana, Massachusetts, Michigan, Mississippi, New Jersey, New York, North Carolina, South Carolina, Texas, Virginia, and Washington; the cities of Chicago, Illinois, and Philadelphia, Pennsylvania; and the District of Columbia. † In 2015, The National HIV/AIDS Strategy: Updated to 2020 was released and is available at https://www.aids.gov/federal-resources/national-hiv-aids-strategy/nhas-update.pdf. § Additional information about CDC’s activities and programs to address the health and well-being of MSM, including programs aimed to expand routine HIV testing, is available at http://www.cdc.gov/msmhealth/msm-programs.htm.
|
||||||||||||||||||||||||||||||||||||||||||||||||||||||||||||||||||||||||||||||||||||||||||||||||||||||||||||||||||||||||||||||||||||||||||||||||||||||||||||||||||||||||||||||||||||||||||||||||||||||||||||||||||||||||||||||||||||||||||||||||||||||||||||||||||||||||||||||||||||||||||||||||||||||||||||||||||||||||||||||||||||||||||||||||||||||||||||||||||||||||||||||||||||||||||||||||||||||||||||||||||||||||||||||||||||||||||||||||||||||||||||||||||||||||||||||||||||||||||||||||||||||||||||||||||||||||||||||||||||||||||||||||||||||||||||||||||||||||||||||||||||||||||||||||||||||||
| Characteristic | 2007 | 2013 | 2007–2013 | ||||||
|---|---|---|---|---|---|---|---|---|---|
| Total no. | With testing history | Negative test before diagnosis | Total no. | With testing history | Negative test before diagnosis | ||||
| No. (%†) | No. (%§) | No. (%†) | No. (%§) | EAPC | L95 | U95 | |||
| Age group at diagnosis (yrs) | |||||||||
| 13–24 | 3,432 | 2,187 (64) | 1,519 (70) | 4,623 | 3,473 (75) | 2,560 (74) | 1.40 | 0.96 | 1.84 |
| 25–34 | 4,949 | 2,738 (55) | 2,015 (74) | 5,435 | 3,901 (72) | 3,053 (78) | 1.20 | 0.84 | 1.56 |
| 35–44 | 4,919 | 2,224 (45) | 1,574 (71) | 2,869 | 1,883 (66) | 1,391 (74) | 0.77 | 0.28 | 1.26 |
| 45–54 | 2,592 | 1,025 (40) | 621 (61) | 2,127 | 1,305 (61) | 885 (68) | 1.33 | 0.56 | 2.10 |
| =55 | 896 | 313 (35) | 190 (61) | 897 | 498 (56) | 307 (62) | 1.05 | -0.56 | 2.70 |
| Race/Ethnicity | |||||||||
| Black/African American | 5,066 | 2,866 (57) | 1,820 (64) | 5,525 | 3,959 (72) | 2,906 (73) | 2.67 | 2.24 | 3.11 |
| Hispanic/Latino¶ | 4,409 | 2,084 (47) | 1,470 (71) | 4,729 | 3,297 (70) | 2,364 (72) | 0.16 | -0.29 | 0.61 |
| White | 6,317 | 3,021 (48) | 2,255 (75) | 4,721 | 3,123 (66) | 2,403 (77) | 0.68 | 0.32 | 1.05 |
| Other | 996 | 516 (52) | 374 (73) | 976 | 681 (70) | 523 (77) | 1.34 | 0.45 | 2.24 |
| Black/African American, by age group at diagnosis (yrs) | |||||||||
| 13–24 | 1,777 | 1,205 (68) | 793 (66) | 2,491 | 1,913 (77) | 1,403 (73) | 2.51 | 1.89 | 3.14 |
| 25–34 | 1,455 | 842 (58) | 554 (66) | 1,815 | 1,309 (72) | 1,017 (78) | 2.54 | 1.84 | 3.25 |
| 35–44 | 1,092 | 529 (48) | 339 (64) | 655 | 431 (66) | 318 (74) | 2.24 | 1.00 | 3.51 |
| 45–54 | 548 | 226 (41) | 115 (51) | 407 | 226 (56) | 131 (58) | 2.48 | 0.33 | 4.68 |
| =55 | 194 | 64 (33) | 19 (30) | 157 | 80 (51) | 37 (46) | 5.47 | 0.35 | 10.86 |
| Hispanic/Latino,¶ by age group at diagnosis (yrs) | |||||||||
| 13–24 | 892 | 499 (56) | 354 (71) | 1,182 | 872 (74) | 641 (74) | 0.30 | -0.57 | 1.18 |
| 25–34 | 1,636 | 843 (52) | 610 (72) | 1,863 | 1,350 (73) | 1,030 (76) | 0.78 | 0.12 | 1.45 |
| 35–44 | 1,292 | 524 (41) | 382 (73) | 991 | 647 (65) | 436 (67) | -0.66 | -1.59 | 0.27 |
| 45–54 | 464 | 183 (39) | 101 (55) | 536 | 340 (63) | 215 (63) | 0.79 | -1.02 | 2.63 |
| =55 | 125 | 35 (28) | 23 (66) | 157 | 88 (56) | 42 (48) | -5.00 | -9.48 | -0.30 |
| White, by age group at diagnosis (yrs) | |||||||||
| 13–24 | 570 | 358 (63) | 278 (78) | 700 | 501 (72) | 382 (76) | -0.05 | -1.07 | 0.98 |
| 25–34 | 1,518 | 866 (57) | 702 (81) | 1,380 | 966 (70) | 779 (81) | 0.55 | -0.02 | 1.12 |
| 35–44 | 2,233 | 1,031 (46) | 763 (74) | 1,013 | 672 (66) | 532 (79) | 1.08 | 0.42 | 1.74 |
| 45–54 | 1,450 | 560 (39) | 370 (66) | 1,080 | 669 (62) | 493 (74) | 1.32 | 0.42 | 2.24 |
| =55 | 546 | 206 (38) | 142 (69) | 548 | 315 (58) | 217 (69) | 0.95 | -0.82 | 2.75 |
| Total | 16,788 | 8,487 (51) | 5,919 (70) | 15,951 | 11,060 (69) | 8,196 (74) | 1.15 | 0.92 | 1.38 |
Abbreviations: EAPC = estimated annual percent change; HIV = human immunodeficiency virus; L95 = lower bound of 95% confidence interval; MSM = men who have sex with men; U95 = upper bound of 95% confidence interval.
* MSM in this analysis were males aged =13 years with HIV infection attributable to male-to-male sexual contact.
† Percentage of reported diagnoses.
§ Percentage of cases with testing history information.
¶ Hispanics/Latinos can be of any race.
 TABLE 2. Number and percentage of MSM* with a negative HIV test in 12 months before diagnosis among those with a known date of negative test,† by year of diagnosis and selected characteristics — 21 U.S. jurisdictions, 2007–2013
| Characteristic | 2007 | 2013 | 2007–2013 | ||||
|---|---|---|---|---|---|---|---|
| Date of negative HIV test available | Last negative HIV test within 12 months before diagnosis | Date of negative HIV test available | Last negative HIV test within 12 months before diagnosis | ||||
| No. | No. (%§) | No. | No. (%§) | EAPC | L95 | U95 | |
| Age group at diagnosis (yrs) | |||||||
| 13–24 | 1,258 | 817 (65) | 2,332 | 1,571 (67) | 0.88 | 0.25 | 1.52 |
| 25–34 | 1,724 | 816 (47) | 2,787 | 1,556 (56) | 2.14 | 1.40 | 2.89 |
| 35–44 | 1,320 | 538 (41) | 1,263 | 588 (47) | 2.63 | 1.50 | 3.78 |
| 45–54 | 522 | 177 (34) | 789 | 338 (43) | 3.47 | 1.61 | 5.36 |
| =55 | 158 | 59 (37) | 272 | 115 (42) | 3.07 | -0.32 | 6.59 |
| Race/Ethnicity | |||||||
| Black/African American | 1,487 | 715 (48) | 2,634 | 1,500 (57) | 2.49 | 1.73 | 3.26 |
| Hispanic/Latino¶ | 1,198 | 614 (51) | 2,161 | 1,222 (57) | 1.87 | 1.03 | 2.72 |
| White | 1,982 | 910 (46) | 2,180 | 1,187 (54) | 2.69 | 1.88 | 3.51 |
| Other | 315 | 168 (53) | 468 | 259 (55) | 0.20 | -1.38 | 1.80 |
| Black/African American, by age group at diagnosis (yrs) | |||||||
| 13–24 | 649 | 406 (63) | 1,270 | 844 (66) | 1.28 | 0.39 | 2.18 |
| 25–34 | 463 | 185 (40) | 929 | 479 (52) | 2.88 | 1.41 | 4.38 |
| 35–44 | 269 | 90 (34) | 287 | 125 (44) | 3.84 | 1.10 | 6.65 |
| 45–54 | 90 | 31 (34) | 118 | 43 (36) | 3.53 | -1.20 | 8.49 |
| =55 | 16 | 3 (19) | 30 | 9 (30) | 5.72 | -5.93 | 18.82 |
| Hispanic/Latino,¶ by age group at diagnosis (yrs) | |||||||
| 13–24 | 291 | 207 (71) | 588 | 405 (69) | 0.48 | -0.80 | 1.78 |
| 25–34 | 506 | 242 (48) | 943 | 531 (56) | 1.98 | 0.70 | 3.28 |
| 35–44 | 300 | 132 (44) | 399 | 179 (45) | 1.17 | -0.92 | 3.30 |
| 45–54 | 84 | 28 (33) | 194 | 88 (45) | 7.73 | 3.34 | 12.30 |
| =55 | 17 | 5 (29) | 37 | 19 (51) | 6.43 | -2.77 | 16.50 |
| White, by age group at diagnosis (yrs) | |||||||
| 13–24 | 246 | 162 (66) | 353 | 242 (69) | 0.73 | -0.68 | 2.15 |
| 25–34 | 623 | 310 (50) | 712 | 433 (61) | 2.65 | 1.36 | 3.96 |
| 35–44 | 674 | 280 (42) | 484 | 242 (50) | 3.67 | 1.99 | 5.37 |
| 45–54 | 318 | 107 (34) | 436 | 188 (43) | 2.49 | 0.08 | 4.95 |
| =55 | 121 | 51 (42) | 195 | 82 (42) | 1.77 | -2.12 | 5.81 |
| Total | 4,982 | 2,407 (48) | 7,443 | 4,168 (56) | 2.34 | 1.89 | 2.78 |
Abbreviations: EAPC = estimated annual percent change; HIV = human immunodeficiency virus; L95 = lower bound of 95% confidence interval; MSM = men who have sex with men; U95 = upper bound of 95% confidence interval.
* MSM in this analysis were males aged =13 years with HIV infection attributable to male-to-male sexual contact.
† Refer to figure for graph of trends from 2007–2013 in percentage of HIV-diagnosed MSM with a negative HIV test in 12 months before diagnosis.
§ Percentage of MSM with a known date of previous negative HIV test.
¶ Hispanics/Latinos can be of any race.
FIGURE. Percentage of MSM* with a negative HIV test =12 months before HIV diagnosis, by age at diagnosis and race/ethnicity† — 21 U.S. jurisdictions, 2007–2013
Abbreviations: HIV = human immunodeficiency virus; MSM = men who have sex with men.
* MSM in this analysis were males aged =13 years with HIV infection attributable to male-to-male sexual contact.
† Hispanics/Latinos can be of any race.
Suggested citation for this article: Linley L, An Q, Song R, et al. HIV Testing Experience Before HIV Diagnosis Among Men Who Have Sex with Men — 21 Jurisdictions, United States, 2007–2013. MMWR Morb Mortal Wkly Rep 2016;65:999–1003. DOI: http://dx.doi.org/10.15585/mmwr.mm6537a3.
Use of trade names and commercial sources is for identification only and does not imply endorsement by the U.S. Department of Health and Human Services.
References to non-CDC sites on the Internet are provided as a service to MMWR readers and do not constitute or imply endorsement of these organizations or their programs by CDC or the U.S. Department of Health and Human Services. CDC is not responsible for the content of pages found at these sites. URL addresses listed in MMWR were current as of the date of publication.
All HTML versions of MMWR articles are generated from final proofs through an automated process. This conversion might result in character translation or format errors in the HTML version. Users are referred to the electronic PDF version (https://www.cdc.gov/mmwr) and/or the original MMWR paper copy for printable versions of official text, figures, and tables.
Questions or messages regarding errors in formatting should be addressed to mmwrq@cdc.gov.
Source URL: https://www.cdc.gov/mmwr/volumes/65/wr/mm6537a3.htm
Source Agency: Centers for Disease Control and Prevention (CDC)
Captured Date: 2016-09-23 00:14:17.0
|