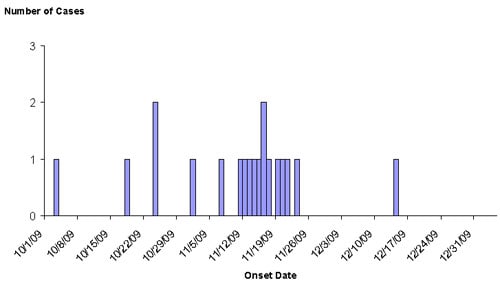
Infections with the outbreak strain of E. coli O157:H7, by date of illness onset*

(n=19 for whom information was reported as of January 4, 2010)

Infections with the Outbreak Strain of E. coli O157:H7 By Illness Onset

*Note: Onset date unknown for 2 cases

The outbreak can be visually described with a chart showing the number of persons who became ill each day. This chart is called an epidemic curve or epi curve. Illnesses that occurred after December 22, 2009 might not yet be reported due to the time it takes between when a person becomes ill and when the illness is reported. This takes an average of 2 to 3 weeks. Please see the Timeline for Reporting of E. coli Cases for more details.

Page last modified: January 6, 2010
Content source: National Center for Zoonotic, Vector-Borne, and Enteric Diseases (ZVED)

Syndicated Content Details:
Source URL: http://www.cdc.gov/ecoli/2010/0105_chart.html
Source Agency: Centers for Disease Control and Prevention (CDC)
Captured Date: 2016-05-23 21:50:57.0


Terms of Use | Privacy Policy
©2017 ARCHES Technology. All Rights Reserved.