Infections with the outbreak strain of E. coli O157:H7 by known or estimated illness onset, October 2010 - present
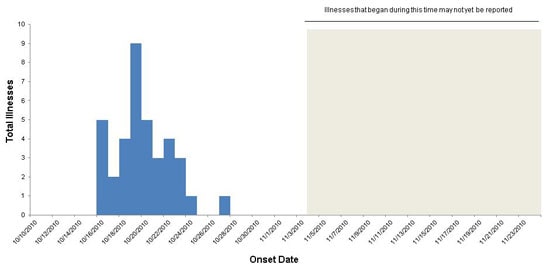
N=37 for whom information was reported as of November 24, 2010
The outbreak can be visually described with a chart showing the number of persons who became ill each day. This chart is called an epidemic curve or epi curve. Illnesses that occurred after November 4, 2010 might not yet be reported due to the time it takes between when a person becomes ill and when the illness is reported. This takes an average of 2 to 3 weeks.