Persons using assistive technology might not be able to fully access information in this file. For assistance, please send e-mail to: mmwrq@cdc.gov. Type 508 Accommodation and the title of the report in the subject line of e-mail.
Notifiable Diseases and Mortality Tables
Table I Summary of provisional cases of selected notifiable diseases, United States, cumulative, week ending December 3, 2011 (48th Week)
Figure I Selected notifiable disease reports, United States, comparison of provisional 4-week totals ending December 3, 2011, with historical data
Table II Provisional cases of selected notifiable diseases, United States, weeks ending December 3, 2011 and December 4, 2010 (48th Week)
Table III Deaths in 122 U.S. cities, week ending December 3, 2011 (48th Week)
TABLE I. Provisional cases of infrequently reported notifiable diseases (<1,000 cases reported during the preceding year) ? United States, week ending December 3, 2011 (48th week)*
TABLE I. (Continued) Provisional cases of infrequently reported notifiable diseases (<1,000 cases reported during the preceding year) ? United States, week ending December 3, 2011 (48th week)*
?: No reported cases. N: Not reportable. NN: Not Nationally Notifiable. Cum: Cumulative year-to-date counts.
§ Not reportable in all states. Data from states where the condition is not reportable are excluded from this table except starting in 2007 for the arboviral diseases, STD data, TB data, and influenza-associated pediatric mortality, and in 2003 for SARS-CoV. Reporting exceptions are available at http://www.cdc.gov/osels/ph_surveillance/nndss/phs/infdis.htm.
¶ Includes both neuroinvasive and nonneuroinvasive. Updated weekly from reports to the Division of Vector-Borne Infectious Diseases, National Center for Zoonotic, Vector-Borne, and Enteric Diseases (ArboNET Surveillance). Data for West Nile virus are available in Table II.
** Data for H. influenzae (all ages, all serotypes) are available in Table II.
†† Updated weekly from reports to the Influenza Division, National Center for Immunization and Respiratory Diseases. Since October 2, 2011, no influenza-associated pediatric deaths occurring during the 2011-12 influenza season have been reported.
§§ The one measles case reported for the current week was imported.
¶¶ Data for meningococcal disease (all serogroups) are available in Table II.
*** CDC discontinued reporting of individual confirmed and probable cases of 2009 pandemic influenza A (H1N1) virus infections on July 24, 2009. During 2009, four cases of human infection with novel influenza A viruses, different from the 2009 pandemic influenza A (H1N1) strain, were reported to CDC. The four cases of novel influenza A virus infection reported to CDC during 2010, and the eight cases reported during 2011, were identified as swine influenza A (H3N2) virus and are unrelated to the 2009 pandemic influenza A (H1N1) virus. Total case counts are provided by the Influenza Division, National Center for Immunization and Respiratory Diseases (NCIRD).
††† No rubella cases were reported for the current week.
§§§ Updated weekly from reports to the Division of STD Prevention, National Center for HIV/AIDS, Viral Hepatitis, STD, and TB Prevention.
¶¶¶ There was one case of viral hemorrhagic fever reported during week 12 of 2010. The one case report was confirmed as lassa fever. See Table II for dengue hemorrhagic fever.
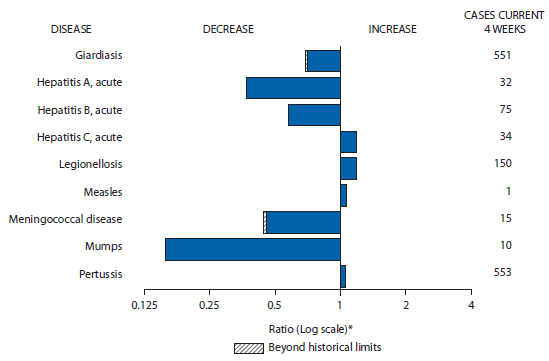
FIGURE I. Selected notifiable disease reports, United States, comparison of provisional 4-week totals December 3, 2011, with historical data
* Ratio of current 4-week total to mean of 15 4-week totals (from previous, comparable, and subsequent 4-week periods for the past 5 years). The point where the hatched area begins is based on the mean and two standard deviations of these 4-week totals.
Alternate Text: The figure above shows selected notifiable disease reports for the United States with comparison of provisional 4-week totals through December 3, 2011, with historical data. Reports of acute hepatitis C, legionellosis, measles and pertussis increased. Reports of giardiasis, acute hepatitis A, acute hepatitis B, meningococcal disease, and mumps decreased, with giardiasis and meningococcal disease decreasing beyond historical limits.
TABLE II. Provisional cases of selected notifiable diseases, United States, weeks ending December 3, 2011, and December 4, 2010 (48th week)*
Reporting area
Chlamydia trachomatis infection
Coccidioidomycosis
Cryptosporidiosis
Current week
Previous 52 weeks
Cum 2011
Cum 2010
Current week
Previous 52 weeks
Cum 2011
Cum 2010
Current week
Previous 52 weeks
Cum 2011
Cum 2010
Med
Max
Med
Max
Med
Max
United States
13,211
26,700
31,142
1,227,432
1,197,557
71
375
572
17,789
N
46
130
368
7,587
8,455
New England
1,095
866
2,043
40,960
38,781
?
0
1
1
N
1
7
22
361
468
Connecticut
310
216
1,557
9,854
10,337
?
0
0
?
N
?
1
9
65
77
Maine†
62
58
100
2,804
2,410
?
0
0
?
N
?
1
4
46
92
Massachusetts
628
421
860
20,582
19,393
?
0
0
?
N
?
3
8
150
158
New Hampshire
2
58
91
2,635
2,261
?
0
1
1
N
1
1
5
59
55
Rhode Island†
49
80
154
3,725
3,212
?
0
0
?
N
?
0
1
1
18
Vermont†
44
26
84
1,360
1,168
?
0
0
?
N
?
1
5
40
68
Mid. Atlantic
1,860
3,374
4,031
154,890
159,871
?
0
1
6
N
7
15
41
799
811
New Jersey
144
546
1,071
27,618
24,432
?
0
0
?
N
?
0
3
22
51
New York (Upstate)
743
711
2,099
33,150
31,991
?
0
0
?
N
4
4
15
208
206
New York City
248
1,119
1,342
46,952
59,499
?
0
0
?
N
?
1
6
77
94
Pennsylvania
725
972
1,245
47,170
43,949
?
0
1
6
N
3
9
26
492
460
E.N. Central
946
4,050
7,039
184,643
189,586
?
0
5
44
N
9
32
143
2,331
2,314
Illinois
29
1,105
1,322
48,498
56,224
?
0
0
?
N
?
3
26
198
325
Indiana
226
508
3,376
24,972
18,527
?
0
0
?
N
?
4
14
180
271
Michigan
532
953
1,429
44,876
45,823
?
0
3
27
N
1
6
14
316
310
Ohio
159
995
1,124
45,926
47,457
?
0
3
17
N
8
11
95
1,064
445
Wisconsin
?
458
558
20,371
21,555
?
0
0
?
N
?
8
61
573
963
W.N. Central
315
1,469
1,756
68,330
67,111
?
0
2
6
N
1
18
87
1,214
1,806
Iowa
9
212
253
9,817
9,852
?
0
0
?
N
?
6
19
336
385
Kansas
33
202
288
9,485
8,966
?
0
0
?
N
?
0
10
39
105
Minnesota
?
287
371
12,845
14,356
?
0
0
?
N
?
0
4
?
386
Missouri
201
537
759
25,587
24,114
?
0
0
?
N
?
5
63
499
540
Nebraska†
54
114
216
5,763
4,680
?
0
2
6
N
1
3
12
173
255
North Dakota
5
40
77
1,812
2,185
?
0
0
?
N
?
0
12
28
31
South Dakota
13
63
93
3,021
2,958
?
0
0
?
N
?
2
13
139
104
S. Atlantic
4,052
5,380
7,073
259,554
237,869
?
0
2
5
N
11
21
37
1,024
1,001
Delaware
108
86
134
4,024
4,094
?
0
0
?
N
?
0
1
7
7
District of Columbia
124
107
191
5,136
5,191
?
0
0
?
N
?
0
1
5
8
Florida
990
1,495
1,698
70,172
69,731
?
0
0
?
N
8
8
17
409
377
Georgia
845
1,013
2,384
47,767
40,430
?
0
0
?
N
?
5
11
252
254
Maryland†
?
473
1,125
22,037
22,827
?
0
2
5
N
1
1
6
62
37
North Carolina
603
971
1,688
47,876
38,972
?
0
0
?
N
?
0
13
39
90
South Carolina†
669
524
946
26,438
24,446
?
0
0
?
N
2
2
8
124
113
Virginia†
596
661
1,576
32,176
28,569
?
0
0
?
N
?
2
8
110
98
West Virginia
117
80
121
3,928
3,609
?
0
0
?
N
?
0
5
16
17
E.S. Central
1,189
1,896
3,314
88,763
84,525
?
0
0
?
N
3
6
13
283
329
Alabama†
?
546
1,566
26,718
24,826
?
0
0
?
N
1
2
7
125
171
Kentucky
454
301
2,352
15,173
13,381
?
0
0
?
N
?
0
2
30
81
Mississippi
430
398
696
18,580
19,841
?
0
0
?
N
?
1
4
44
24
Tennessee†
305
600
758
28,292
26,477
?
0
0
?
N
2
2
6
84
53
W.S. Central
995
3,567
4,639
165,463
164,518
?
0
1
5
N
6
8
62
510
493
Arkansas†
404
309
440
14,747
14,379
?
0
0
?
N
?
0
2
25
32
Louisiana
488
404
1,071
20,799
25,894
?
0
1
5
N
?
0
9
45
64
Oklahoma
103
319
1,340
16,578
12,968
?
0
0
?
N
1
2
34
80
83
Texas†
?
2,436
3,048
113,339
111,277
?
0
0
?
N
5
5
37
360
314
Mountain
1,209
1,748
2,229
82,697
77,104
67
292
459
13,959
N
6
10
30
560
580
Arizona
447
546
765
26,866
24,937
67
288
456
13,805
N
1
1
4
42
38
Colorado
418
412
847
21,541
18,444
?
0
0
?
N
1
2
12
145
131
Idaho†
?
81
235
3,647
3,651
?
0
0
?
N
1
2
9
102
100
Montana†
66
62
87
3,109
2,862
?
0
2
5
N
2
1
6
73
47
Nevada†
192
203
380
9,728
9,041
?
2
5
90
N
?
0
2
13
38
New Mexico†
67
213
1,183
10,044
10,009
?
0
4
44
N
?
2
9
119
129
Utah
12
127
187
6,077
6,220
?
0
2
12
N
?
1
5
41
69
Wyoming†
7
38
67
1,685
1,940
?
0
2
3
N
1
0
5
25
28
Pacific
1,550
3,947
6,559
182,132
178,192
4
82
143
3,763
N
2
11
29
505
653
Alaska
55
113
157
5,374
5,628
?
0
0
?
N
?
0
3
14
6
California
935
2,953
5,763
139,406
136,449
4
81
143
3,756
N
?
6
19
300
357
Hawaii
?
107
135
4,608
5,609
?
0
0
?
N
?
0
0
?
1
Oregon
264
278
524
12,804
10,826
?
0
1
7
N
?
2
8
118
206
Washington
296
436
672
19,940
19,680
?
0
0
?
N
2
1
9
73
83
Territories
American Samoa
?
0
0
?
?
?
0
0
?
N
N
0
0
N
N
C.N.M.I.
?
?
?
?
?
?
?
?
?
N
?
?
?
?
?
Guam
?
14
62
189
843
?
0
0
?
N
?
0
0
?
?
Puerto Rico
74
104
349
4,908
5,655
?
0
0
?
N
N
0
0
N
N
U.S. Virgin Islands
?
16
27
642
546
?
0
0
?
N
?
0
0
?
?
C.N.M.I.: Commonwealth of Northern Mariana Islands.
U: Unavailable. ?: No reported cases. N: Not reportable. NN: Not Nationally Notifiable. Cum: Cumulative year-to-date counts. Med: Median. Max: Maximum.
† Contains data reported through the National Electronic Disease Surveillance System (NEDSS).
TABLE II. (Continued) Provisional cases of selected notifiable diseases, United States, weeks ending December 3, 2011, and December 4, 2010 (48th week)*
Reporting area
Dengue Virus Infection†
Dengue Fever§
Dengue Hemorrhagic Fever¶
Current week
Previous 52 weeks
Cum 2011
Cum 2010
Current week
Previous 52 weeks
Cum 2011
Cum 2010
Med
Max
Med
Max
United States
?
3
16
190
678
?
0
1
2
10
New England
?
0
1
2
10
?
0
0
?
?
Connecticut
?
0
0
?
?
?
0
0
?
?
Maine**
?
0
0
?
6
?
0
0
?
?
Massachusetts
?
0
0
?
?
?
0
0
?
?
New Hampshire
?
0
0
?
?
?
0
0
?
?
Rhode Island**
?
0
0
?
1
?
0
0
?
?
Vermont**
?
0
1
2
3
?
0
0
?
?
Mid. Atlantic
?
1
6
55
220
?
0
0
?
5
New Jersey
?
0
0
?
29
?
0
0
?
?
New York (Upstate)
?
0
1
?
30
?
0
0
?
2
New York City
?
0
4
40
140
?
0
0
?
3
Pennsylvania
?
0
2
15
21
?
0
0
?
?
E.N. Central
?
0
2
12
67
?
0
1
1
1
Illinois
?
0
2
2
21
?
0
1
1
?
Indiana
?
0
1
2
14
?
0
0
?
?
Michigan
?
0
1
2
9
?
0
0
?
?
Ohio
?
0
1
2
16
?
0
0
?
?
Wisconsin
?
0
2
4
7
?
0
0
?
1
W.N. Central
?
0
2
11
32
?
0
0
?
1
Iowa
?
0
1
3
2
?
0
0
?
?
Kansas
?
0
1
1
4
?
0
0
?
?
Minnesota
?
0
1
5
14
?
0
0
?
?
Missouri
?
0
1
1
4
?
0
0
?
?
Nebraska**
?
0
0
?
7
?
0
0
?
?
North Dakota
?
0
1
1
1
?
0
0
?
?
South Dakota
?
0
0
?
?
?
0
0
?
1
S. Atlantic
?
1
8
75
235
?
0
1
1
2
Delaware
?
0
2
2
?
?
0
0
?
?
District of Columbia
?
0
0
?
?
?
0
0
?
?
Florida
?
1
7
55
187
?
0
0
?
2
Georgia
?
0
1
3
11
?
0
0
?
?
Maryland**
?
0
2
5
?
?
0
0
?
?
North Carolina
?
0
1
2
8
?
0
0
?
?
South Carolina**
?
0
1
1
13
?
0
0
?
?
Virginia**
?
0
1
7
14
?
0
1
1
?
West Virginia
?
0
0
?
2
?
0
0
?
?
E.S. Central
?
0
3
5
7
?
0
0
?
?
Alabama**
?
0
1
2
4
?
0
0
?
?
Kentucky
?
0
1
1
2
?
0
0
?
?
Mississippi
?
0
0
?
?
?
0
0
?
?
Tennessee**
?
0
2
2
1
?
0
0
?
?
W.S. Central
?
0
2
9
28
?
0
0
?
1
Arkansas**
?
0
0
?
?
?
0
0
?
1
Louisiana
?
0
1
3
4
?
0
0
?
?
Oklahoma
?
0
0
?
5
?
0
0
?
?
Texas**
?
0
1
6
19
?
0
0
?
?
Mountain
?
0
2
4
24
?
0
0
?
?
Arizona
?
0
2
2
12
?
0
0
?
?
Colorado
?
0
0
?
?
?
0
0
?
?
Idaho**
?
0
0
?
3
?
0
0
?
?
Montana**
?
0
0
?
4
?
0
0
?
?
Nevada**
?
0
1
1
4
?
0
0
?
?
New Mexico**
?
0
0
?
1
?
0
0
?
?
Utah
?
0
1
1
?
?
0
0
?
?
Wyoming**
?
0
0
?
?
?
0
0
?
?
Pacific
?
0
4
17
55
?
0
0
?
?
Alaska
?
0
0
?
1
?
0
0
?
?
California
?
0
2
5
36
?
0
0
?
?
Hawaii
?
0
4
5
?
?
0
0
?
?
Oregon
?
0
0
?
?
?
0
0
?
?
Washington
?
0
1
7
18
?
0
0
?
?
Territories
American Samoa
?
0
0
?
?
?
0
0
?
?
C.N.M.I.
?
?
?
?
?
?
?
?
?
?
Guam
?
0
0
?
?
?
0
0
?
?
Puerto Rico
?
26
80
1,285
10,479
?
0
3
22
237
U.S. Virgin Islands
?
0
0
?
?
?
0
0
?
?
C.N.M.I.: Commonwealth of Northern Mariana Islands.
U: Unavailable. ?: No reported cases. N: Not reportable. NN: Not Nationally Notifiable. Cum: Cumulative year-to-date counts. Med: Median. Max: Maximum.
† Updated weekly from reports to the Division of Vector-Borne Infectious Diseases, National Center for Zoonotic, Vector-Borne, and Enteric Diseases (ArboNET Surveillance).
§ Dengue Fever includes cases that meet criteria for Dengue Fever with hemorrhage, other clinical and unknown case classifications.
¶ DHF includes cases that meet criteria for dengue shock syndrome (DSS), a more severe form of DHF.
** Contains data reported through the National Electronic Disease Surveillance System (NEDSS).
TABLE II. (Continued) Provisional cases of selected notifiable diseases, United States, weeks ending December 3, 2011, and December 4, 2010 (48th week)*
Reporting area
Ehrlichiosis/Anaplasmosis†
Ehrlichia chaffeensis
Anaplasma phagocytophilum
Undetermined
Current week
Previous 52 weeks
Cum 2011
Cum 2010
Current week
Previous 52 weeks
Cum 2011
Cum 2010
Current week
Previous 52 weeks
Cum 2011
Cum 2010
Med
Max
Med
Max
Med
Max
United States
1
7
109
662
621
5
15
56
710
1,693
?
2
13
100
89
New England
?
0
1
4
8
?
2
27
244
110
?
0
1
1
2
Connecticut
?
0
0
?
?
?
0
5
?
36
?
0
0
?
?
Maine§
?
0
1
1
4
?
0
3
19
17
?
0
0
?
?
Massachusetts
?
0
0
?
?
?
1
18
160
?
?
0
0
?
?
New Hampshire
?
0
1
2
3
?
0
4
16
20
?
0
1
1
2
Rhode Island§
?
0
1
1
1
?
0
15
44
35
?
0
0
?
?
Vermont§
?
0
0
?
?
?
0
1
5
2
?
0
0
?
?
Mid. Atlantic
1
1
7
58
84
4
6
31
320
261
?
0
2
10
14
New Jersey
?
0
1
?
51
?
0
3
?
70
?
0
0
?
1
New York (Upstate)
1
0
7
47
26
4
3
27
271
179
?
0
2
10
10
New York City
?
0
2
11
5
?
0
5
45
11
?
0
0
?
?
Pennsylvania
?
0
0
?
2
?
0
1
4
1
?
0
0
?
3
E.N. Central
?
0
4
29
44
1
0
3
20
506
?
0
5
41
45
Illinois
?
0
3
19
16
?
0
2
9
9
?
0
1
2
3
Indiana
?
0
0
?
?
?
0
0
?
?
?
0
3
32
15
Michigan
?
0
2
4
2
?
0
0
?
4
?
0
2
5
?
Ohio
?
0
1
6
7
1
0
1
8
2
?
0
1
1
?
Wisconsin
?
0
0
?
19
?
0
3
3
491
?
0
1
1
27
W.N. Central
?
1
19
157
120
?
0
8
34
731
?
0
11
14
10
Iowa
N
0
0
N
N
N
0
0
N
N
N
0
0
N
N
Kansas
?
0
1
4
6
?
0
1
1
1
?
0
0
?
?
Minnesota
?
0
12
?
?
?
0
3
1
718
?
0
11
?
?
Missouri
?
1
19
151
112
?
0
7
29
12
?
0
7
13
10
Nebraska§
?
0
1
1
2
?
0
1
1
?
?
0
1
1
?
North Dakota
N
0
0
N
N
N
0
0
N
N
N
0
0
N
N
South Dakota
?
0
1
1
?
?
0
1
2
?
?
0
0
?
?
S. Atlantic
?
2
33
232
246
?
1
8
65
59
?
0
2
13
6
Delaware
?
0
2
15
17
?
0
1
1
4
?
0
0
?
?
District of Columbia
N
0
0
N
N
N
0
0
N
N
N
0
0
N
N
Florida
?
0
3
15
8
?
0
3
10
3
?
0
0
?
?
Georgia
?
0
3
18
20
?
0
2
9
1
?
0
1
2
1
Maryland§
?
0
3
28
22
?
0
2
7
15
?
0
1
1
2
North Carolina
?
0
17
61
96
?
0
6
20
24
?
0
0
?
?
South Carolina§
?
0
1
2
5
?
0
0
?
1
?
0
1
1
?
Virginia§
?
1
13
93
75
?
0
3
18
11
?
0
1
8
3
West Virginia
?
0
0
?
3
?
0
0
?
?
?
0
1
1
?
E.S. Central
?
1
8
73
87
?
0
2
16
20
?
0
3
14
9
Alabama§
?
0
2
4
11
?
0
1
4
7
N
0
0
N
N
Kentucky
?
0
3
13
16
?
0
0
?
?
?
0
0
?
1
Mississippi
?
0
1
3
3
?
0
1
1
2
?
0
0
?
1
Tennessee§
?
0
5
53
57
?
0
2
11
11
?
0
3
14
7
W.S. Central
?
0
87
109
31
?
0
9
8
6
?
0
0
?
1
Arkansas§
?
0
13
50
12
?
0
3
6
3
?
0
0
?
?
Louisiana
?
0
0
?
1
?
0
0
?
?
?
0
0
?
?
Oklahoma
?
0
82
57
15
?
0
7
2
2
?
0
0
?
?
Texas§
?
0
1
2
3
?
0
1
?
1
?
0
0
?
1
Mountain
?
0
0
?
?
?
0
0
?
?
?
0
1
5
?
Arizona
?
0
0
?
?
?
0
0
?
?
?
0
1
4
?
Colorado
N
0
0
N
N
N
0
0
N
N
N
0
0
N
N
Idaho§
N
0
0
N
N
N
0
0
N
N
N
0
0
N
N
Montana§
N
0
0
N
N
N
0
0
N
N
N
0
0
N
N
Nevada§
N
0
0
N
N
N
0
0
N
N
N
0
0
N
N
New Mexico§
N
0
0
N
N
N
0
0
N
N
N
0
0
N
N
Utah
?
0
0
?
?
?
0
0
?
?
?
0
1
1
?
Wyoming§
?
0
0
?
?
?
0
0
?
?
?
0
0
?
?
Pacific
?
0
1
?
1
?
0
1
3
?
?
0
1
2
2
Alaska
N
0
0
N
N
N
0
0
N
N
N
0
0
N
N
California
?
0
1
?
1
?
0
0
?
?
?
0
1
2
2
Hawaii
N
0
0
N
N
N
0
0
N
N
N
0
0
N
N
Oregon
?
0
0
?
?
?
0
1
3
?
?
0
0
?
?
Washington
?
0
0
?
?
?
0
0
?
?
?
0
0
?
?
Territories
American Samoa
N
0
0
N
N
N
0
0
N
N
N
0
0
N
N
C.N.M.I.
?
?
?
?
?
?
?
?
?
?
?
?
?
?
?
Guam
N
0
0
N
N
N
0
0
N
N
N
0
0
N
N
Puerto Rico
N
0
0
N
N
N
0
0
N
N
N
0
0
N
N
U.S. Virgin Islands
?
0
0
?
?
?
0
0
?
?
?
0
0
?
?
C.N.M.I.: Commonwealth of Northern Mariana Islands.
U: Unavailable. ?: No reported cases. N: Not reportable. NN: Not Nationally Notifiable. Cum: Cumulative year-to-date counts. Med: Median. Max: Maximum.
† Cumulative total E. ewingii cases reported for year 2011 = 13.
§ Contains data reported through the National Electronic Disease Surveillance System (NEDSS).
TABLE II. (Continued) Provisional cases of selected notifiable diseases, United States, weeks ending December 3, 2011, and December 4, 2010 (48th week)*
Reporting area
Giardiasis
Gonorrhea
Haemophilus influenzae, invasive† All ages, all serotypes
Current week
Previous 52 weeks
Cum 2011
Cum 2010
Current week
Previous 52 weeks
Cum 2011
Cum 2010
Current week
Previous 52 weeks
Cum 2011
Cum 2010
Med
Max
Med
Max
Med
Max
United States
154
287
445
13,890
18,386
3,192
6,068
7,484
281,067
283,233
36
65
141
2,870
2,798
New England
6
28
66
1,438
1,564
101
107
206
5,016
5,154
1
4
12
204
175
Connecticut
?
4
9
207
275
48
45
150
2,152
2,281
?
1
5
50
43
Maine§
5
3
10
168
211
8
5
17
234
149
1
0
2
25
12
Massachusetts
?
14
29
677
671
43
47
80
2,175
2,263
?
2
6
99
88
New Hampshire
?
2
8
113
153
1
2
7
117
145
?
0
2
15
11
Rhode Island§
?
1
10
65
77
?
6
16
294
268
?
0
2
9
12
Vermont§
1
3
19
208
177
1
0
8
44
48
?
0
3
6
9
Mid. Atlantic
37
57
103
2,745
3,142
432
761
920
36,033
34,066
5
14
32
645
537
New Jersey
?
2
14
136
448
53
156
258
7,648
5,454
?
2
6
91
101
New York (Upstate)
28
20
72
1,093
1,095
154
113
271
5,402
5,297
3
3
18
163
146
New York City
?
16
29
773
871
61
243
314
10,765
11,491
?
3
7
151
89
Pennsylvania
9
16
29
743
728
164
256
362
12,218
11,824
2
5
11
240
201
E.N. Central
10
47
76
2,179
3,088
275
1,030
2,091
48,658
52,417
6
11
22
506
462
Illinois
?
10
19
411
655
8
282
362
12,552
14,553
?
3
11
142
160
Indiana
?
5
11
189
376
58
121
1,018
6,026
5,245
?
2
7
85
96
Michigan
1
10
20
471
655
155
242
499
11,592
12,641
?
1
4
64
32
Ohio
9
16
30
730
804
54
315
398
14,454
15,281
6
3
7
154
110
Wisconsin
?
8
17
378
598
?
90
119
4,034
4,697
?
1
5
61
64
W.N. Central
4
22
50
1,045
2,001
93
309
369
14,414
13,816
1
3
10
142
210
Iowa
2
4
15
252
272
1
37
53
1,754
1,676
?
0
1
3
1
Kansas
?
2
8
93
201
2
42
57
1,900
1,910
1
0
2
19
23
Minnesota
?
0
16
?
801
?
38
56
1,775
1,987
?
0
5
?
74
Missouri
?
8
23
394
397
77
150
201
7,116
6,541
?
1
5
79
79
Nebraska§
2
3
11
166
207
12
24
51
1,175
1,086
?
0
3
26
23
North Dakota
?
0
12
38
28
?
4
8
181
182
?
0
6
14
10
South Dakota
?
2
8
102
95
1
11
20
513
434
?
0
1
1
?
S. Atlantic
38
51
98
2,504
3,702
1,214
1,487
1,862
69,850
70,428
15
14
31
670
706
Delaware
?
0
3
32
31
26
16
31
750
916
?
0
2
4
5
District of Columbia
?
0
3
29
54
95
38
68
1,885
1,956
?
0
0
?
6
Florida
24
23
50
1,146
1,969
297
378
465
18,181
18,858
7
4
12
213
177
Georgia
6
11
51
645
763
297
312
874
14,481
14,132
1
2
7
119
153
Maryland§
8
5
13
280
248
?
118
246
5,211
6,697
4
2
5
88
65
North Carolina
N
0
0
N
N
179
323
548
15,323
13,073
1
1
7
72
120
South Carolina§
?
2
8
106
134
181
148
257
7,530
7,325
2
1
5
70
74
Virginia§
?
5
32
244
457
123
111
352
5,745
6,942
?
2
8
87
78
West Virginia
?
0
8
22
46
16
16
29
744
529
?
0
9
17
28
E.S. Central
?
3
9
158
213
311
518
1,007
24,286
23,058
3
3
11
176
162
Alabama§
?
3
9
158
213
?
162
408
8,182
7,232
?
1
4
47
27
Kentucky
N
0
0
N
N
121
76
712
4,153
3,483
1
0
4
24
34
Mississippi
N
0
0
N
N
108
116
191
5,062
5,687
?
0
3
18
13
Tennessee§
N
0
0
N
N
82
143
224
6,889
6,656
2
2
5
87
88
W.S. Central
1
5
15
235
375
282
922
1,319
43,123
45,599
1
2
26
130
128
Arkansas§
1
2
9
114
125
119
89
138
4,346
4,371
?
0
3
30
18
Louisiana
?
2
10
121
188
144
118
372
6,037
7,900
?
1
4
41
27
Oklahoma
?
0
0
?
62
19
94
384
4,768
3,958
1
1
19
58
75
Texas§
N
0
0
N
N
?
594
813
27,972
29,370
?
0
4
1
8
Mountain
15
24
45
1,233
1,669
182
207
280
10,087
8,807
4
5
12
238
281
Arizona
?
3
6
118
154
87
79
131
4,122
2,982
?
1
6
82
103
Colorado
9
11
25
588
664
43
41
89
2,048
2,590
3
1
5
61
78
Idaho§
4
3
9
147
201
?
3
15
125
120
?
0
2
19
18
Montana§
2
2
5
75
102
1
1
4
77
96
?
0
1
3
2
Nevada§
?
1
7
69
101
48
38
103
1,853
1,612
?
0
2
17
9
New Mexico§
?
2
6
88
100
3
33
98
1,586
1,080
1
1
4
38
38
Utah
?
3
9
127
296
?
5
10
237
293
?
0
3
17
27
Wyoming§
?
0
5
21
51
?
1
3
39
34
?
0
1
1
6
Pacific
43
48
128
2,353
2,632
302
628
791
29,600
29,888
?
3
9
159
137
Alaska
?
2
7
95
91
17
20
31
938
1,214
?
0
3
25
22
California
27
33
67
1,553
1,600
222
514
695
24,384
24,334
?
0
5
39
24
Hawaii
?
0
4
32
54
?
13
24
584
708
?
0
3
24
20
Oregon
6
7
20
331
457
24
27
59
1,332
974
?
1
6
68
64
Washington
10
7
57
342
430
39
50
79
2,362
2,658
?
0
2
3
7
Territories
American Samoa
?
0
0
?
?
?
0
0
?
?
?
0
0
?
?
C.N.M.I.
?
?
?
?
?
?
?
?
?
?
?
?
?
?
?
Guam
?
0
0
?
3
?
0
8
6
91
?
0
0
?
?
Puerto Rico
?
1
4
38
89
?
6
14
302
297
?
0
0
?
1
U.S. Virgin Islands
?
0
0
?
?
?
2
10
113
127
?
0
0
?
?
C.N.M.I.: Commonwealth of Northern Mariana Islands.
U: Unavailable. ?: No reported cases. N: Not reportable. NN: Not Nationally Notifiable. Cum: Cumulative year-to-date counts. Med: Median. Max: Maximum.
† Data for H. influenzae (age <5 yrs for serotype b, nonserotype b, and unknown serotype) are available in Table I.
§ Contains data reported through the National Electronic Disease Surveillance System (NEDSS).
TABLE II. (Continued) Provisional cases of selected notifiable diseases, United States, weeks ending December 3, 2011, and December 4, 2010 (48th week)*
Hepatitis (viral, acute), by type
Reporting area
A
B
C
Current week
Previous 52 weeks
Cum 2011
Cum 2010
Current week
Previous 52 weeks
Cum 2011
Cum 2010
Current week
Previous 52 weeks
Cum 2011
Cum 2010
Med
Max
Med
Max
Med
Max
United States
5
22
74
1,078
1,531
16
48
167
2,315
3,021
7
18
39
900
774
New England
?
1
5
65
92
?
1
8
75
52
?
1
5
57
52
Connecticut
?
0
3
17
27
?
0
4
15
20
?
0
4
37
35
Maine†
?
0
2
6
7
?
0
2
8
13
?
0
2
4
2
Massachusetts
?
0
3
31
48
?
1
6
50
12
?
0
2
11
13
New Hampshire
?
0
1
?
1
?
0
1
2
5
N
0
0
N
N
Rhode Island†
?
0
1
5
9
U
0
0
U
U
U
0
0
U
U
Vermont†
?
0
2
6
?
?
0
0
?
2
?
0
1
5
2
Mid. Atlantic
?
4
8
187
263
4
5
12
255
262
1
1
5
85
100
New Jersey
?
1
3
29
72
?
1
4
58
73
?
0
2
8
27
New York (Upstate)
?
1
4
44
55
2
1
9
49
47
?
1
4
47
44
New York City
?
1
5
61
84
?
1
5
73
76
?
0
0
?
3
Pennsylvania
?
1
3
53
52
2
2
4
75
66
1
0
4
30
26
E.N. Central
1
3
8
168
199
?
6
37
304
450
1
3
10
149
90
Illinois
?
1
4
52
48
?
1
6
59
125
?
0
2
6
1
Indiana
?
0
3
12
11
?
1
3
51
68
?
0
5
55
27
Michigan
?
1
6
61
72
?
1
6
78
115
1
1
5
80
44
Ohio
1
1
3
37
46
?
1
30
89
91
?
0
1
6
8
Wisconsin
?
0
1
6
22
?
0
3
27
51
?
0
1
2
10
W.N. Central
?
1
25
38
72
?
2
16
118
110
?
0
6
8
20
Iowa
?
0
1
7
11
?
0
1
10
13
?
0
0
?
?
Kansas
?
0
2
3
11
?
0
2
11
11
?
0
1
3
2
Minnesota
?
0
22
9
15
?
0
15
9
8
?
0
6
2
10
Missouri
?
0
1
12
20
?
2
5
75
64
?
0
0
?
6
Nebraska†
?
0
1
5
14
?
0
3
12
12
?
0
1
3
2
North Dakota
?
0
3
?
?
?
0
0
?
?
?
0
0
?
?
South Dakota
?
0
2
2
1
?
0
1
1
2
?
0
0
?
?
S. Atlantic
2
4
12
218
321
3
12
56
625
827
4
4
11
216
179
Delaware
?
0
1
2
7
?
0
2
11
24
U
0
0
U
U
District of Columbia
?
0
0
?
1
?
0
0
?
3
?
0
0
?
2
Florida
?
1
7
75
131
2
4
7
185
278
2
1
3
53
55
Georgia
2
1
5
47
36
?
2
8
105
156
?
1
3
33
31
Maryland†
?
0
4
24
21
?
1
4
50
64
?
0
3
31
23
North Carolina
?
0
3
25
45
1
2
12
101
96
2
1
7
56
38
South Carolina†
?
0
2
10
25
?
1
3
32
55
?
0
1
1
1
Virginia†
?
0
3
27
47
?
1
6
62
89
?
0
3
17
12
West Virginia
?
0
5
8
8
?
0
43
79
62
?
0
6
25
17
E.S. Central
?
1
6
45
46
2
9
14
411
350
1
3
8
172
153
Alabama†
?
0
2
7
8
?
2
6
105
63
?
0
3
16
6
Kentucky
?
0
2
9
24
1
2
6
103
124
1
2
7
83
103
Mississippi
?
0
1
7
2
?
1
3
42
32
U
0
0
U
U
Tennessee†
?
0
5
22
12
1
4
8
161
131
?
1
5
73
44
W.S. Central
1
3
15
121
139
4
6
67
284
534
?
2
11
79
63
Arkansas†
?
0
0
?
2
?
1
4
47
59
?
0
0
?
1
Louisiana
?
0
2
4
11
?
1
4
28
48
?
0
2
5
3
Oklahoma
?
0
4
3
2
1
1
16
81
92
?
1
10
44
28
Texas†
1
2
11
114
124
3
3
45
128
335
?
0
3
30
31
Mountain
?
1
5
55
138
?
1
4
68
128
?
1
4
55
58
Arizona
?
0
2
16
60
?
0
3
15
25
U
0
0
U
U
Colorado
?
0
2
18
34
?
0
2
15
42
?
0
3
17
16
Idaho†
?
0
1
6
7
?
0
1
2
6
?
0
2
10
9
Montana†
?
0
1
2
4
?
0
0
?
?
?
0
1
3
3
Nevada†
?
0
3
5
14
?
0
3
23
39
?
0
2
10
7
New Mexico†
?
0
1
5
5
?
0
2
8
5
?
0
2
12
13
Utah
?
0
2
1
10
?
0
1
5
8
?
0
1
1
10
Wyoming†
?
0
1
2
4
?
0
0
?
3
?
0
1
2
?
Pacific
1
4
13
181
261
3
4
25
175
308
?
2
12
79
59
Alaska
?
0
1
2
4
?
0
1
4
5
U
0
0
U
U
California
1
3
12
139
216
?
2
22
110
216
?
1
4
36
26
Hawaii
?
0
2
8
7
?
0
1
6
6
U
0
0
U
U
Oregon
?
0
2
8
16
?
0
4
29
39
?
0
3
12
14
Washington
?
0
4
24
18
3
0
4
26
42
?
0
5
31
19
Territories
American Samoa
?
0
0
?
?
?
0
0
?
?
?
0
0
?
?
C.N.M.I.
?
?
?
?
?
?
?
?
?
?
?
?
?
?
?
Guam
?
0
5
8
7
?
2
8
28
71
?
0
4
10
57
Puerto Rico
?
0
2
7
17
?
0
2
8
25
N
0
0
N
N
U.S. Virgin Islands
?
0
0
?
?
?
0
0
?
?
?
0
0
?
?
C.N.M.I.: Commonwealth of Northern Mariana Islands.
U: Unavailable. ?: No reported cases. N: Not reportable. NN: Not Nationally Notifiable. Cum: Cumulative year-to-date counts. Med: Median. Max: Maximum.
† Contains data reported through the National Electronic Disease Surveillance System (NEDSS).
TABLE II. (Continued) Provisional cases of selected notifiable diseases, United States, weeks ending December 3, 2011, and December 4, 2010 (48th week)*
Reporting area
Legionellosis
Lyme disease
Malaria
Current week
Previous 52 weeks
Cum 2011
Cum 2010
Current week
Previous 52 weeks
Cum 2011
Cum 2010
Current week
Previous 52 weeks
Cum 2011
Cum 2010
Med
Max
Med
Max
Med
Max
United States
31
54
167
3,554
3,123
284
398
1,972
30,194
29,071
9
26
114
1,247
1,586
New England
2
5
39
375
252
3
73
489
6,498
8,693
?
2
20
83
99
Connecticut
?
1
10
72
49
?
30
226
2,485
2,979
?
0
20
10
2
Maine†
?
0
3
18
11
?
14
66
877
674
?
0
2
6
6
Massachusetts
?
3
24
223
119
?
20
106
1,345
3,233
?
1
6
54
69
New Hampshire
?
0
3
23
22
?
15
84
1,082
1,287
?
0
1
2
4
Rhode Island†
2
0
9
28
42
?
1
31
137
179
?
0
2
5
15
Vermont†
?
0
2
11
9
3
6
67
572
341
?
0
1
6
3
Mid. Atlantic
9
15
82
1,192
890
260
209
1,217
18,745
10,483
1
7
12
302
491
New Jersey
?
2
16
180
146
78
98
591
8,127
3,590
?
0
2
8
101
New York (Upstate)
5
5
27
357
273
93
38
214
3,551
2,479
1
1
4
49
72
New York City
?
3
14
190
157
?
1
16
107
706
?
4
10
191
262
Pennsylvania
4
5
37
465
314
89
79
509
6,960
3,708
?
1
5
54
56
E.N. Central
11
12
51
769
648
?
15
133
1,385
3,785
2
3
10
145
156
Illinois
?
2
11
119
143
?
1
18
163
135
?
1
5
53
59
Indiana
2
2
6
104
55
?
1
15
99
78
?
0
2
9
15
Michigan
1
3
15
184
169
?
1
13
104
93
?
0
4
30
29
Ohio
8
5
34
361
220
?
1
9
48
38
2
1
4
41
39
Wisconsin
?
0
2
1
61
?
12
91
971
3,441
?
0
2
12
14
W.N. Central
?
1
8
77
119
?
1
13
126
2,075
?
1
45
35
67
Iowa
?
0
2
11
15
?
0
12
80
85
?
0
3
21
14
Kansas
?
0
2
10
12
?
0
2
13
10
?
0
2
9
11
Minnesota
?
0
4
?
35
?
0
3
?
1,949
?
0
45
?
3
Missouri
?
1
5
46
34
?
0
0
?
4
?
0
1
?
20
Nebraska†
?
0
1
6
9
?
0
2
8
8
?
0
1
4
15
North Dakota
?
0
1
2
5
?
0
10
21
18
?
0
0
?
1
South Dakota
?
0
1
2
9
?
0
2
4
1
?
0
1
1
3
S. Atlantic
7
10
29
521
522
16
50
173
3,198
3,684
6
8
24
410
422
Delaware
?
0
4
21
16
2
12
48
786
630
?
0
3
7
2
District of Columbia
?
0
3
9
17
?
0
3
31
40
?
0
1
5
12
Florida
4
4
13
175
159
7
2
7
116
77
5
2
7
98
124
Georgia
?
1
3
35
60
?
0
5
25
10
?
1
5
73
67
Maryland†
3
1
14
119
108
4
17
114
1,170
1,584
?
2
14
118
96
North Carolina
?
1
7
62
60
?
0
12
66
73
1
0
6
36
49
South Carolina†
?
0
5
20
16
?
0
6
33
29
?
0
1
5
6
Virginia†
?
1
6
74
72
3
15
76
894
1,121
?
1
8
68
63
West Virginia
?
0
2
6
14
?
0
14
77
120
?
0
0
?
3
E.S. Central
1
2
10
146
130
1
1
5
57
42
?
0
4
31
31
Alabama†
?
0
2
26
20
1
0
2
19
2
?
0
3
6
9
Kentucky
?
1
3
35
27
?
0
1
2
5
?
0
1
7
8
Mississippi
?
0
3
13
12
?
0
1
3
?
?
0
1
1
2
Tennessee†
1
1
8
72
71
?
0
4
33
35
?
0
3
17
12
W.S. Central
?
2
13
122
161
?
1
29
45
106
?
0
18
28
91
Arkansas†
?
0
2
13
18
?
0
0
?
?
?
0
1
5
4
Louisiana
?
0
3
15
10
?
0
1
1
3
?
0
1
1
5
Oklahoma
?
0
3
9
13
?
0
0
?
?
?
0
1
5
5
Texas†
?
2
11
85
120
?
1
29
44
103
?
0
17
17
77
Mountain
1
2
8
99
161
?
0
4
35
27
?
1
4
59
60
Arizona
1
1
4
41
61
?
0
2
10
2
?
0
4
22
24
Colorado
?
0
1
6
30
?
0
1
1
3
?
0
3
21
21
Idaho†
?
0
1
8
7
?
0
2
4
9
?
0
1
2
3
Montana†
?
0
1
1
4
?
0
3
9
4
?
0
1
2
2
Nevada†
?
0
2
14
19
?
0
1
4
1
?
0
2
8
6
New Mexico†
?
0
2
10
9
?
0
2
5
5
?
0
1
3
1
Utah
?
0
2
15
23
?
0
1
1
3
?
0
1
1
3
Wyoming†
?
0
2
4
8
?
0
1
1
?
?
0
0
?
?
Pacific
?
5
21
253
240
4
2
11
105
176
?
3
11
154
169
Alaska
?
0
0
?
2
?
0
2
12
7
?
0
2
5
4
California
?
4
15
212
197
2
1
9
66
117
?
2
8
105
112
Hawaii
?
0
1
2
2
N
0
0
N
N
?
0
1
7
4
Oregon
?
0
3
19
15
?
0
2
12
39
?
0
4
16
14
Washington
?
0
6
20
24
2
0
6
15
13
?
0
3
21
35
Territories
American Samoa
N
0
0
N
N
N
0
0
N
N
?
0
1
1
?
C.N.M.I.
?
?
?
?
?
?
?
?
?
?
?
?
?
?
?
Guam
?
0
0
?
1
?
0
0
?
?
?
0
0
?
?
Puerto Rico
?
0
1
?
1
N
0
0
N
N
?
0
0
?
5
U.S. Virgin Islands
?
0
0
?
?
?
0
0
?
?
?
0
0
?
?
C.N.M.I.: Commonwealth of Northern Mariana Islands.
U: Unavailable. ?: No reported cases. N: Not reportable. NN: Not Nationally Notifiable. Cum: Cumulative year-to-date counts. Med: Median. Max: Maximum.
† Contains data reported through the National Electronic Disease Surveillance System (NEDSS).
TABLE II. (Continued) Provisional cases of selected notifiable diseases, United States, weeks ending December 3, 2011, and December 4, 2010 (48th week)*
Reporting area
Meningococcal disease, invasive† All serogroups
Mumps
Pertussis
Current week
Previous 52 weeks
Cum 2011
Cum 2010
Current week
Previous 52 weeks
Cum 2011
Cum 2010
Current week
Previous 52 weeks
Cum 2011
Cum 2010
Med
Max
Med
Max
Med
Max
United States
4
13
53
621
730
4
7
47
308
2,519
178
276
2,925
13,188
22,587
New England
?
0
3
28
19
?
0
2
11
25
3
12
31
637
492
Connecticut
?
0
1
3
3
?
0
0
?
11
?
1
5
55
105
Maine§
?
0
1
5
4
?
0
2
2
2
1
2
19
191
45
Massachusetts
?
0
2
14
6
?
0
1
4
9
?
4
10
207
266
New Hampshire
?
0
1
1
?
?
0
0
?
3
2
2
12
129
20
Rhode Island§
?
0
0
?
1
?
0
2
4
?
?
0
4
27
39
Vermont§
?
0
3
5
5
?
0
1
1
?
?
0
4
28
17
Mid. Atlantic
2
1
6
72
75
?
1
23
34
2,109
70
30
125
1,546
1,618
New Jersey
?
0
1
5
21
?
0
2
10
350
?
3
10
158
161
New York (Upstate)
1
0
4
22
11
?
0
3
11
663
50
12
81
691
529
New York City
?
0
3
26
18
?
0
22
10
1,039
?
0
36
74
80
Pennsylvania
1
0
2
19
25
?
0
8
3
57
20
12
67
623
848
E.N. Central
?
2
6
92
124
?
2
7
80
70
20
60
198
2,771
5,231
Illinois
?
0
3
27
22
?
1
5
54
26
?
15
46
757
955
Indiana
?
0
2
18
28
?
0
0
?
4
?
4
21
219
706
Michigan
?
0
2
11
22
?
0
2
10
18
?
12
43
599
1,429
Ohio
?
0
2
23
31
?
0
5
13
18
20
13
80
698
1,626
Wisconsin
?
0
2
13
21
?
0
1
3
4
?
11
24
498
515
W.N. Central
?
1
3
49
52
?
0
4
32
81
1
20
501
1,071
2,288
Iowa
?
0
1
12
10
?
0
1
5
38
?
4
15
173
654
Kansas
?
0
1
4
7
?
0
1
4
4
1
2
10
96
169
Minnesota
?
0
2
?
6
?
0
4
1
4
?
0
469
326
648
Missouri
?
0
3
18
22
?
0
3
12
10
?
7
37
344
535
Nebraska§
?
0
2
11
5
?
0
1
6
23
?
1
7
51
203
North Dakota
?
0
1
1
2
?
0
3
4
?
?
0
10
51
50
South Dakota
?
0
1
3
?
?
0
0
?
2
?
0
7
30
29
S. Atlantic
2
2
8
122
126
1
0
4
34
55
23
26
106
1,269
1,744
Delaware
?
0
1
1
1
?
0
0
?
?
?
0
5
22
14
District of Columbia
?
0
1
1
1
?
0
0
?
3
?
0
2
3
12
Florida
2
1
5
49
57
1
0
2
9
8
10
6
17
301
295
Georgia
?
0
1
14
12
?
0
2
5
5
2
3
8
157
235
Maryland§
?
0
1
11
9
?
0
1
1
11
5
2
7
99
129
North Carolina
?
0
3
14
13
?
0
2
9
9
1
2
35
159
331
South Carolina§
?
0
1
9
12
?
0
1
1
4
1
2
25
134
349
Virginia§
?
0
2
16
19
?
0
4
9
13
4
6
41
334
262
West Virginia
?
0
3
7
2
?
0
0
?
2
?
0
41
60
117
E.S. Central
?
0
2
22
42
?
0
1
4
10
7
8
28
358
778
Alabama§
?
0
2
10
7
?
0
1
1
6
1
2
11
127
194
Kentucky
?
0
2
2
17
?
0
0
?
1
6
1
16
95
271
Mississippi
?
0
1
3
5
?
0
1
3
?
?
0
4
37
102
Tennessee§
?
0
2
7
13
?
0
0
?
3
?
2
10
99
211
W.S. Central
?
1
12
54
83
2
1
15
63
111
10
20
297
854
2,804
Arkansas§
?
0
2
12
6
?
0
2
3
5
?
1
16
55
204
Louisiana
?
0
2
11
14
?
0
0
?
8
?
0
3
17
43
Oklahoma
?
0
2
10
15
?
0
2
4
?
?
0
92
52
89
Texas§
?
0
10
21
48
2
1
14
56
98
10
18
187
730
2,468
Mountain
?
1
4
43
52
?
0
2
8
18
25
37
100
1,827
1,652
Arizona
?
0
1
11
13
?
0
0
?
5
3
14
29
646
475
Colorado
?
0
1
9
20
?
0
1
3
7
11
8
63
390
395
Idaho§
?
0
1
5
5
?
0
2
2
1
11
2
11
157
184
Montana§
?
0
2
4
1
?
0
0
?
?
?
1
32
130
100
Nevada§
?
0
1
4
8
?
0
0
?
1
?
0
5
30
32
New Mexico§
?
0
1
2
3
?
0
2
2
?
?
3
21
238
137
Utah
?
0
2
8
1
?
0
0
?
3
?
5
16
227
317
Wyoming§
?
0
1
?
1
?
0
1
1
1
?
0
1
9
12
Pacific
?
3
26
139
157
1
0
11
42
40
19
60
1,710
2,855
5,980
Alaska
?
0
1
3
1
?
0
1
1
1
?
0
4
25
40
California
?
2
17
97
103
?
0
11
33
26
?
42
1,569
1,873
5,206
Hawaii
?
0
1
4
1
?
0
1
2
4
?
1
9
78
62
Oregon
?
0
3
21
31
?
0
1
4
3
?
5
23
287
266
Washington
?
0
8
14
21
1
0
1
2
6
19
11
131
592
406
Territories
American Samoa
?
0
0
?
?
?
0
0
?
?
?
0
0
?
?
C.N.M.I.
?
?
?
?
?
?
?
?
?
?
?
?
?
?
?
Guam
?
0
0
?
?
?
1
3
12
484
?
1
14
31
3
Puerto Rico
?
0
0
?
2
?
0
1
1
1
?
0
1
2
4
U.S. Virgin Islands
?
0
0
?
?
?
0
0
?
?
?
0
0
?
?
C.N.M.I.: Commonwealth of Northern Mariana Islands.
U: Unavailable. ?: No reported cases. N: Not reportable. NN: Not Nationally Notifiable. Cum: Cumulative year-to-date counts. Med: Median. Max: Maximum.
† Data for meningococcal disease, invasive caused by serogroups A, C, Y, and W-135; serogroup B; other serogroup; and unknown serogroup are available in Table I.
§ Contains data reported through the National Electronic Disease Surveillance System (NEDSS).
TABLE II. (Continued) Provisional cases of selected notifiable diseases, United States, weeks ending December 3, 2011, and December 4, 2010 (48th week)*
Reporting area
Rabies, animal
Salmonellosis
Shiga toxin-producing E. coli(STEC)†
Current week
Previous 52 weeks
Cum 2011
Cum 2010
Current week
Previous 52 weeks
Cum 2011
Cum 2010
Current week
Previous 52 weeks
Cum 2011
Cum 2010
Med
Max
Med
Max
Med
Max
United States
21
58
119
2,788
4,091
468
859
1,851
43,645
50,794
49
90
264
4,681
4,971
New England
3
4
16
237
291
3
35
107
1,956
2,246
?
3
13
198
205
Connecticut
?
1
10
111
137
?
8
30
431
491
?
1
4
49
60
Maine§
2
1
6
61
59
?
2
8
124
122
?
0
3
28
21
Massachusetts
?
0
0
?
?
?
19
45
1,001
1,234
?
1
9
75
79
New Hampshire
1
0
3
18
16
?
3
8
153
166
?
0
3
23
21
Rhode Island§
?
0
6
23
29
3
1
62
173
156
?
0
2
7
3
Vermont§
?
0
2
24
50
?
1
8
74
77
?
0
3
16
21
Mid. Atlantic
7
16
35
800
1,006
19
85
205
4,914
5,563
8
11
36
571
539
New Jersey
?
0
0
?
?
?
14
48
836
1,154
?
2
7
109
121
New York (Upstate)
7
7
20
351
474
13
25
67
1,313
1,345
8
3
12
200
189
New York City
?
0
3
9
145
?
19
42
1,043
1,258
?
1
6
86
72
Pennsylvania
?
8
21
440
387
6
30
111
1,722
1,806
?
3
18
176
157
E.N. Central
2
2
17
177
226
19
84
157
4,120
5,572
1
12
48
793
775
Illinois
?
0
6
49
114
?
29
80
1,499
1,892
?
3
14
180
147
Indiana
?
0
7
26
?
?
7
19
350
735
?
2
8
86
137
Michigan
1
1
6
57
66
5
13
42
780
889
?
3
19
169
142
Ohio
1
1
5
45
46
14
22
46
1,137
1,240
1
3
10
175
132
Wisconsin
N
0
0
N
N
?
7
45
354
816
?
2
20
183
217
W.N. Central
1
1
40
77
241
6
40
103
2,178
2,845
1
12
39
719
866
Iowa
?
0
1
?
27
?
9
19
418
513
?
2
15
180
169
Kansas
1
0
4
31
59
4
8
28
434
418
?
2
8
103
74
Minnesota
?
0
34
?
25
?
0
16
?
680
?
0
7
?
281
Missouri
?
0
0
?
63
?
17
46
902
770
?
5
32
281
220
Nebraska§
?
0
3
33
51
2
4
13
232
237
1
2
7
95
73
North Dakota
?
0
6
13
16
?
0
15
41
49
?
0
4
13
17
South Dakota
?
0
0
?
?
?
3
10
151
178
?
1
4
47
32
S. Atlantic
8
17
93
1,006
1,083
302
264
722
13,617
14,892
18
12
27
610
692
Delaware
?
0
0
?
?
?
3
11
164
170
?
0
2
15
6
District of Columbia
?
0
0
?
?
3
1
5
50
90
?
0
1
3
9
Florida
?
0
84
112
121
177
107
203
5,506
5,900
9
3
15
140
210
Georgia
?
0
0
?
?
27
41
127
2,296
2,709
1
2
8
111
97
Maryland§
?
5
13
247
354
18
19
42
900
1,010
1
1
6
55
98
North Carolina
?
0
0
?
?
51
30
251
2,121
2,160
7
2
11
112
92
South Carolina§
N
0
0
N
N
23
28
70
1,456
1,607
?
0
4
15
23
Virginia§
7
11
27
566
532
3
22
68
1,079
1,076
?
3
9
156
134
West Virginia
1
0
30
81
76
?
0
14
45
170
?
0
2
3
23
E.S. Central
?
3
11
165
169
21
57
187
3,814
3,785
3
3
17
233
263
Alabama§
?
1
7
76
69
13
18
70
1,157
1,008
?
0
15
70
53
Kentucky
?
0
2
16
21
?
9
21
438
559
1
1
5
45
68
Mississippi
?
0
1
1
?
?
20
66
1,267
1,181
?
0
4
20
30
Tennessee§
?
1
6
72
79
8
16
52
952
1,037
2
1
11
98
112
W.S. Central
?
1
31
108
809
46
124
515
6,006
6,972
6
8
151
376
344
Arkansas§
?
0
10
53
33
14
13
53
820
750
?
1
6
56
48
Louisiana
?
0
0
?
?
?
14
44
896
1,308
?
0
1
10
20
Oklahoma
?
0
21
55
42
15
11
95
685
637
4
1
55
67
41
Texas§
?
0
15
?
734
17
83
381
3,605
4,277
2
5
95
243
235
Mountain
?
0
4
39
66
9
45
92
2,286
2,751
2
10
26
522
649
Arizona
N
0
0
N
N
3
14
33
732
948
?
2
7
81
93
Colorado
?
0
0
?
?
4
10
24
507
542
2
2
7
105
215
Idaho§
?
0
1
6
11
1
3
8
138
157
?
2
8
113
100
Montana§
N
0
0
N
N
?
2
10
120
92
?
1
5
38
40
Nevada§
?
0
2
16
8
?
3
8
153
291
?
1
7
39
40
New Mexico§
?
0
2
10
13
?
5
22
300
323
?
1
3
39
49
Utah
?
0
2
7
10
?
5
15
281
338
?
1
7
82
93
Wyoming§
?
0
0
?
24
1
1
9
55
60
?
0
7
25
19
Pacific
?
3
15
179
200
43
101
288
4,754
6,168
10
15
46
659
638
Alaska
?
0
2
12
12
1
1
6
52
79
?
0
1
4
2
California
?
3
11
153
171
15
74
232
3,626
4,589
5
8
36
405
293
Hawaii
?
0
0
?
?
8
7
14
321
313
?
0
1
7
28
Oregon
?
0
1
14
17
2
5
12
241
493
?
1
11
98
112
Washington
?
0
14
?
?
17
10
42
514
694
5
2
13
145
203
Territories
American Samoa
N
0
0
N
N
?
0
0
?
2
?
0
0
?
?
C.N.M.I.
?
?
?
?
?
?
?
?
?
?
?
?
?
?
?
Guam
?
0
0
?
?
?
0
3
6
11
?
0
0
?
?
Puerto Rico
1
0
6
35
40
1
4
16
189
584
?
0
0
?
?
U.S. Virgin Islands
?
0
0
?
?
?
0
0
?
?
?
0
0
?
?
C.N.M.I.: Commonwealth of Northern Mariana Islands.
U: Unavailable. ?: No reported cases. N: Not reportable. NN: Not Nationally Notifiable. Cum: Cumulative year-to-date counts. Med: Median. Max: Maximum.
† Includes E. coli O157:H7; Shiga toxin-positive, serogroup non-O157; and Shiga toxin-positive, not serogrouped.
§ Contains data reported through the National Electronic Disease Surveillance System (NEDSS).
TABLE II. (Continued) Provisional cases of selected notifiable diseases, United States, weeks ending December 3, 2011, and December 4, 2010 (48th week)*
Spotted Fever Rickettsiosis (including RMSF)†
Reporting area
Shigellosis
Confirmed
Probable
Current week
Previous 52 weeks
Cum 2011
Cum 2010
Current week
Previous 52 weeks
Cum 2011
Cum 2010
Current week
Previous 52 weeks
Cum 2011
Cum 2010
Med
Max
Med
Max
Med
Max
United States
180
239
742
10,670
13,232
1
3
15
193
133
3
28
245
1,887
1,538
New England
?
4
20
253
311
?
0
1
1
?
?
0
1
8
5
Connecticut
?
0
4
38
69
?
0
0
?
?
?
0
0
?
?
Maine§
?
0
8
32
8
?
0
0
?
?
?
0
1
1
2
Massachusetts
?
3
19
166
207
?
0
0
?
?
?
0
1
4
?
New Hampshire
?
0
1
3
14
?
0
1
1
?
?
0
1
1
1
Rhode Island§
?
0
4
8
12
?
0
0
?
?
?
0
1
2
2
Vermont§
?
0
1
6
1
?
0
0
?
?
?
0
0
?
?
Mid. Atlantic
16
16
74
911
1,526
?
0
2
17
2
1
1
4
56
100
New Jersey
?
3
16
172
356
?
0
0
?
1
?
0
1
?
59
New York (Upstate)
13
4
20
295
214
?
0
1
3
1
1
0
1
8
16
New York City
?
5
24
329
290
?
0
0
?
?
?
0
3
29
11
Pennsylvania
3
2
56
115
666
?
0
2
14
?
?
0
3
19
14
E.N. Central
5
15
40
701
1,474
?
0
2
8
3
?
2
9
112
77
Illinois
?
5
16
204
810
?
0
1
2
2
?
1
4
47
34
Indiana§
?
1
4
45
61
?
0
1
2
1
?
0
4
46
20
Michigan
2
3
10
164
241
?
0
1
1
?
?
0
1
2
1
Ohio
3
4
27
288
289
?
0
2
3
?
?
0
2
17
15
Wisconsin
?
0
1
?
73
?
0
0
?
?
?
0
0
?
7
W.N. Central
1
6
22
284
2,012
?
0
4
27
13
?
4
29
340
273
Iowa
?
0
4
20
49
?
0
0
?
?
?
0
2
5
5
Kansas§
1
1
7
59
282
?
0
0
?
?
?
0
0
?
?
Minnesota
?
0
2
?
63
?
0
0
?
?
?
0
2
?
?
Missouri
?
4
17
186
1,556
?
0
3
19
10
?
4
29
330
265
Nebraska§
?
0
2
14
55
?
0
3
5
3
?
0
1
5
2
North Dakota
?
0
0
?
?
?
0
1
2
?
?
0
0
?
1
South Dakota
?
0
2
5
7
?
0
1
1
?
?
0
0
?
?
S. Atlantic
72
70
134
3,522
2,533
1
1
8
103
80
?
6
55
521
488
Delaware§
?
0
2
6
39
?
0
1
1
1
?
0
4
18
21
District of Columbia
3
0
2
15
32
?
0
1
1
1
?
0
1
3
?
Florida§
50
49
98
2,466
1,062
?
0
1
3
3
?
0
2
12
11
Georgia
10
11
24
543
753
?
1
6
65
57
?
0
0
?
?
Maryland§
4
2
7
96
125
1
0
1
4
?
?
0
2
30
49
North Carolina
5
3
19
197
219
?
0
4
14
13
?
0
49
250
255
South Carolina§
?
1
51
102
68
?
0
2
11
1
?
0
2
21
19
Virginia§
?
2
8
93
132
?
0
1
4
4
?
3
14
183
133
West Virginia
?
0
5
4
103
?
0
0
?
?
?
0
1
4
?
E.S. Central
21
15
44
707
734
?
0
2
12
20
2
4
25
328
400
Alabama§
8
5
21
266
211
?
0
1
4
5
1
1
8
71
78
Kentucky
5
1
6
51
219
?
0
1
3
6
?
0
0
?
?
Mississippi
6
4
23
214
55
?
0
0
?
1
?
0
2
12
24
Tennessee§
2
4
11
176
249
?
0
2
5
8
1
3
20
245
298
W.S. Central
60
51
503
2,549
2,695
?
0
8
11
6
?
2
235
472
181
Arkansas§
2
2
7
76
72
?
0
3
6
2
?
0
50
403
126
Louisiana
?
4
21
250
276
?
0
0
?
?
?
0
2
7
3
Oklahoma
15
2
161
193
251
?
0
5
3
3
?
0
202
43
26
Texas§
43
40
338
2,030
2,096
?
0
1
2
1
?
0
5
19
26
Mountain
3
15
42
766
797
?
0
5
13
3
?
1
8
50
13
Arizona
1
5
27
355
436
?
0
4
12
1
?
0
7
35
1
Colorado§
1
1
8
93
92
?
0
1
?
?
?
0
1
2
1
Idaho§
?
0
3
16
23
?
0
1
1
?
?
0
1
1
5
Montana§
1
1
15
122
8
?
0
0
?
2
?
0
1
1
1
Nevada§
?
0
4
31
48
?
0
0
?
?
?
0
1
2
?
New Mexico§
?
2
7
101
144
?
0
0
?
?
?
0
0
?
1
Utah
?
1
4
46
46
?
0
0
?
?
?
0
1
1
3
Wyoming§
?
0
1
2
?
?
0
0
?
?
?
0
2
8
1
Pacific
2
20
63
977
1,150
?
0
2
1
6
?
0
0
?
1
Alaska
?
0
2
5
2
N
0
0
N
N
N
0
0
N
N
California
?
16
59
806
939
?
0
1
1
6
?
0
0
?
?
Hawaii
?
1
3
42
45
N
0
0
N
N
N
0
0
N
N
Oregon
?
1
4
41
58
?
0
0
?
?
?
0
0
?
1
Washington
2
1
6
83
106
?
0
1
?
?
?
0
0
?
?
Territories
American Samoa
?
0
1
1
4
N
0
0
N
N
N
0
0
N
N
C.N.M.I.
?
?
?
?
?
?
?
?
?
?
?
?
?
?
?
Guam
?
0
1
1
5
N
0
0
N
N
N
0
0
N
N
Puerto Rico
?
0
1
?
6
N
0
0
N
N
N
0
0
N
N
U.S. Virgin Islands
?
0
0
?
?
?
0
0
?
?
?
0
0
?
?
C.N.M.I.: Commonwealth of Northern Mariana Islands.
U: Unavailable. ?: No reported cases. N: Not reportable. NN: Not Nationally Notifiable. Cum: Cumulative year-to-date counts. Med: Median. Max: Maximum.
† Illnesses with similar clinical presentation that result from Spotted fever group rickettsia infections are reported as Spotted fever rickettsioses. Rocky Mountain spotted fever (RMSF) caused by Rickettsia rickettsii, is the most common and well-known spotted fever.
§ Contains data reported through the National Electronic Disease Surveillance System (NEDSS).
TABLE II. (Continued) Provisional cases of selected notifiable diseases, United States, weeks ending December 3, 2011, and December 4, 2010 (48th week)*
Streptococcus pneumoniae,† invasive disease
Reporting area
All ages
Age <5
Syphilis, primary and secondary
Current week
Previous 52 weeks
Cum 2011
Cum 2010
Current week
Previous 52 weeks
Cum 2011
Cum 2010
Current week
Previous 52 weeks
Cum 2011
Cum 2010
Med
Max
Med
Max
Med
Max
United States
184
251
937
12,176
14,211
20
26
118
1,123
1,949
88
262
363
11,818
12,690
New England
5
14
79
661
814
?
1
5
42
97
6
7
16
345
446
Connecticut
?
6
49
282
335
?
0
3
10
27
?
0
5
41
88
Maine§
2
2
13
119
108
?
0
1
4
9
?
0
2
12
31
Massachusetts
?
0
4
32
65
?
0
2
15
43
5
5
10
227
269
New Hampshire
1
2
8
90
118
?
0
1
5
5
?
0
3
18
22
Rhode Island§
?
2
8
73
110
?
0
1
2
7
1
0
7
39
34
Vermont§
2
1
6
65
78
?
0
2
6
6
?
0
2
8
2
Mid. Atlantic
7
25
81
1,208
1,501
5
2
27
102
225
17
30
53
1,416
1,590
New Jersey
1
12
35
553
666
?
0
4
33
54
?
4
13
203
228
New York (Upstate)
6
1
10
80
142
5
1
9
45
109
9
3
20
172
121
New York City
?
12
42
575
693
?
0
14
24
62
?
14
31
707
895
Pennsylvania
N
0
0
N
N
N
0
0
N
N
8
6
14
334
346
E.N. Central
46
60
114
2,726
2,941
5
5
13
226
347
1
30
48
1,381
1,779
Illinois
N
0
0
N
N
?
1
6
73
92
?
13
24
568
849
Indiana
?
14
33
612
690
?
1
4
30
54
?
3
8
147
162
Michigan
5
14
29
595
665
1
1
3
32
77
?
5
12
238
224
Ohio
41
26
45
1,141
1,113
4
2
7
76
91
1
8
21
378
496
Wisconsin
?
8
24
378
473
?
0
3
15
33
?
1
5
50
48
W.N. Central
?
2
33
162
789
?
1
4
64
152
?
6
13
267
336
Iowa
N
0
0
N
N
N
0
0
N
N
?
0
3
17
18
Kansas
N
0
0
N
N
N
0
0
N
N
?
0
4
24
18
Minnesota
?
0
17
?
596
?
0
3
?
84
?
2
8
105
141
Missouri
N
0
0
N
N
?
0
4
36
39
?
2
6
112
144
Nebraska§
?
2
9
108
126
?
0
2
12
16
?
0
2
8
9
North Dakota
?
0
25
54
67
?
0
1
2
2
?
0
1
1
2
South Dakota
N
0
0
N
N
?
0
2
14
11
?
0
0
?
4
S. Atlantic
67
65
170
3,373
3,789
5
6
25
304
520
30
68
178
3,110
2,947
Delaware
1
1
6
42
39
?
0
1
?
?
?
0
4
18
4
District of Columbia
?
1
4
43
71
?
0
1
5
8
?
3
8
144
125
Florida
28
22
68
1,219
1,339
3
3
13
121
182
2
24
36
1,092
1,099
Georgia
20
20
54
914
1,278
2
2
5
74
152
13
14
130
700
637
Maryland§
9
10
33
495
487
?
1
3
36
51
?
8
20
390
295
North Carolina
N
0
0
N
N
N
0
0
N
N
10
8
19
356
376
South Carolina§
9
8
25
405
457
?
0
3
28
53
3
4
11
208
136
Virginia§
N
0
0
N
N
?
0
3
26
52
2
4
12
200
269
West Virginia
?
0
48
255
118
?
0
6
14
22
?
0
1
2
6
E.S. Central
14
18
37
823
971
2
1
4
67
107
9
15
34
692
814
Alabama§
N
0
0
N
N
N
0
0
N
N
?
4
11
196
234
Kentucky
N
0
0
N
N
N
0
0
N
N
5
2
16
110
119
Mississippi
N
0
0
N
N
?
0
2
11
17
4
3
14
167
200
Tennessee§
14
18
37
823
971
2
1
4
56
90
?
5
11
219
261
W.S. Central
28
30
368
1,621
1,718
2
4
38
185
270
5
36
50
1,653
1,967
Arkansas§
6
4
26
203
156
?
0
3
13
17
5
3
10
174
200
Louisiana
?
2
11
138
124
?
0
2
14
25
?
6
25
345
524
Oklahoma
N
0
0
N
N
?
1
8
32
44
?
2
8
88
86
Texas§
22
25
333
1,280
1,438
2
2
27
126
184
?
23
33
1,046
1,157
Mountain
16
28
72
1,457
1,586
1
3
8
118
214
6
11
20
525
563
Arizona
7
12
45
680
720
?
1
5
53
92
1
4
10
215
207
Colorado
8
9
23
467
499
?
0
4
33
62
?
2
6
102
134
Idaho§
N
0
0
N
N
1
0
1
5
8
?
0
4
11
2
Montana§
N
0
0
N
N
N
0
0
N
N
?
0
1
4
3
Nevada§
N
0
0
N
N
N
0
0
N
N
5
2
9
126
109
New Mexico§
1
4
13
216
148
?
0
2
15
16
?
1
4
57
49
Utah
?
1
8
74
205
?
0
3
12
32
?
0
2
10
59
Wyoming§
?
0
15
20
14
?
0
1
?
4
?
0
0
?
?
Pacific
1
3
11
145
102
?
0
2
15
17
14
55
74
2,429
2,248
Alaska
1
2
11
139
102
?
0
1
11
17
?
0
1
3
3
California
N
0
0
N
N
N
0
0
N
N
8
42
61
1,974
1,902
Hawaii
?
0
3
6
?
?
0
1
4
?
?
0
2
11
35
Oregon
N
0
0
N
N
N
0
0
N
N
2
4
14
175
65
Washington
N
0
0
N
N
N
0
0
N
N
4
5
11
266
243
Territories
American Samoa
N
0
0
N
N
?
0
0
?
?
?
0
0
?
?
C.N.M.I.
?
?
?
?
?
?
?
?
?
?
?
?
?
?
?
Guam
?
0
0
?
?
?
0
0
?
?
?
0
0
?
?
Puerto Rico
?
0
0
?
?
?
0
0
?
?
10
4
14
225
207
U.S. Virgin Islands
?
0
0
?
?
?
0
0
?
?
?
0
0
?
?
C.N.M.I.: Commonwealth of Northern Mariana Islands.
U: Unavailable. ?: No reported cases. N: Not reportable. NN: Not Nationally Notifiable. Cum: Cumulative year-to-date counts. Med: Median. Max: Maximum.
† Includes drug resistant and susceptible cases of invasive Streptococcus pneumoniae disease among children <5 years and among all ages. Case definition: Isolation of S. pneumoniae from a normally sterile body site (e.g., blood or cerebrospinal fluid).
§ Contains data reported through the National Electronic Disease Surveillance System (NEDSS).
TABLE II. (Continued) Provisional cases of selected notifiable diseases, United States, weeks ending December 3, 2011, and December 4, 2010 (48th week)*
West Nile virus disease†
Reporting area
Varicella (chickenpox)
Neuroinvasive
Nonneuroinvasive§
Current week
Previous 52 weeks
Cum 2011
Cum 2010
Current week
Previous 52 weeks
Cum 2011
Cum 2010
Current week
Previous 52 weeks
Cum 2011
Cum 2010
Med
Max
Med
Max
Med
Max
United States
126
273
367
12,338
14,250
?
0
59
457
629
?
0
28
208
392
New England
4
23
50
1,121
1,093
?
0
3
14
14
?
0
1
2
5
Connecticut
3
5
16
262
309
?
0
2
8
7
?
0
1
1
4
Maine¶
?
4
11
201
224
?
0
0
?
?
?
0
0
?
?
Massachusetts
?
9
18
429
248
?
0
2
4
6
?
0
1
1
1
New Hampshire
?
2
7
102
153
?
0
0
?
1
?
0
0
?
?
Rhode Island¶
?
0
6
33
46
?
0
1
1
?
?
0
0
?
?
Vermont¶
1
1
10
94
113
?
0
1
1
?
?
0
0
?
?
Mid. Atlantic
30
44
78
2,306
1,606
?
0
11
34
123
?
0
6
22
63
New Jersey
17
24
68
1,382
545
?
0
1
2
15
?
0
2
5
15
New York (Upstate)
N
0
0
N
N
?
0
5
18
56
?
0
4
14
30
New York City
?
0
0
?
?
?
0
4
9
33
?
0
1
2
9
Pennsylvania
13
20
40
924
1,061
?
0
2
5
19
?
0
1
1
9
E.N. Central
46
63
115
2,759
4,593
?
0
13
73
80
?
0
6
27
30
Illinois
?
15
31
668
1,140
?
0
6
22
45
?
0
5
12
16
Indiana¶
4
5
18
231
342
?
0
2
7
6
?
0
1
2
7
Michigan
16
19
42
914
1,369
?
0
7
32
25
?
0
1
1
4
Ohio
26
21
58
944
1,261
?
0
3
10
4
?
0
3
11
1
Wisconsin
?
0
15
2
481
?
0
1
2
?
?
0
1
1
2
W.N. Central
2
13
42
660
913
?
0
9
31
32
?
0
7
28
75
Iowa
N
0
0
N
N
?
0
2
5
5
?
0
2
4
4
Kansas¶
?
7
35
377
353
?
0
1
4
4
?
0
0
?
15
Minnesota
?
0
1
1
?
?
0
1
1
4
?
0
1
1
4
Missouri
?
3
24
185
443
?
0
2
6
3
?
0
2
4
?
Nebraska¶
?
0
4
7
21
?
0
4
14
10
?
0
3
14
29
North Dakota
?
0
10
36
39
?
0
1
1
2
?
0
1
3
7
South Dakota
2
1
6
54
57
?
0
0
?
4
?
0
1
2
16
S. Atlantic
23
32
64
1,602
2,009
?
0
10
51
38
?
0
4
18
22
Delaware¶
?
0
1
6
39
?
0
1
1
?
?
0
0
?
?
District of Columbia
?
0
2
12
20
?
0
1
3
3
?
0
1
1
3
Florida¶
20
16
38
805
929
?
0
5
19
9
?
0
2
2
3
Georgia
N
0
0
N
N
?
0
2
7
4
?
0
1
5
9
Maryland¶
N
0
0
N
N
?
0
5
10
17
?
0
3
10
6
North Carolina
N
0
0
N
N
?
0
1
2
?
?
0
0
?
?
South Carolina¶
?
0
9
12
77
?
0
0
?
1
?
0
0
?
?
Virginia¶
3
7
25
399
517
?
0
2
8
4
?
0
0
?
1
West Virginia
?
5
32
368
427
?
0
1
1
?
?
0
0
?
?
E.S. Central
1
5
15
243
286
?
0
11
55
8
?
0
5
25
10
Alabama¶
1
5
14
231
278
?
0
2
5
1
?
0
0
?
2
Kentucky
N
0
0
N
N
?
0
2
4
2
?
0
1
1
1
Mississippi
?
0
3
12
8
?
0
5
30
3
?
0
4
22
5
Tennessee¶
N
0
0
N
N
?
0
3
16
2
?
0
1
2
2
W.S. Central
9
51
258
2,496
2,638
?
0
4
26
104
?
0
3
11
20
Arkansas¶
4
5
20
275
183
?
0
1
1
6
?
0
0
?
1
Louisiana
?
1
6
74
83
?
0
2
6
20
?
0
2
4
7
Oklahoma
N
0
0
N
N
?
0
0
?
1
?
0
0
?
?
Texas¶
5
44
247
2,147
2,372
?
0
3
19
77
?
0
3
7
12
Mountain
11
17
65
1,025
998
?
0
10
64
157
?
0
4
30
127
Arizona
2
4
50
413
?
?
0
6
42
107
?
0
3
16
60
Colorado¶
9
4
31
259
378
?
0
2
2
26
?
0
2
5
55
Idaho¶
N
0
0
N
N
?
0
1
1
?
?
0
1
1
1
Montana¶
?
2
28
127
185
?
0
1
1
?
?
0
0
?
?
Nevada¶
N
0
0
N
N
?
0
4
12
?
?
0
2
4
2
New Mexico¶
?
1
4
40
94
?
0
1
4
21
?
0
0
?
4
Utah
?
3
26
178
320
?
0
1
1
1
?
0
1
2
1
Wyoming¶
?
0
1
8
21
?
0
1
1
2
?
0
1
2
4
Pacific
?
3
9
126
114
?
0
18
109
73
?
0
7
45
40
Alaska
?
1
4
64
44
?
0
0
?
?
?
0
0
?
?
California
?
0
4
22
34
?
0
18
109
72
?
0
7
45
39
Hawaii
?
1
4
40
36
?
0
0
?
?
?
0
0
?
?
Oregon
N
0
0
N
N
?
0
0
?
?
?
0
0
?
?
Washington
N
0
0
N
N
?
0
0
?
1
?
0
0
?
1
Territories
American Samoa
N
0
0
N
N
?
0
0
?
?
?
0
0
?
?
C.N.M.I.
?
?
?
?
?
?
?
?
?
?
?
?
?
?
?
Guam
?
2
4
16
25
?
0
0
?
?
?
0
0
?
?
Puerto Rico
1
4
14
175
594
?
0
0
?
?
?
0
0
?
?
U.S. Virgin Islands
?
0
0
?
?
?
0
0
?
?
?
0
0
?
?
C.N.M.I.: Commonwealth of Northern Mariana Islands.
U: Unavailable. ?: No reported cases. N: Not reportable. NN: Not Nationally Notifiable. Cum: Cumulative year-to-date counts. Med: Median. Max: Maximum.
† Updated weekly from reports to the Division of Vector-Borne Infectious Diseases, National Center for Zoonotic, Vector-Borne, and Enteric Diseases (ArboNET Surveillance). Data for California serogroup, eastern equine, Powassan, St. Louis, and western equine diseases are available in Table I.
§ Not reportable in all states. Data from states where the condition is not reportable are excluded from this table, except starting in 2007 for the domestic arboviral diseases and influenza-associated pediatric mortality, and in 2003 for SARS-CoV. Reporting exceptions are available at http://www.cdc.gov/osels/ph_surveillance/nndss/phs/infdis.htm.
¶ Contains data reported through the National Electronic Disease Surveillance System (NEDSS).
TABLE III. Deaths in 122 U.S. cities,* week ending December 3, 2011 (48th week)
Reporting area
All causes, by age (years)
P&I† Total
Reporting area (Continued)
All causes, by age (years)
P&I† Total
All Ages
=65
45?64
25?44
1?24
<1
All Ages
=65
45?64
25?44
1?24
<1
New England
598
402
131
30
19
16
56
S. Atlantic
1,255
811
306
88
28
21
80
Boston, MA
168
105
38
10
4
11
15
Atlanta, GA
172
103
44
13
8
4
12
Bridgeport, CT
28
16
12
?
?
?
5
Baltimore, MD
174
106
51
12
4
1
7
Cambridge, MA
13
12
1
?
?
?
2
Charlotte, NC
146
96
30
15
2
3
16
Fall River, MA
23
18
4
?
1
?
?
Jacksonville, FL
16
11
3
2
?
?
?
Hartford, CT
68
47
11
4
4
2
8
Miami, FL
109
64
38
4
3
?
4
Lowell, MA
17
10
6
?
1
?
2
Norfolk, VA
50
38
10
1
?
1
?
Lynn, MA
3
2
1
?
?
?
?
Richmond, VA
75
51
16
5
1
2
3
New Bedford, MA
27
20
1
2
3
1
1
Savannah, GA
63
47
13
1
?
2
11
New Haven, CT
38
20
11
5
?
2
3
St. Petersburg, FL
66
47
12
3
1
3
1
Providence, RI
77
57
9
7
4
?
4
Tampa, FL
244
160
58
20
1
4
14
Somerville, MA
7
4
3
?
?
?
?
Washington, D.C.
127
79
29
10
8
1
11
Springfield, MA
43
29
12
1
1
?
4
Wilmington, DE
13
9
2
2
?
?
1
Waterbury, CT
22
11
9
1
1
?
2
E.S. Central
978
671
209
68
17
12
84
Worcester, MA
64
51
13
?
?
?
10
Birmingham, AL
191
115
58
12
5
?
18
Mid. Atlantic
1,994
1,412
423
102
35
21
69
Chattanooga, TN
79
62
14
2
?
1
5
Albany, NY
44
32
8
4
?
?
1
Knoxville, TN
153
112
28
11
2
?
16
Allentown, PA
31
23
8
?
?
?
2
Lexington, KY
69
38
16
11
2
2
3
Buffalo, NY
73
49
16
3
3
2
4
Memphis, TN
180
123
33
19
4
1
18
Camden, NJ
27
12
9
4
1
1
1
Mobile, AL
97
65
21
5
2
4
6
Elizabeth, NJ
22
16
6
?
?
?
1
Montgomery, AL
41
32
9
?
?
?
7
Erie, PA
53
42
8
2
?
1
2
Nashville, TN
168
124
30
8
2
4
11
Jersey City, NJ
27
23
2
1
1
?
2
W.S. Central
1,168
762
284
77
28
16
69
New York City, NY
1,180
846
249
59
17
9
33
Austin, TX
97
57
27
9
4
?
7
Newark, NJ
53
26
20
4
2
?
3
Baton Rouge, LA
62
43
12
4
3
?
?
Paterson, NJ
18
11
4
2
1
?
?
Corpus Christi, TX
64
46
13
4
?
1
5
Philadelphia, PA
134
88
31
6
7
2
3
Dallas, TX
230
133
63
16
8
9
10
Pittsburgh, PA§
40
28
9
1
?
2
2
El Paso, TX
114
76
22
9
5
2
2
Reading, PA
34
31
1
1
?
1
2
Fort Worth, TX
U
U
U
U
U
U
U
Rochester, NY
89
59
20
6
2
2
5
Houston, TX
82
64
17
1
?
?
4
Schenectady, NY
20
16
3
1
?
?
2
Little Rock, AR
73
45
20
6
1
1
?
Scranton, PA
35
27
5
2
1
?
1
New Orleans, LA
U
U
U
U
U
U
U
Syracuse, NY
57
43
10
3
?
1
4
San Antonio, TX
298
200
73
19
3
3
23
Trenton, NJ
33
18
12
3
?
?
?
Shreveport, LA
?
?
?
?
?
?
?
Utica, NY
11
11
?
?
?
?
?
Tulsa, OK
148
98
37
9
4
?
18
Yonkers, NY
13
11
2
?
?
?
1
Mountain
1,096
739
230
84
18
22
62
E.N. Central
2,020
1,423
416
107
33
41
147
Albuquerque, NM
132
94
25
10
2
1
9
Akron, OH
53
31
20
1
1
?
8
Boise, ID
60
51
7
2
?
?
1
Canton, OH
36
26
6
1
2
1
2
Colorado Springs, CO
78
56
11
9
1
1
2
Chicago, IL
230
171
38
10
6
5
13
Denver, CO
81
52
18
10
1
?
2
Cincinnati, OH
91
58
16
5
3
9
10
Las Vegas, NV
168
110
39
13
3
2
9
Cleveland, OH
285
203
58
16
3
5
24
Ogden, UT
43
31
9
1
2
?
4
Columbus, OH
112
79
19
6
4
4
9
Phoenix, AZ
194
110
46
24
2
11
11
Dayton, OH
167
125
28
8
3
3
15
Pueblo, CO
45
36
7
2
?
?
3
Detroit, MI
177
90
63
18
3
3
6
Salt Lake City, UT
156
106
36
5
4
5
14
Evansville, IN
40
33
4
3
?
?
3
Tucson, AZ
139
93
32
8
3
2
7
Fort Wayne, IN
68
52
15
1
?
?
3
Pacific
2,009
1,422
419
95
42
30
182
Gary, IN
12
8
4
?
?
?
?
Berkeley, CA
20
14
6
?
?
?
1
Grand Rapids, MI
53
39
9
2
1
2
5
Fresno, CA
186
138
36
6
3
3
16
Indianapolis, IN
165
120
31
9
?
5
15
Glendale, CA
42
37
4
?
1
?
7
Lansing, MI
58
37
11
5
5
?
6
Honolulu, HI
82
56
18
5
3
?
7
Milwaukee, WI
89
61
21
3
1
3
3
Long Beach, CA
73
48
15
3
2
5
3
Peoria, IL
71
50
17
3
?
1
7
Los Angeles, CA
280
184
57
21
11
7
32
Rockford, IL
76
50
19
7
?
?
5
Pasadena, CA
31
24
5
2
?
?
2
South Bend, IN
59
43
10
5
1
?
1
Portland, OR
118
73
35
7
2
1
5
Toledo, OH
103
85
15
3
?
?
7
Sacramento, CA
279
196
59
14
6
4
39
Youngstown, OH
75
62
12
1
?
?
5
San Diego, CA
163
121
33
5
2
1
12
W.N. Central
764
502
180
47
14
20
52
San Francisco, CA
148
108
27
7
4
2
21
Des Moines, IA
45
36
5
3
1
?
2
San Jose, CA
238
173
49
10
2
4
19
Duluth, MN
40
30
9
1
?
?
1
Santa Cruz, CA
41
28
10
3
?
?
2
Kansas City, KS
25
11
9
5
?
?
3
Seattle, WA
104
68
27
5
2
2
4
Kansas City, MO
98
65
21
4
3
5
11
Spokane, WA
70
55
10
1
3
1
3
Lincoln, NE
55
37
11
6
1
?
2
Tacoma, WA
134
99
28
6
1
?
9
Minneapolis, MN
102
65
25
7
1
4
8
Total¶
11,882
8,144
2,598
698
234
199
801
Omaha, NE
95
73
19
1
?
2
10
St. Louis, MO
131
69
42
8
6
5
7
St. Paul, MN
60
43
8
7
2
?
3
Wichita, KS
113
73
31
5
?
4
5
U: Unavailable. ?: No reported cases.
* Mortality data in this table are voluntarily reported from 122 cities in the United States, most of which have populations of >100,000. A death is reported by the place of its occurrence and by the week that the death certificate was filed. Fetal deaths are not included.
† Pneumonia and influenza.
§ Because of changes in reporting methods in this Pennsylvania city, these numbers are partial counts for the current week. Complete counts will be available in 4 to 6 weeks.