Persons using assistive technology might not be able to fully access information in this file. For assistance, please send e-mail to: mmwrq@cdc.gov. Type 508 Accommodation and the title of the report in the subject line of e-mail.
Notifiable Diseases and Mortality Tables
Table I Summary of provisional cases of selected notifiable diseases, United States, cumulative, week ending December 17, 2011 (50th Week)
Figure I Selected notifiable disease reports, United States, comparison of provisional 4-week totals ending December 17, 2011, with historical data
Table II Provisional cases of selected notifiable diseases, United States, weeks ending December 17, 2011 and December 18, 2010 (50th Week)
Table III Deaths in 122 U.S. cities, week ending December 17, 2011 (50th Week)
TABLE I. Provisional cases of infrequently reported notifiable diseases (<1,000 cases reported during the preceding year) — United States, week ending December 17, 2011 (50th week)*
TABLE I. (Continued) Provisional cases of infrequently reported notifiable diseases (<1,000 cases reported during the preceding year) — United States, week ending December 17, 2011 (50th week)*
—: No reported cases. N: Not reportable. NN: Not Nationally Notifiable. Cum: Cumulative year-to-date counts.
§ Not reportable in all states. Data from states where the condition is not reportable are excluded from this table except starting in 2007 for the arboviral diseases, STD data, TB data, and influenza-associated pediatric mortality, and in 2003 for SARS-CoV. Reporting exceptions are available at http://www.cdc.gov/osels/ph_surveillance/nndss/phs/infdis.htm.
¶ Includes both neuroinvasive and nonneuroinvasive. Updated weekly from reports to the Division of Vector-Borne Infectious Diseases, National Center for Zoonotic, Vector-Borne, and Enteric Diseases (ArboNET Surveillance). Data for West Nile virus are available in Table II.
** Data for H. influenzae (all ages, all serotypes) are available in Table II.
†† Updated weekly from reports to the Influenza Division, National Center for Immunization and Respiratory Diseases. Since October 2, 2011, no influenza-associated pediatric deaths occurring during the 2011-12 influenza season have been reported.
§§ No measles cases were reported for the current week.
¶¶ Data for meningococcal disease (all serogroups) are available in Table II.
*** CDC discontinued reporting of individual confirmed and probable cases of 2009 pandemic influenza A (H1N1) virus infections on July 24, 2009. During 2009, four cases of human infection with novel influenza A viruses, different from the 2009 pandemic influenza A (H1N1) strain, were reported to CDC. The four cases of novel influenza A virus infection reported to CDC during 2010, and the eight cases reported during 2011, were identified as swine influenza A (H3N2) virus and are unrelated to the 2009 pandemic influenza A (H1N1) virus. Total case counts are provided by the Influenza Division, National Center for Immunization and Respiratory Diseases (NCIRD).
††† No rubella cases were reported for the current week.
§§§ Updated weekly from reports to the Division of STD Prevention, National Center for HIV/AIDS, Viral Hepatitis, STD, and TB Prevention.
¶¶¶ There was one case of viral hemorrhagic fever reported during week 12 of 2010. The one case report was confirmed as lassa fever. See Table II for dengue hemorrhagic fever.
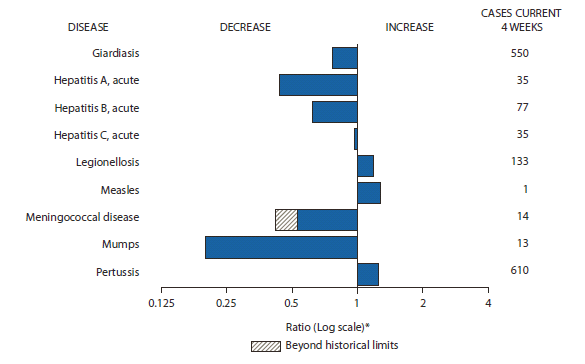
FIGURE I. Selected notifiable disease reports, United States, comparison of provisional 4-week totals December 17, 2011, with historical data
* Ratio of current 4-week total to mean of 15 4-week totals (from previous, comparable, and subsequent 4-week periods for the past 5 years). The point where the hatched area begins is based on the mean and two standard deviations of these 4-week totals.
Alternate Text: The figure above shows selected notifiable disease reports for the United States with comparison of provisional 4-week totals through December 17, 2011, with historical data. Reports of legionellosis, measles, and pertussis all increased. Reports of giardiasis, acute hepatitis A, acute hepatitis B, acute Hepatitis C, meningococcal disease, and mumps all decreased, with meningococcal disease decreasing beyond historical limits.
TABLE II. Provisional cases of selected notifiable diseases, United States, weeks ending December 17, 2011, and December 18, 2010 (50th week)*
Reporting area
Chlamydia trachomatis infection
Coccidioidomycosis
Cryptosporidiosis
Current week
Previous 52 weeks
Cum 2011
Cum 2010
Current week
Previous 52 weeks
Cum 2011
Cum 2010
Current week
Previous 52 weeks
Cum 2011
Cum 2010
Med
Max
Med
Max
Med
Max
United States
12,532
26,502
31,142
1,272,762
1,254,968
104
382
579
18,696
NN
43
129
388
7,939
8,663
New England
657
871
2,043
42,691
40,497
—
0
1
1
NN
—
7
22
369
478
Connecticut
—
227
1,557
10,107
10,843
—
0
0
—
NN
—
1
9
68
77
Maine†
54
58
98
2,916
2,496
—
0
0
—
NN
—
1
4
47
92
Massachusetts
409
433
860
21,611
20,243
—
0
0
—
NN
—
3
8
152
165
New Hampshire
4
57
90
2,725
2,374
—
0
1
1
NN
—
1
5
61
57
Rhode Island†
137
78
154
3,919
3,320
—
0
0
—
NN
—
0
1
1
18
Vermont†
53
27
84
1,413
1,221
—
0
0
—
NN
—
0
5
40
69
Mid. Atlantic
2,144
3,235
3,953
159,099
166,873
—
0
1
6
NN
10
15
41
809
840
New Jersey
154
538
1,003
26,687
25,428
—
0
0
—
NN
—
0
1
—
51
New York (Upstate)
904
713
2,099
34,844
33,387
—
0
0
—
NN
5
4
15
218
213
New York City
278
1,103
1,329
48,325
62,170
—
0
0
—
NN
—
1
6
83
103
Pennsylvania
808
976
1,236
49,243
45,888
—
0
1
6
NN
5
9
26
508
473
E.N. Central
1,229
4,049
7,039
193,825
201,156
3
1
5
52
NN
9
32
143
2,395
2,360
Illinois
25
1,103
1,326
49,660
58,785
—
0
0
—
NN
—
3
26
205
331
Indiana
252
536
3,376
27,296
22,375
—
0
0
—
NN
—
4
14
180
279
Michigan
627
952
1,429
47,003
47,970
2
0
3
33
NN
1
6
14
330
314
Ohio
169
1,013
1,124
48,082
49,520
1
0
3
19
NN
8
11
95
1,082
458
Wisconsin
156
463
553
21,784
22,506
—
0
0
—
NN
—
8
61
598
978
W.N. Central
218
1,472
1,782
70,782
70,043
—
0
2
6
NN
1
17
87
1,228
1,825
Iowa
28
211
253
10,290
10,257
—
0
0
—
NN
—
6
19
342
390
Kansas
17
208
288
10,068
9,333
—
0
0
—
NN
—
0
11
41
106
Minnesota
—
287
381
13,180
14,913
—
0
0
—
NN
—
0
4
—
391
Missouri
—
529
759
26,034
25,240
—
0
0
—
NN
1
5
63
502
544
Nebraska†
139
113
218
6,142
4,924
—
0
2
6
NN
—
2
12
173
258
North Dakota
2
40
77
1,891
2,283
—
0
0
—
NN
—
0
12
28
31
South Dakota
32
63
93
3,177
3,093
—
0
0
—
NN
—
2
13
142
105
S. Atlantic
4,804
5,375
7,367
271,989
249,086
—
0
2
5
NN
10
21
37
1,085
1,041
Delaware
148
85
134
4,232
4,271
—
0
0
—
NN
—
0
1
7
9
District of Columbia
4
107
190
5,304
5,423
—
0
0
—
NN
—
0
1
5
8
Florida
847
1,494
1,698
73,036
72,671
—
0
0
—
NN
7
8
17
423
393
Georgia
893
1,018
2,384
49,826
42,218
—
0
0
—
NN
2
5
11
258
261
Maryland†
—
473
1,125
23,545
24,438
—
0
2
5
NN
—
1
6
64
39
North Carolina
1,288
971
1,688
50,232
40,407
—
0
0
—
NN
—
0
23
62
94
South Carolina†
626
526
946
27,933
25,783
—
0
0
—
NN
—
2
8
126
118
Virginia†
917
659
1,576
33,766
30,112
—
0
0
—
NN
1
2
8
124
100
West Virginia
81
81
121
4,115
3,763
—
0
0
—
NN
—
0
5
16
19
E.S. Central
1,134
1,896
3,314
92,009
88,219
—
0
0
—
NN
1
7
25
424
341
Alabama†
594
546
1,566
28,008
26,050
—
0
0
—
NN
1
2
7
127
180
Kentucky
298
301
2,352
15,992
13,902
—
0
0
—
NN
—
1
17
164
83
Mississippi
—
392
696
18,580
20,678
—
0
0
—
NN
—
1
4
45
24
Tennessee†
242
600
754
29,429
27,589
—
0
0
—
NN
—
2
6
88
54
W.S. Central
715
3,386
4,329
166,314
172,517
—
0
1
8
NN
6
8
62
527
513
Arkansas†
305
309
440
15,429
14,984
—
0
0
—
NN
—
0
2
25
33
Louisiana
311
412
1,071
22,316
27,952
—
0
1
8
NN
1
0
9
47
66
Oklahoma
99
173
850
9,190
13,408
—
0
0
—
NN
2
1
34
83
86
Texas†
—
2,426
3,137
119,379
116,173
—
0
0
—
NN
3
5
37
372
328
Mountain
169
1,751
2,279
85,349
80,298
91
295
459
14,636
NN
2
11
30
569
592
Arizona
—
547
773
27,386
25,963
89
292
456
14,470
NN
—
1
4
42
38
Colorado
—
421
847
22,065
19,039
—
0
0
—
NN
—
2
12
146
132
Idaho†
5
81
235
4,081
3,987
—
0
0
—
NN
1
2
9
104
105
Montana†
61
64
87
3,273
2,981
—
0
2
5
NN
1
1
6
75
49
Nevada†
29
204
380
9,990
9,386
2
2
5
97
NN
—
0
2
14
38
New Mexico†
—
200
1,183
10,235
10,421
—
0
4
46
NN
—
3
9
122
131
Utah
51
131
190
6,541
6,482
—
0
2
15
NN
—
1
5
41
71
Wyoming†
23
36
67
1,778
2,039
—
0
2
3
NN
—
0
5
25
28
Pacific
1,462
3,964
6,559
190,704
186,279
10
83
145
3,982
NN
4
11
21
533
673
Alaska
4
110
157
5,381
5,864
—
0
0
—
NN
—
0
3
14
6
California
887
2,973
5,763
145,775
142,281
10
82
145
3,975
NN
2
6
15
317
362
Hawaii
—
109
141
5,444
5,840
—
0
0
—
NN
—
0
1
1
1
Oregon
204
277
412
13,390
11,693
—
0
1
7
NN
—
2
8
126
215
Washington
367
434
672
20,714
20,601
—
0
0
—
NN
2
1
9
75
89
Territories
American Samoa
—
0
0
—
—
—
0
0
—
NN
N
0
0
N
N
C.N.M.I.
—
—
—
—
—
—
—
—
—
NN
—
—
—
—
—
Guam
—
14
44
189
905
—
0
0
—
NN
—
0
0
—
—
Puerto Rico
—
104
349
5,010
5,816
—
0
0
—
NN
N
0
0
N
N
U.S. Virgin Islands
—
16
27
642
566
—
0
0
—
NN
—
0
0
—
—
C.N.M.I.: Commonwealth of Northern Mariana Islands.
U: Unavailable. —: No reported cases. N: Not reportable. NN: Not Nationally Notifiable. Cum: Cumulative year-to-date counts. Med: Median. Max: Maximum.
† Contains data reported through the National Electronic Disease Surveillance System (NEDSS).
TABLE II. (Continued) Provisional cases of selected notifiable diseases, United States, weeks ending December 17, 2011, and December 18, 2010 (50th week)*
Reporting area
Dengue Virus Infection†
Dengue Fever§
Dengue Hemorrhagic Fever¶
Current week
Previous 52 weeks
Cum 2011
Cum 2010
Current week
Previous 52 weeks
Cum 2011
Cum 2010
Med
Max
Med
Max
United States
—
3
16
203
684
—
0
1
2
10
New England
—
0
1
2
10
—
0
0
—
—
Connecticut
—
0
0
—
—
—
0
0
—
—
Maine**
—
0
0
—
6
—
0
0
—
—
Massachusetts
—
0
0
—
—
—
0
0
—
—
New Hampshire
—
0
0
—
—
—
0
0
—
—
Rhode Island**
—
0
0
—
1
—
0
0
—
—
Vermont**
—
0
1
2
3
—
0
0
—
—
Mid. Atlantic
—
1
6
56
222
—
0
0
—
5
New Jersey
—
0
0
—
29
—
0
0
—
—
New York (Upstate)
—
0
1
—
31
—
0
0
—
2
New York City
—
0
4
40
141
—
0
0
—
3
Pennsylvania
—
0
2
16
21
—
0
0
—
—
E.N. Central
—
0
2
14
67
—
0
1
1
1
Illinois
—
0
2
4
21
—
0
1
1
—
Indiana
—
0
1
2
14
—
0
0
—
—
Michigan
—
0
1
2
9
—
0
0
—
—
Ohio
—
0
1
2
16
—
0
0
—
—
Wisconsin
—
0
2
4
7
—
0
0
—
1
W.N. Central
—
0
2
11
33
—
0
0
—
1
Iowa
—
0
1
3
2
—
0
0
—
—
Kansas
—
0
1
1
4
—
0
0
—
—
Minnesota
—
0
1
5
14
—
0
0
—
—
Missouri
—
0
1
1
5
—
0
0
—
—
Nebraska**
—
0
0
—
7
—
0
0
—
—
North Dakota
—
0
1
1
1
—
0
0
—
—
South Dakota
—
0
0
—
—
—
0
0
—
1
S. Atlantic
—
1
8
81
237
—
0
1
1
2
Delaware
—
0
2
2
—
—
0
0
—
—
District of Columbia
—
0
0
—
—
—
0
0
—
—
Florida
—
1
7
61
188
—
0
0
—
2
Georgia
—
0
1
3
12
—
0
0
—
—
Maryland**
—
0
2
5
—
—
0
0
—
—
North Carolina
—
0
1
2
8
—
0
0
—
—
South Carolina**
—
0
1
1
13
—
0
0
—
—
Virginia**
—
0
1
7
14
—
0
1
1
—
West Virginia
—
0
0
—
2
—
0
0
—
—
E.S. Central
—
0
3
8
7
—
0
0
—
—
Alabama**
—
0
1
2
4
—
0
0
—
—
Kentucky
—
0
1
3
2
—
0
0
—
—
Mississippi
—
0
0
—
—
—
0
0
—
—
Tennessee**
—
0
2
3
1
—
0
0
—
—
W.S. Central
—
0
2
9
28
—
0
0
—
1
Arkansas**
—
0
0
—
—
—
0
0
—
1
Louisiana
—
0
1
3
4
—
0
0
—
—
Oklahoma
—
0
0
—
5
—
0
0
—
—
Texas**
—
0
1
6
19
—
0
0
—
—
Mountain
—
0
1
4
24
—
0
0
—
—
Arizona
—
0
1
2
12
—
0
0
—
—
Colorado
—
0
0
—
—
—
0
0
—
—
Idaho**
—
0
0
—
3
—
0
0
—
—
Montana**
—
0
0
—
4
—
0
0
—
—
Nevada**
—
0
1
1
4
—
0
0
—
—
New Mexico**
—
0
0
—
1
—
0
0
—
—
Utah
—
0
1
1
—
—
0
0
—
—
Wyoming**
—
0
0
—
—
—
0
0
—
—
Pacific
—
0
4
18
56
—
0
0
—
—
Alaska
—
0
0
—
1
—
0
0
—
—
California
—
0
2
5
36
—
0
0
—
—
Hawaii
—
0
4
5
—
—
0
0
—
—
Oregon
—
0
0
—
—
—
0
0
—
—
Washington
—
0
1
8
19
—
0
0
—
—
Territories
American Samoa
—
0
0
—
—
—
0
0
—
—
C.N.M.I.
—
—
—
—
—
—
—
—
—
—
Guam
—
0
0
—
—
—
0
0
—
—
Puerto Rico
—
23
82
1,361
10,586
—
0
3
30
237
U.S. Virgin Islands
—
0
0
—
—
—
0
0
—
—
C.N.M.I.: Commonwealth of Northern Mariana Islands.
U: Unavailable. —: No reported cases. N: Not reportable. NN: Not Nationally Notifiable. Cum: Cumulative year-to-date counts. Med: Median. Max: Maximum.
† Updated weekly from reports to the Division of Vector-Borne Infectious Diseases, National Center for Zoonotic, Vector-Borne, and Enteric Diseases (ArboNET Surveillance).
§ Dengue Fever includes cases that meet criteria for Dengue Fever with hemorrhage, other clinical and unknown case classifications.
¶ DHF includes cases that meet criteria for dengue shock syndrome (DSS), a more severe form of DHF.
** Contains data reported through the National Electronic Disease Surveillance System (NEDSS).
TABLE II. (Continued) Provisional cases of selected notifiable diseases, United States, weeks ending December 17, 2011, and December 18, 2010 (50th week)*
Reporting area
Ehrlichiosis/Anaplasmosis†
Ehrlichia chaffeensis
Anaplasma phagocytophilum
Undetermined
Current week
Previous 52 weeks
Cum 2011
Cum 2010
Current week
Previous 52 weeks
Cum 2011
Cum 2010
Current week
Previous 52 weeks
Cum 2011
Cum 2010
Med
Max
Med
Max
Med
Max
United States
4
7
109
677
629
20
13
57
772
1,726
—
2
13
105
90
New England
—
0
1
4
8
2
3
28
272
117
—
0
1
2
2
Connecticut
—
0
0
—
—
—
0
2
—
41
—
0
0
—
—
Maine§
—
0
1
1
4
—
0
3
23
17
—
0
0
—
—
Massachusetts
—
0
0
—
—
—
1
18
172
—
—
0
0
—
—
New Hampshire
—
0
1
2
3
—
0
4
22
20
—
0
1
1
2
Rhode Island§
—
0
1
1
1
1
0
15
47
37
—
0
1
1
—
Vermont§
—
0
0
—
—
1
0
1
8
2
—
0
0
—
—
Mid. Atlantic
—
1
7
58
84
15
5
31
353
274
—
0
2
10
15
New Jersey
—
0
1
—
51
—
0
2
—
74
—
0
0
—
1
New York (Upstate)
—
0
7
47
26
15
3
27
299
188
—
0
2
10
11
New York City
—
0
2
11
5
—
0
5
50
11
—
0
0
—
—
Pennsylvania
—
0
0
—
2
—
0
1
4
1
—
0
0
—
3
E.N. Central
—
0
5
31
44
1
0
3
21
510
—
1
5
44
45
Illinois
—
0
4
21
16
—
0
2
9
9
—
0
1
2
3
Indiana
—
0
0
—
—
—
0
0
—
—
—
0
3
34
15
Michigan
—
0
2
4
2
—
0
0
—
4
—
0
2
5
—
Ohio
—
0
1
6
7
1
0
1
9
2
—
0
1
1
—
Wisconsin
—
0
0
—
19
—
0
3
3
495
—
0
1
2
27
W.N. Central
—
1
19
159
120
—
0
8
33
733
—
0
11
15
10
Iowa
N
0
0
N
N
N
0
0
N
N
N
0
0
N
N
Kansas
—
0
2
5
6
—
0
0
—
1
—
0
1
1
—
Minnesota
—
0
12
—
—
—
0
1
1
720
—
0
11
—
—
Missouri
—
1
19
152
112
—
0
7
29
12
—
0
7
13
10
Nebraska§
—
0
1
1
2
—
0
1
1
—
—
0
1
1
—
North Dakota
N
0
0
N
N
N
0
0
N
N
N
0
0
N
N
South Dakota
—
0
1
1
—
—
0
1
2
—
—
0
0
—
—
S. Atlantic
1
2
33
240
251
2
1
8
66
64
—
0
2
13
6
Delaware
—
0
2
15
17
—
0
1
1
4
—
0
0
—
—
District of Columbia
N
0
0
N
N
N
0
0
N
N
N
0
0
N
N
Florida
—
0
3
15
8
—
0
3
10
3
—
0
0
—
—
Georgia
—
0
3
18
20
—
0
2
9
1
—
0
1
2
1
Maryland§
—
0
3
28
22
—
0
2
6
15
—
0
1
1
2
North Carolina
—
0
17
66
99
—
0
6
20
28
—
0
0
—
—
South Carolina§
—
0
1
2
5
—
0
0
—
1
—
0
1
1
—
Virginia§
1
1
13
96
77
2
0
3
20
12
—
0
1
8
3
West Virginia
—
0
0
—
3
—
0
0
—
—
—
0
1
1
—
E.S. Central
—
1
8
73
87
—
0
2
16
20
—
0
3
14
9
Alabama§
—
0
2
4
11
—
0
1
4
7
N
0
0
N
N
Kentucky
—
0
3
13
16
—
0
0
—
—
—
0
0
—
1
Mississippi
—
0
1
3
3
—
0
1
1
2
—
0
0
—
1
Tennessee§
—
0
5
53
57
—
0
2
11
11
—
0
3
14
7
W.S. Central
3
0
87
112
33
—
0
9
8
8
—
0
0
—
1
Arkansas§
1
0
13
51
14
—
0
3
6
4
—
0
0
—
—
Louisiana
—
0
0
—
1
—
0
0
—
—
—
0
0
—
—
Oklahoma
2
0
82
59
15
—
0
7
2
2
—
0
0
—
—
Texas§
—
0
1
2
3
—
0
1
—
2
—
0
0
—
1
Mountain
—
0
0
—
—
—
0
0
—
—
—
0
1
5
—
Arizona
—
0
0
—
—
—
0
0
—
—
—
0
1
4
—
Colorado
N
0
0
N
N
N
0
0
N
N
N
0
0
N
N
Idaho§
N
0
0
N
N
N
0
0
N
N
N
0
0
N
N
Montana§
N
0
0
N
N
N
0
0
N
N
N
0
0
N
N
Nevada§
N
0
0
N
N
N
0
0
N
N
N
0
0
N
N
New Mexico§
N
0
0
N
N
N
0
0
N
N
N
0
0
N
N
Utah
—
0
0
—
—
—
0
0
—
—
—
0
1
1
—
Wyoming§
—
0
0
—
—
—
0
0
—
—
—
0
0
—
—
Pacific
—
0
1
—
2
—
0
1
3
—
—
0
1
2
2
Alaska
N
0
0
N
N
N
0
0
N
N
N
0
0
N
N
California
—
0
1
—
2
—
0
0
—
—
—
0
1
2
2
Hawaii
N
0
0
N
N
N
0
0
N
N
N
0
0
N
N
Oregon
—
0
0
—
—
—
0
1
3
—
—
0
0
—
—
Washington
—
0
0
—
—
—
0
0
—
—
—
0
0
—
—
Territories
American Samoa
N
0
0
N
N
N
0
0
N
N
N
0
0
N
N
C.N.M.I.
—
—
—
—
—
—
—
—
—
—
—
—
—
—
—
Guam
N
0
0
N
N
N
0
0
N
N
N
0
0
N
N
Puerto Rico
N
0
0
N
N
N
0
0
N
N
N
0
0
N
N
U.S. Virgin Islands
—
0
0
—
—
—
0
0
—
—
—
0
0
—
—
C.N.M.I.: Commonwealth of Northern Mariana Islands.
U: Unavailable. —: No reported cases. N: Not reportable. NN: Not Nationally Notifiable. Cum: Cumulative year-to-date counts. Med: Median. Max: Maximum.
† Cumulative total E. ewingii cases reported for year 2011 = 13.
§ Contains data reported through the National Electronic Disease Surveillance System (NEDSS).
TABLE II. (Continued) Provisional cases of selected notifiable diseases, United States, weeks ending December 17, 2011, and December 18, 2010 (50th week)*
Reporting area
Giardiasis
Gonorrhea
Haemophilus influenzae, invasive† All ages, all serotypes
Current week
Previous 52 weeks
Cum 2011
Cum 2010
Current week
Previous 52 weeks
Cum 2011
Cum 2010
Current week
Previous 52 weeks
Cum 2011
Cum 2010
Med
Max
Med
Max
Med
Max
United States
148
281
445
14,299
19,083
2,978
5,982
7,484
291,262
297,339
34
64
141
3,036
2,942
New England
2
27
64
1,478
1,629
73
106
206
5,196
5,381
—
4
12
209
189
Connecticut
—
4
10
216
285
—
45
150
2,184
2,386
—
1
5
50
44
Maine§
1
3
10
170
220
12
5
17
249
152
—
0
2
25
13
Massachusetts
—
13
29
701
709
26
47
80
2,264
2,363
—
2
6
102
93
New Hampshire
—
2
8
115
153
—
2
7
121
149
—
0
2
15
12
Rhode Island§
—
1
10
66
80
35
6
16
331
273
—
0
2
10
13
Vermont§
1
3
19
210
182
—
0
8
47
58
—
0
2
7
14
Mid. Atlantic
42
54
103
2,731
3,258
473
738
916
37,113
35,702
11
14
32
697
562
New Jersey
—
0
10
—
465
45
148
232
7,440
5,721
—
2
6
104
103
New York (Upstate)
30
20
72
1,146
1,140
143
114
271
5,708
5,524
4
3
18
171
152
New York City
7
16
29
818
901
67
242
314
11,119
12,067
2
3
7
167
93
Pennsylvania
5
16
29
767
752
218
255
361
12,846
12,390
5
5
11
255
214
E.N. Central
9
47
78
2,276
3,210
323
1,033
2,091
51,039
55,760
8
11
22
537
487
Illinois
—
10
19
439
678
6
280
359
12,847
15,253
1
3
11
151
167
Indiana
—
4
11
189
389
53
129
1,018
6,544
6,397
—
2
7
90
100
Michigan
1
10
21
491
683
183
240
499
12,207
13,229
1
1
4
67
33
Ohio
8
16
30
755
842
47
315
398
15,127
15,964
6
3
7
164
118
Wisconsin
—
8
18
402
618
34
89
118
4,314
4,917
—
1
5
65
69
W.N. Central
7
21
50
1,068
2,058
31
306
372
14,912
14,486
2
2
10
146
219
Iowa
2
4
15
262
278
4
37
54
1,846
1,747
—
0
1
3
1
Kansas
—
2
8
94
204
—
42
57
2,018
2,006
—
0
2
19
23
Minnesota
—
0
13
—
821
—
38
56
1,820
2,064
—
0
5
—
75
Missouri
4
8
23
403
413
—
150
204
7,245
6,876
2
1
5
83
82
Nebraska§
—
3
11
166
214
25
24
51
1,249
1,147
—
0
2
26
26
North Dakota
—
0
12
38
31
—
4
8
185
193
—
0
6
14
12
South Dakota
1
1
8
105
97
2
11
20
549
453
—
0
1
1
—
S. Atlantic
33
51
98
2,594
3,862
1,266
1,486
1,927
73,147
73,554
3
14
31
688
737
Delaware
1
0
3
33
34
20
15
31
781
957
—
0
2
5
5
District of Columbia
—
0
3
31
55
—
38
98
1,924
2,033
—
0
0
—
6
Florida
26
23
50
1,193
2,067
207
378
462
18,903
19,595
—
5
12
218
185
Georgia
—
10
51
645
785
294
311
874
15,134
14,791
1
2
7
122
158
Maryland§
5
6
13
297
258
—
120
203
5,603
7,044
1
2
5
91
68
North Carolina
N
0
0
N
N
400
323
548
16,040
13,542
—
1
7
74
123
South Carolina§
—
2
8
111
142
170
152
257
7,938
7,769
—
1
5
70
80
Virginia§
1
5
32
262
474
165
111
352
6,051
7,270
1
1
8
91
82
West Virginia
—
0
8
22
47
10
17
29
773
553
—
0
9
17
30
E.S. Central
1
3
9
160
216
323
515
1,007
25,225
24,116
2
3
12
199
174
Alabama§
1
3
9
160
216
174
162
408
8,583
7,616
—
1
4
47
30
Kentucky
N
0
0
N
N
70
77
712
4,374
3,612
1
1
4
41
36
Mississippi
N
0
0
N
N
—
113
191
5,062
5,944
1
0
3
19
15
Tennessee§
N
0
0
N
N
79
145
224
7,206
6,944
—
2
5
92
93
W.S. Central
2
5
15
250
382
211
885
1,181
43,241
48,066
5
2
26
140
136
Arkansas§
1
2
9
117
129
86
89
138
4,523
4,602
1
0
3
31
18
Louisiana
1
2
10
133
191
98
136
313
6,486
8,585
—
1
4
45
29
Oklahoma
—
0
0
—
62
27
51
254
2,658
4,101
4
1
19
62
81
Texas§
N
0
0
N
N
—
589
839
29,574
30,778
—
0
4
2
8
Mountain
24
25
45
1,292
1,719
6
207
289
10,361
9,168
1
5
12
251
294
Arizona
2
3
6
123
161
—
80
131
4,240
3,124
—
1
6
84
108
Colorado
14
11
25
618
680
—
41
89
2,114
2,683
1
1
5
64
81
Idaho§
4
3
9
158
208
1
2
13
128
136
—
0
2
21
18
Montana§
3
2
5
79
107
—
1
4
79
99
—
0
1
3
2
Nevada§
1
1
7
74
104
3
39
103
1,900
1,668
—
0
2
17
10
New Mexico§
—
2
6
90
103
—
33
98
1,605
1,118
—
1
4
42
40
Utah
—
3
9
128
303
2
5
10
255
303
—
0
3
18
29
Wyoming§
—
0
5
22
53
—
0
3
40
37
—
0
1
2
6
Pacific
28
47
128
2,450
2,749
272
628
791
31,028
31,106
2
3
9
169
144
Alaska
—
2
7
95
95
—
20
31
938
1,250
—
0
3
25
25
California
17
33
67
1,619
1,668
201
518
695
25,608
25,316
1
1
5
44
26
Hawaii
1
0
4
34
54
—
13
24
628
727
1
0
3
26
20
Oregon
4
7
20
347
477
23
27
60
1,386
1,026
—
1
6
71
64
Washington
6
7
57
355
455
48
50
79
2,468
2,787
—
0
1
3
9
Territories
American Samoa
—
0
0
—
—
—
0
0
—
—
—
0
0
—
—
C.N.M.I.
—
—
—
—
—
—
—
—
—
—
—
—
—
—
—
Guam
—
0
0
—
3
—
0
5
6
99
—
0
0
—
—
Puerto Rico
—
0
4
38
92
—
6
14
312
301
—
0
0
—
1
U.S. Virgin Islands
—
0
0
—
—
—
2
10
113
132
—
0
0
—
—
C.N.M.I.: Commonwealth of Northern Mariana Islands.
U: Unavailable. —: No reported cases. N: Not reportable. NN: Not Nationally Notifiable. Cum: Cumulative year-to-date counts. Med: Median. Max: Maximum.
† Data for H. influenzae (age <5 yrs for serotype b, nonserotype b, and unknown serotype) are available in Table I.
§ Contains data reported through the National Electronic Disease Surveillance System (NEDSS).
TABLE II. (Continued) Provisional cases of selected notifiable diseases, United States, weeks ending December 17, 2011, and December 18, 2010 (50th week)*
Hepatitis (viral, acute), by type
Reporting area
A
B
C
Current week
Previous 52 weeks
Cum 2011
Cum 2010
Current week
Previous 52 weeks
Cum 2011
Cum 2010
Current week
Previous 52 weeks
Cum 2011
Cum 2010
Med
Max
Med
Max
Med
Max
United States
6
22
74
1,096
1,574
30
47
167
2,399
3,155
12
18
39
960
799
New England
—
1
5
67
93
—
1
8
76
54
—
1
5
60
54
Connecticut
—
0
3
19
28
—
0
4
16
22
—
0
5
40
37
Maine†
—
0
2
6
7
—
0
2
8
13
—
0
2
4
2
Massachusetts
—
0
3
31
48
—
1
6
49
12
—
0
2
11
13
New Hampshire
—
0
1
—
1
—
0
1
3
5
N
0
0
N
N
Rhode Island†
—
0
1
5
9
U
0
0
U
U
U
0
0
U
U
Vermont†
—
0
2
6
—
—
0
0
—
2
—
0
1
5
2
Mid. Atlantic
1
3
7
163
269
3
5
11
207
272
3
1
5
84
101
New Jersey
—
0
2
—
73
—
0
2
—
74
—
0
0
—
28
New York (Upstate)
1
1
4
46
56
2
1
9
54
50
1
1
4
48
44
New York City
—
1
5
62
88
—
1
5
78
79
—
0
0
—
3
Pennsylvania
—
1
3
55
52
1
2
4
75
69
2
0
4
36
26
E.N. Central
1
3
8
174
202
1
6
37
316
466
2
2
8
134
92
Illinois
—
1
4
53
48
—
1
6
59
128
—
0
2
7
1
Indiana
—
0
3
12
12
—
1
3
57
71
—
0
5
55
27
Michigan
1
1
6
64
73
1
1
6
80
119
2
1
4
64
45
Ohio
—
1
3
39
47
—
1
30
89
94
—
0
1
6
9
Wisconsin
—
0
1
6
22
—
0
3
31
54
—
0
1
2
10
W.N. Central
—
1
25
39
75
—
2
16
123
114
—
0
6
8
20
Iowa
—
0
1
8
11
—
0
1
10
14
—
0
0
—
—
Kansas
—
0
2
3
11
—
0
2
12
11
—
0
1
3
2
Minnesota
—
0
22
9
15
—
0
15
9
8
—
0
6
2
10
Missouri
—
0
1
12
20
—
2
5
79
67
—
0
0
—
6
Nebraska†
—
0
1
5
14
—
0
3
12
12
—
0
1
3
2
North Dakota
—
0
1
—
3
—
0
0
—
—
—
0
0
—
—
South Dakota
—
0
2
2
1
—
0
1
1
2
—
0
0
—
—
S. Atlantic
1
4
12
227
332
12
12
56
668
872
6
4
11
231
182
Delaware
—
0
1
2
7
—
0
2
13
24
U
0
0
U
U
District of Columbia
—
0
0
—
1
—
0
0
—
3
—
0
0
—
2
Florida
1
1
7
79
137
7
4
7
199
290
1
1
3
56
55
Georgia
—
1
5
48
37
—
2
7
113
163
—
0
3
33
32
Maryland†
—
0
4
25
22
2
1
4
58
66
1
0
3
35
24
North Carolina
—
0
3
27
45
2
2
12
106
108
4
1
7
60
39
South Carolina†
—
0
2
10
26
—
1
3
32
58
—
0
1
1
1
Virginia†
—
0
3
28
49
1
1
6
68
90
—
0
3
20
12
West Virginia
—
0
5
8
8
—
0
43
79
70
—
0
6
26
17
E.S. Central
—
1
6
47
48
7
10
15
459
370
1
4
10
215
157
Alabama†
—
0
2
7
8
1
2
6
109
65
—
0
3
18
7
Kentucky
—
0
2
10
26
2
3
7
136
132
—
2
7
121
106
Mississippi
—
0
1
7
2
—
1
4
44
33
U
0
0
U
U
Tennessee†
—
0
5
23
12
4
4
8
170
140
1
1
5
76
44
W.S. Central
1
3
15
128
141
3
6
67
296
553
—
2
11
83
68
Arkansas†
—
0
1
1
2
—
1
4
48
62
—
0
0
—
1
Louisiana
—
0
2
5
11
—
1
4
34
51
—
0
2
5
4
Oklahoma
—
0
4
3
2
1
1
16
82
97
—
1
10
47
31
Texas†
1
2
11
119
126
2
3
45
132
343
—
0
3
31
32
Mountain
—
1
5
57
140
1
1
4
73
133
—
1
5
62
64
Arizona
—
0
2
16
61
—
0
3
16
26
U
0
0
U
U
Colorado
—
0
2
18
35
—
0
2
15
44
—
0
3
17
19
Idaho†
—
0
1
6
7
—
0
1
2
6
—
0
2
10
11
Montana†
—
0
1
2
4
—
0
0
—
—
—
0
1
3
3
Nevada†
—
0
3
5
14
1
0
3
27
41
—
0
2
10
7
New Mexico†
—
0
1
5
5
—
0
2
8
5
—
0
2
12
14
Utah
—
0
2
3
10
—
0
1
5
8
—
0
2
8
10
Wyoming†
—
0
1
2
4
—
0
0
—
3
—
0
1
2
—
Pacific
2
3
13
194
274
3
3
25
181
321
—
2
12
83
61
Alaska
—
0
1
2
5
—
0
1
4
5
U
0
0
U
U
California
1
3
12
151
225
—
2
22
114
227
—
1
4
38
27
Hawaii
—
0
2
8
7
—
0
1
6
6
U
0
0
U
U
Oregon
—
0
2
9
17
2
0
4
31
40
—
0
3
13
15
Washington
1
0
4
24
20
1
0
4
26
43
—
0
5
32
19
Territories
American Samoa
—
0
0
—
—
—
0
0
—
—
—
0
0
—
—
C.N.M.I.
—
—
—
—
—
—
—
—
—
—
—
—
—
—
—
Guam
—
0
5
8
7
—
2
8
28
77
—
0
3
10
61
Puerto Rico
—
0
1
7
20
—
0
2
8
28
N
0
0
N
N
U.S. Virgin Islands
—
0
0
—
—
—
0
0
—
—
—
0
0
—
—
C.N.M.I.: Commonwealth of Northern Mariana Islands.
U: Unavailable. —: No reported cases. N: Not reportable. NN: Not Nationally Notifiable. Cum: Cumulative year-to-date counts. Med: Median. Max: Maximum.
† Contains data reported through the National Electronic Disease Surveillance System (NEDSS).
TABLE II. (Continued) Provisional cases of selected notifiable diseases, United States, weeks ending December 17, 2011, and December 18, 2010 (50th week)*
Reporting area
Legionellosis
Lyme disease
Malaria
Current week
Previous 52 weeks
Cum 2011
Cum 2010
Current week
Previous 52 weeks
Cum 2011
Cum 2010
Current week
Previous 52 weeks
Cum 2011
Cum 2010
Med
Max
Med
Max
Med
Max
United States
29
56
160
3,550
3,225
175
323
1,470
23,045
29,538
7
25
114
1,309
1,641
New England
—
5
39
390
264
1
76
493
6,743
8,838
—
2
20
87
102
Connecticut
—
1
10
74
53
—
30
227
2,606
3,033
—
0
20
12
2
Maine†
—
0
3
18
11
—
13
66
911
709
—
0
2
6
6
Massachusetts
—
3
24
235
127
—
19
106
1,354
3,255
—
1
6
56
71
New Hampshire
—
0
3
24
22
—
15
86
1,131
1,313
—
0
1
2
5
Rhode Island†
—
0
9
28
42
—
1
31
147
181
—
0
2
5
15
Vermont†
—
0
2
11
9
1
6
67
594
347
—
0
1
6
3
Mid. Atlantic
9
14
72
1,052
916
150
143
741
11,048
10,677
—
6
13
303
503
New Jersey
—
0
2
—
148
—
0
34
—
3,657
—
0
2
—
102
New York (Upstate)
7
5
27
371
286
56
50
213
3,664
2,540
—
1
4
50
75
New York City
—
3
14
200
161
—
1
12
110
720
—
4
10
198
268
Pennsylvania
2
5
37
481
321
94
90
516
7,274
3,760
—
1
5
55
58
E.N. Central
5
11
51
791
669
1
15
163
1,521
3,811
—
3
10
151
161
Illinois
—
1
11
121
145
—
1
18
164
135
—
1
5
55
60
Indiana
—
2
7
109
55
—
1
15
100
78
—
0
2
9
15
Michigan
1
3
15
188
178
1
1
12
107
94
—
0
4
32
31
Ohio
4
6
34
372
229
—
1
6
51
41
—
1
4
41
41
Wisconsin
—
0
1
1
62
—
12
121
1,099
3,463
—
0
2
14
14
W.N. Central
—
1
8
79
122
—
1
15
136
2,085
—
1
45
56
70
Iowa
—
0
2
11
15
—
0
12
82
85
—
0
3
22
14
Kansas
—
0
2
11
12
—
0
2
13
10
—
0
2
9
13
Minnesota
—
0
4
—
35
—
0
3
—
1,954
—
0
45
—
3
Missouri
—
1
5
47
37
—
0
2
8
4
—
0
2
20
21
Nebraska†
—
0
1
6
9
—
0
2
8
8
—
0
1
4
15
North Dakota
—
0
1
2
5
—
0
10
21
23
—
0
0
—
1
South Dakota
—
0
1
2
9
—
0
2
4
1
—
0
1
1
3
S. Atlantic
6
10
29
569
540
18
54
172
3,337
3,766
3
8
24
425
438
Delaware
—
0
4
24
17
—
12
48
804
644
—
0
3
7
2
District of Columbia
—
0
3
9
18
—
0
3
31
41
—
0
1
5
13
Florida
3
3
13
180
164
5
2
7
126
80
2
2
6
100
131
Georgia
—
1
3
41
63
—
0
5
25
10
—
1
5
73
69
Maryland†
1
2
14
128
110
9
19
114
1,231
1,611
1
2
14
125
99
North Carolina
1
1
7
77
62
—
0
12
70
80
—
0
6
38
52
South Carolina†
—
0
5
22
16
—
0
6
33
29
—
0
1
6
6
Virginia†
1
1
7
82
76
4
16
76
940
1,151
—
1
8
71
63
West Virginia
—
0
2
6
14
—
0
14
77
120
—
0
0
—
3
E.S. Central
2
2
11
163
132
1
1
5
61
43
—
0
4
35
31
Alabama†
—
0
2
26
22
1
0
2
22
2
—
0
3
6
9
Kentucky
—
1
4
47
27
—
0
1
2
5
—
0
2
9
8
Mississippi
—
0
3
13
12
—
0
1
3
—
—
0
1
1
2
Tennessee†
2
1
8
77
71
—
0
4
34
36
—
0
3
19
12
W.S. Central
1
2
13
130
168
2
1
29
52
112
1
0
18
31
95
Arkansas†
—
0
2
14
19
—
0
0
—
—
—
0
1
5
4
Louisiana
—
0
3
18
11
—
0
1
1
3
—
0
1
1
5
Oklahoma
—
0
3
9
13
—
0
0
—
—
1
0
1
6
5
Texas†
1
2
11
89
125
2
1
29
51
109
—
0
17
19
81
Mountain
—
2
8
103
168
—
0
4
42
28
1
1
5
62
65
Arizona
—
1
4
42
64
—
0
2
11
2
—
0
4
22
28
Colorado
—
0
1
6
31
—
0
1
1
3
1
0
3
22
21
Idaho†
—
0
1
8
8
—
0
2
4
9
—
0
1
2
3
Montana†
—
0
1
1
4
—
0
3
11
4
—
0
1
2
3
Nevada†
—
0
2
16
20
—
0
1
4
2
—
0
2
8
6
New Mexico†
—
0
2
11
9
—
0
2
5
5
—
0
1
3
1
Utah
—
0
2
15
24
—
0
1
4
3
—
0
1
3
3
Wyoming†
—
0
2
4
8
—
0
1
2
—
—
0
0
—
—
Pacific
6
5
21
273
246
2
2
11
105
178
2
3
11
159
176
Alaska
—
0
0
—
2
—
0
2
12
7
—
0
2
5
5
California
5
4
15
229
202
—
1
9
64
118
2
2
8
108
115
Hawaii
—
0
2
3
2
N
0
0
N
N
—
0
1
8
4
Oregon
—
0
3
19
16
—
0
2
12
39
—
0
4
17
14
Washington
1
0
6
22
24
2
0
6
17
14
—
0
3
21
38
Territories
American Samoa
N
0
0
N
N
N
0
0
N
N
—
0
1
1
—
C.N.M.I.
—
—
—
—
—
—
—
—
—
—
—
—
—
—
—
Guam
—
0
0
—
1
—
0
0
—
—
—
0
0
—
—
Puerto Rico
—
0
0
—
2
N
0
0
N
N
—
0
0
—
5
U.S. Virgin Islands
—
0
0
—
—
—
0
0
—
—
—
0
0
—
—
C.N.M.I.: Commonwealth of Northern Mariana Islands.
U: Unavailable. —: No reported cases. N: Not reportable. NN: Not Nationally Notifiable. Cum: Cumulative year-to-date counts. Med: Median. Max: Maximum.
† Contains data reported through the National Electronic Disease Surveillance System (NEDSS).
TABLE II. (Continued) Provisional cases of selected notifiable diseases, United States, weeks ending December 17, 2011, and December 18, 2010 (50th week)*
Reporting area
Meningococcal disease, invasive† All serogroups
Mumps
Pertussis
Current week
Previous 52 weeks
Cum 2011
Cum 2010
Current week
Previous 52 weeks
Cum 2011
Cum 2010
Current week
Previous 52 weeks
Cum 2011
Cum 2010
Med
Max
Med
Max
Med
Max
United States
2
12
53
643
761
4
7
47
337
2,547
168
287
2,925
14,249
23,983
New England
—
0
3
29
21
—
0
2
10
25
3
14
32
700
507
Connecticut
—
0
1
3
3
—
0
0
—
11
—
1
5
56
105
Maine§
—
0
1
5
5
—
0
2
2
2
2
3
19
199
51
Massachusetts
—
0
2
14
7
—
0
1
4
9
—
4
10
222
274
New Hampshire
—
0
1
1
—
—
0
0
—
3
1
2
13
143
20
Rhode Island§
—
0
1
1
1
—
0
2
3
—
—
0
4
28
40
Vermont§
—
0
3
5
5
—
0
1
1
—
—
0
10
52
17
Mid. Atlantic
—
1
5
70
77
—
1
23
48
2,115
54
31
112
1,731
1,801
New Jersey
—
0
1
—
21
—
0
2
10
353
—
3
10
168
164
New York (Upstate)
—
0
4
22
12
—
0
3
11
663
42
12
81
756
610
New York City
—
0
3
28
18
—
0
22
24
1,039
—
2
41
150
85
Pennsylvania
—
0
2
20
26
—
0
8
3
60
12
12
40
657
942
E.N. Central
—
2
6
94
127
1
2
6
85
79
28
65
129
3,120
5,512
Illinois
—
0
3
28
23
—
1
5
54
29
—
17
49
883
1,001
Indiana
—
0
2
19
29
—
0
1
1
4
—
4
18
243
729
Michigan
—
0
2
11
22
—
0
2
11
18
6
12
41
632
1,497
Ohio
—
0
2
23
32
1
0
2
15
23
19
13
45
733
1,738
Wisconsin
—
0
2
13
21
—
0
1
4
5
3
12
26
629
547
W.N. Central
—
1
3
51
57
—
0
4
32
81
10
20
501
1,117
2,384
Iowa
—
0
1
14
10
—
0
1
5
38
—
4
15
194
670
Kansas
—
0
1
4
8
—
0
1
4
4
—
2
8
87
177
Minnesota
—
0
1
—
8
—
0
4
1
4
—
0
469
326
662
Missouri
—
0
3
18
23
—
0
3
12
10
10
6
26
378
589
Nebraska§
—
0
2
11
6
—
0
1
6
23
—
1
7
51
206
North Dakota
—
0
1
1
2
—
0
3
4
—
—
0
10
51
51
South Dakota
—
0
1
3
—
—
0
0
—
2
—
0
7
30
29
S. Atlantic
—
2
8
125
129
—
0
4
36
56
15
26
106
1,340
1,854
Delaware
—
0
1
1
1
—
0
0
—
—
1
0
5
23
14
District of Columbia
—
0
1
1
1
—
0
0
—
3
—
0
2
6
15
Florida
—
1
5
49
58
—
0
2
10
8
4
6
17
309
307
Georgia
—
0
1
14
12
—
0
2
5
5
1
3
8
167
238
Maryland§
—
0
1
13
9
—
0
1
2
11
—
2
8
114
135
North Carolina
—
0
3
15
13
—
0
2
9
10
8
2
35
177
337
South Carolina§
—
0
1
9
12
—
0
1
1
4
1
2
25
140
363
Virginia§
—
0
2
16
21
—
0
4
9
13
—
6
41
341
320
West Virginia
—
0
3
7
2
—
0
0
—
2
—
0
41
63
125
E.S. Central
1
0
3
26
43
—
0
1
5
10
8
9
25
439
822
Alabama§
—
0
2
10
8
—
0
1
1
6
—
2
11
129
200
Kentucky
—
0
2
5
17
—
0
0
—
1
3
3
16
164
291
Mississippi
—
0
1
3
5
—
0
1
3
—
1
0
3
41
105
Tennessee§
1
0
2
8
13
—
0
1
1
3
4
2
10
105
226
W.S. Central
—
1
12
57
86
3
1
15
67
117
9
20
297
895
2,982
Arkansas§
—
0
2
12
6
—
0
2
3
5
—
1
16
58
226
Louisiana
—
0
2
12
15
—
0
0
—
8
—
0
3
17
46
Oklahoma
—
0
2
10
16
—
0
2
4
—
—
0
92
52
91
Texas§
—
0
10
23
49
3
1
14
60
104
9
18
187
768
2,619
Mountain
1
1
4
47
55
—
0
2
8
20
28
37
79
1,932
1,826
Arizona
—
0
1
11
13
—
0
0
—
5
—
13
28
656
516
Colorado
1
0
1
10
21
—
0
1
3
7
22
8
31
424
487
Idaho§
—
0
1
7
5
—
0
2
2
1
6
2
12
179
185
Montana§
—
0
2
4
2
—
0
0
—
—
—
1
32
130
113
Nevada§
—
0
1
5
8
—
0
0
—
1
—
0
5
31
38
New Mexico§
—
0
1
2
3
—
0
1
2
2
—
3
23
249
143
Utah
—
0
2
8
1
—
0
0
—
3
—
5
16
254
332
Wyoming§
—
0
1
—
2
—
0
1
1
1
—
0
1
9
12
Pacific
—
3
26
144
166
—
0
11
46
44
13
61
1,710
2,975
6,295
Alaska
—
0
1
3
1
—
0
1
1
1
—
0
4
25
41
California
—
2
17
100
110
—
0
11
37
29
4
37
1,569
1,940
5,462
Hawaii
—
0
1
4
1
—
0
1
2
4
2
1
9
92
64
Oregon
—
0
3
22
31
—
0
1
4
3
3
5
23
295
276
Washington
—
0
8
15
23
—
0
1
2
7
4
11
131
623
452
Territories
American Samoa
—
0
0
—
—
—
0
0
—
—
—
0
0
—
—
C.N.M.I.
—
—
—
—
—
—
—
—
—
—
—
—
—
—
—
Guam
—
0
0
—
—
—
1
3
12
484
—
2
14
31
3
Puerto Rico
—
0
0
—
2
—
0
1
1
1
—
0
1
2
4
U.S. Virgin Islands
—
0
0
—
—
—
0
0
—
—
—
0
0
—
—
C.N.M.I.: Commonwealth of Northern Mariana Islands.
U: Unavailable. —: No reported cases. N: Not reportable. NN: Not Nationally Notifiable. Cum: Cumulative year-to-date counts. Med: Median. Max: Maximum.
† Data for meningococcal disease, invasive caused by serogroups A, C, Y, and W-135; serogroup B; other serogroup; and unknown serogroup are available in Table I.
§ Contains data reported through the National Electronic Disease Surveillance System (NEDSS).
TABLE II. (Continued) Provisional cases of selected notifiable diseases, United States, weeks ending December 17, 2011, and December 18, 2010 (50th week)*
Reporting area
Rabies, animal
Salmonellosis
Shiga toxin-producing E. coli(STEC)†
Current week
Previous 52 weeks
Cum 2011
Cum 2010
Current week
Previous 52 weeks
Cum 2011
Cum 2010
Current week
Previous 52 weeks
Cum 2011
Cum 2010
Med
Max
Med
Max
Med
Max
United States
19
57
119
2,863
4,172
396
856
1,816
44,660
52,475
41
89
264
4,832
5,154
New England
2
4
16
253
301
5
36
107
2,028
2,306
—
3
13
209
209
Connecticut
—
2
10
121
142
—
8
30
445
491
—
1
4
53
60
Maine§
—
1
6
63
62
—
2
8
127
128
—
0
3
29
21
Massachusetts
—
0
0
—
—
—
19
44
1,041
1,266
—
1
9
80
82
New Hampshire
2
0
3
20
17
1
3
8
159
171
—
0
3
24
21
Rhode Island§
—
0
6
25
29
4
1
62
181
170
—
0
2
7
3
Vermont§
—
0
2
24
51
—
1
8
75
80
—
0
3
16
22
Mid. Atlantic
5
15
35
810
1,028
32
72
169
4,218
5,705
5
8
30
484
559
New Jersey
—
0
0
—
—
—
0
15
—
1,176
—
0
2
—
125
New York (Upstate)
5
7
20
361
485
18
25
67
1,356
1,388
5
3
12
213
196
New York City
—
0
3
9
145
—
19
42
1,085
1,288
—
1
6
89
79
Pennsylvania
—
8
21
440
398
14
30
111
1,777
1,853
—
3
18
182
159
E.N. Central
—
2
17
180
228
22
83
157
4,208
5,736
2
14
49
842
797
Illinois
—
0
6
50
114
—
27
80
1,527
1,942
—
4
14
215
152
Indiana
—
0
7
26
—
—
7
19
351
755
—
1
8
86
139
Michigan
—
1
6
57
68
8
14
42
814
918
—
3
19
179
152
Ohio
—
1
5
47
46
14
21
46
1,162
1,286
2
3
10
180
135
Wisconsin
N
0
0
N
N
—
7
45
354
835
—
2
20
182
219
W.N. Central
1
1
40
78
241
14
40
103
2,245
2,942
5
11
40
725
895
Iowa
—
0
0
—
27
1
9
19
441
520
—
2
15
183
170
Kansas
—
0
4
31
59
—
8
28
443
426
—
1
8
104
76
Minnesota
—
0
34
—
25
—
0
6
—
700
—
0
2
—
287
Missouri
1
0
0
1
63
13
16
46
933
821
5
5
32
292
233
Nebraska§
—
0
3
33
51
—
4
13
232
243
—
1
7
95
77
North Dakota
—
0
6
13
16
—
0
15
41
51
—
0
4
13
17
South Dakota
—
0
0
—
—
—
3
10
155
181
—
1
4
38
35
S. Atlantic
6
15
93
1,023
1,113
167
267
722
14,191
15,450
8
12
28
645
721
Delaware
—
0
0
—
—
—
2
11
164
175
—
0
2
15
6
District of Columbia
—
0
0
—
—
—
1
5
52
91
—
0
1
3
9
Florida
—
0
84
117
121
105
107
203
5,732
6,124
5
3
15
150
217
Georgia
—
0
0
—
—
15
40
127
2,361
2,750
—
2
8
116
98
Maryland§
—
5
13
247
358
14
18
42
931
1,064
3
1
6
59
106
North Carolina
—
0
0
—
—
21
31
251
2,270
2,271
—
2
11
120
97
South Carolina§
N
0
0
N
N
6
26
70
1,481
1,675
—
0
4
15
24
Virginia§
6
11
27
578
557
6
21
68
1,155
1,123
—
3
9
164
139
West Virginia
—
0
30
81
77
—
0
14
45
177
—
0
2
3
25
E.S. Central
1
3
11
170
169
18
61
190
4,075
3,898
1
5
18
263
267
Alabama§
1
2
7
81
69
7
18
70
1,199
1,038
—
0
15
71
55
Kentucky
—
0
2
16
21
—
10
30
569
583
—
1
5
67
70
Mississippi
—
0
1
1
—
3
21
66
1,315
1,203
—
0
4
24
30
Tennessee§
—
1
6
72
79
8
16
52
992
1,074
1
1
11
101
112
W.S. Central
3
1
31
112
826
56
118
515
6,371
7,217
2
9
151
418
367
Arkansas§
3
0
10
57
34
10
14
53
842
763
—
1
6
60
48
Louisiana
—
0
0
—
—
5
14
44
971
1,342
—
0
1
12
20
Oklahoma
—
0
21
55
42
14
12
95
713
651
1
1
55
71
49
Texas§
—
0
12
—
750
27
83
381
3,845
4,461
1
6
95
275
250
Mountain
1
0
4
42
66
25
44
93
2,381
2,834
3
10
26
532
668
Arizona
N
0
0
N
N
13
14
34
775
978
1
2
7
81
98
Colorado
—
0
0
—
—
9
10
24
528
561
1
2
7
106
219
Idaho§
—
0
1
6
11
—
3
8
141
162
—
2
8
116
108
Montana§
N
0
0
N
N
2
2
10
124
94
1
0
5
39
41
Nevada§
—
0
2
16
8
1
3
8
158
302
—
0
7
39
41
New Mexico§
1
0
2
13
13
—
5
22
309
333
—
1
3
41
49
Utah
—
0
2
7
10
—
5
15
291
342
—
1
7
85
93
Wyoming§
—
0
0
—
24
—
1
9
55
62
—
0
7
25
19
Pacific
—
3
15
195
200
57
100
288
4,943
6,387
15
15
46
714
671
Alaska
—
0
2
12
12
—
1
6
52
79
—
0
1
4
2
California
—
3
12
169
171
32
74
232
3,777
4,767
6
9
36
442
310
Hawaii
—
0
0
—
—
3
7
14
332
318
—
0
2
9
28
Oregon
—
0
1
14
17
1
5
12
251
501
1
1
11
101
115
Washington
—
0
14
—
—
21
9
42
531
722
8
2
13
158
216
Territories
American Samoa
N
0
0
N
N
—
0
0
—
2
—
0
0
—
—
C.N.M.I.
—
—
—
—
—
—
—
—
—
—
—
—
—
—
—
Guam
—
0
0
—
—
—
0
3
6
11
—
0
0
—
—
Puerto Rico
—
0
6
38
41
3
3
12
193
604
—
0
0
—
—
U.S. Virgin Islands
—
0
0
—
—
—
0
0
—
—
—
0
0
—
—
C.N.M.I.: Commonwealth of Northern Mariana Islands.
U: Unavailable. —: No reported cases. N: Not reportable. NN: Not Nationally Notifiable. Cum: Cumulative year-to-date counts. Med: Median. Max: Maximum.
† Includes E. coli O157:H7; Shiga toxin-positive, serogroup non-O157; and Shiga toxin-positive, not serogrouped.
§ Contains data reported through the National Electronic Disease Surveillance System (NEDSS).
TABLE II. (Continued) Provisional cases of selected notifiable diseases, United States, weeks ending December 17, 2011, and December 18, 2010 (50th week)*
Spotted Fever Rickettsiosis (including RMSF)†
Reporting area
Shigellosis
Confirmed
Probable
Current week
Previous 52 weeks
Cum 2011
Cum 2010
Current week
Previous 52 weeks
Cum 2011
Cum 2010
Current week
Previous 52 weeks
Cum 2011
Cum 2010
Med
Max
Med
Max
Med
Max
United States
165
233
742
11,244
13,765
3
3
15
202
145
9
26
245
1,952
1,570
New England
—
5
21
261
316
—
0
1
1
—
—
0
1
8
5
Connecticut
—
0
4
37
69
—
0
0
—
—
—
0
0
—
—
Maine§
—
0
8
32
8
—
0
0
—
—
—
0
1
1
2
Massachusetts
—
3
20
175
208
—
0
0
—
—
—
0
1
4
—
New Hampshire
—
0
1
3
14
—
0
1
1
—
—
0
1
1
1
Rhode Island§
—
0
3
8
16
—
0
0
—
—
—
0
1
2
2
Vermont§
—
0
1
6
1
—
0
0
—
—
—
0
0
—
—
Mid. Atlantic
20
14
74
809
1,558
1
0
2
20
2
3
1
4
59
101
New Jersey
—
0
3
—
367
—
0
0
—
1
—
0
1
—
59
New York (Upstate)
18
5
20
322
218
1
0
1
5
1
2
0
1
10
17
New York City
2
6
27
369
294
—
0
0
—
—
—
0
3
29
11
Pennsylvania
—
2
56
118
679
—
0
2
15
—
1
0
3
20
14
E.N. Central
7
14
40
716
1,516
1
0
2
9
3
—
2
9
113
77
Illinois
—
4
16
204
828
—
0
1
2
2
—
1
4
47
34
Indiana§
—
1
4
45
62
—
0
1
2
1
—
0
4
46
20
Michigan
1
3
10
169
251
1
0
1
2
—
—
0
1
2
1
Ohio
6
4
27
298
302
—
0
2
3
—
—
0
2
18
15
Wisconsin
—
0
1
—
73
—
0
0
—
—
—
0
0
—
7
W.N. Central
1
5
18
288
2,042
—
0
4
27
13
1
4
29
346
275
Iowa
—
0
4
20
55
—
0
0
—
—
—
0
2
7
5
Kansas§
—
1
6
60
291
—
0
0
—
—
—
0
0
—
—
Minnesota
—
0
2
—
66
—
0
0
—
—
—
0
2
—
—
Missouri
1
3
14
188
1,567
—
0
3
19
10
1
4
29
334
267
Nebraska§
—
0
2
14
56
—
0
3
5
3
—
0
1
5
2
North Dakota
—
0
0
—
—
—
0
1
2
—
—
0
0
—
1
South Dakota
—
0
2
6
7
—
0
1
1
—
—
0
0
—
—
S. Atlantic
65
73
134
3,691
2,657
1
1
8
104
82
3
6
55
550
503
Delaware§
—
0
2
6
39
—
0
1
1
1
—
0
4
18
21
District of Columbia
—
0
5
20
34
—
0
1
1
1
—
0
1
3
—
Florida§
49
50
98
2,575
1,135
—
0
1
3
3
1
0
2
13
11
Georgia
10
10
24
567
777
—
1
6
65
57
—
0
0
—
—
Maryland§
2
1
7
98
129
1
0
1
4
—
—
0
2
30
49
North Carolina
1
3
19
205
237
—
0
4
15
15
—
0
49
264
269
South Carolina§
1
1
52
117
69
—
0
2
11
1
—
0
2
21
19
Virginia§
2
2
8
99
133
—
0
1
4
4
2
3
14
197
134
West Virginia
—
0
5
4
104
—
0
0
—
—
—
0
1
4
—
E.S. Central
3
17
46
930
770
—
0
2
14
20
2
4
25
334
403
Alabama§
1
5
21
285
229
—
0
1
5
5
1
1
8
73
78
Kentucky
—
3
22
227
221
—
0
1
3
6
—
0
1
1
—
Mississippi
1
4
24
228
58
—
0
0
—
1
—
0
2
12
25
Tennessee§
1
4
11
190
262
—
0
2
6
8
1
3
20
248
300
W.S. Central
41
52
503
2,711
2,852
—
0
8
11
7
—
2
235
485
185
Arkansas§
2
2
7
78
77
—
0
3
6
2
—
0
50
416
130
Louisiana
3
5
21
277
287
—
0
0
—
—
—
0
2
7
3
Oklahoma
8
2
161
207
254
—
0
5
3
3
—
0
202
43
26
Texas§
28
42
338
2,149
2,234
—
0
1
2
2
—
0
5
19
26
Mountain
10
15
42
794
836
—
0
4
15
12
—
1
7
57
20
Arizona
6
5
27
369
459
—
0
4
15
9
—
0
6
40
8
Colorado§
1
1
8
99
96
—
0
0
—
1
—
0
1
2
1
Idaho§
—
0
3
16
23
—
0
0
—
—
—
0
1
1
5
Montana§
1
1
15
123
9
—
0
0
—
2
—
0
1
1
1
Nevada§
2
0
4
33
48
—
0
0
—
—
—
0
1
2
—
New Mexico§
—
2
7
105
154
—
0
0
—
—
—
0
0
—
1
Utah
—
1
4
47
47
—
0
0
—
—
—
0
1
1
3
Wyoming§
—
0
1
2
—
—
0
0
—
—
—
0
2
10
1
Pacific
18
20
63
1,044
1,218
—
0
2
1
6
—
0
0
—
1
Alaska
—
0
2
5
2
N
0
0
N
N
N
0
0
N
N
California
6
16
59
859
1,002
—
0
1
1
6
—
0
0
—
—
Hawaii
—
1
3
44
46
N
0
0
N
N
N
0
0
N
N
Oregon
2
1
4
44
58
—
0
0
—
—
—
0
0
—
1
Washington
10
1
6
92
110
—
0
1
—
—
—
0
0
—
—
Territories
American Samoa
—
0
1
1
4
N
0
0
N
N
N
0
0
N
N
C.N.M.I.
—
—
—
—
—
—
—
—
—
—
—
—
—
—
—
Guam
—
0
1
1
5
N
0
0
N
N
N
0
0
N
N
Puerto Rico
—
0
1
—
6
N
0
0
N
N
N
0
0
N
N
U.S. Virgin Islands
—
0
0
—
—
—
0
0
—
—
—
0
0
—
—
C.N.M.I.: Commonwealth of Northern Mariana Islands.
U: Unavailable. —: No reported cases. N: Not reportable. NN: Not Nationally Notifiable. Cum: Cumulative year-to-date counts. Med: Median. Max: Maximum.
† Illnesses with similar clinical presentation that result from Spotted fever group rickettsia infections are reported as Spotted fever rickettsioses. Rocky Mountain spotted fever (RMSF) caused by Rickettsia rickettsii, is the most common and well-known spotted fever.
§ Contains data reported through the National Electronic Disease Surveillance System (NEDSS).
TABLE II. (Continued) Provisional cases of selected notifiable diseases, United States, weeks ending December 17, 2011, and December 18, 2010 (50th week)*
Streptococcus pneumoniae,† invasive disease
Reporting area
All ages
Age <5
Syphilis, primary and secondary
Current week
Previous 52 weeks
Cum 2011
Cum 2010
Current week
Previous 52 weeks
Cum 2011
Cum 2010
Current week
Previous 52 weeks
Cum 2011
Cum 2010
Med
Max
Med
Max
Med
Max
United States
154
241
937
12,202
15,052
17
24
118
1,149
2,019
69
262
363
12,325
13,213
New England
3
13
79
678
851
—
1
5
45
100
1
7
16
356
463
Connecticut
—
6
49
282
340
—
0
3
10
27
—
0
5
41
93
Maine§
2
2
13
124
116
—
0
1
4
10
—
0
2
12
31
Massachusetts
—
1
3
35
67
—
0
2
18
44
—
5
10
237
277
New Hampshire
—
2
8
97
129
—
0
1
5
5
—
0
3
18
22
Rhode Island§
—
1
6
73
117
—
0
1
2
8
—
0
7
39
37
Vermont§
1
1
6
67
82
—
0
2
6
6
1
0
2
9
3
Mid. Atlantic
8
14
81
691
1,576
2
1
27
75
232
11
31
53
1,474
1,636
New Jersey
—
0
29
—
705
—
0
4
—
58
—
5
13
212
235
New York (Upstate)
3
1
10
83
144
2
1
9
46
110
5
3
20
181
124
New York City
5
11
42
608
727
—
0
14
29
64
2
15
30
725
921
Pennsylvania
N
0
0
N
N
N
0
0
N
N
4
6
15
356
356
E.N. Central
45
61
115
2,897
3,123
5
5
13
240
358
—
30
47
1,429
1,839
Illinois
N
0
0
N
N
—
1
6
73
95
—
12
24
584
880
Indiana
1
13
33
648
733
—
1
3
32
55
—
3
8
153
169
Michigan
3
14
26
631
710
—
1
3
34
80
—
5
12
243
227
Ohio
35
26
44
1,207
1,175
3
2
7
80
94
—
8
17
398
514
Wisconsin
6
8
24
411
505
2
0
3
21
34
—
1
5
51
49
W.N. Central
—
2
33
162
829
—
1
4
64
153
1
6
13
278
346
Iowa
N
0
0
N
N
N
0
0
N
N
—
0
3
18
18
Kansas
N
0
0
N
N
N
0
0
N
N
—
0
4
24
19
Minnesota
—
0
17
—
620
—
0
1
—
85
—
2
8
109
145
Missouri
N
0
0
N
N
—
0
4
36
39
—
2
6
117
147
Nebraska§
—
2
9
108
136
—
0
2
12
16
1
0
2
9
10
North Dakota
—
0
25
54
73
—
0
1
2
2
—
0
1
1
3
South Dakota
N
0
0
N
N
—
0
2
14
11
—
0
0
—
4
S. Atlantic
44
66
170
3,524
4,000
5
6
25
325
540
34
68
178
3,268
3,072
Delaware
—
1
6
47
40
—
0
1
—
—
4
0
4
24
5
District of Columbia
—
1
4
44
75
—
0
1
5
9
2
3
8
152
132
Florida
26
22
68
1,265
1,401
3
3
13
127
188
5
24
36
1,151
1,157
Georgia
11
20
54
980
1,364
1
2
5
83
159
14
14
130
734
663
Maryland§
7
9
33
524
506
1
1
3
41
52
—
8
20
417
308
North Carolina
N
0
0
N
N
N
0
0
N
N
4
8
19
366
383
South Carolina§
—
7
25
408
493
—
0
3
28
55
4
4
11
215
144
Virginia§
N
0
0
N
N
—
0
3
27
55
1
4
12
207
274
West Virginia
—
0
48
256
121
—
0
6
14
22
—
0
1
2
6
E.S. Central
10
18
37
867
1,028
2
1
4
70
111
5
14
34
720
858
Alabama§
N
0
0
N
N
N
0
0
N
N
1
4
11
201
249
Kentucky
N
0
0
N
N
N
0
0
N
N
4
2
16
120
122
Mississippi
N
0
0
N
N
—
0
2
11
17
—
3
14
167
214
Tennessee§
10
18
37
867
1,028
2
1
4
59
94
—
5
11
232
273
W.S. Central
25
31
368
1,709
1,843
3
4
38
197
287
6
35
50
1,711
2,030
Arkansas§
6
4
26
212
164
1
0
3
14
18
4
3
10
181
203
Louisiana
—
2
11
157
137
—
0
2
16
27
2
6
25
366
537
Oklahoma
N
0
0
N
N
1
1
8
36
46
—
1
4
50
88
Texas§
19
24
333
1,340
1,542
1
2
27
131
196
—
23
37
1,114
1,202
Mountain
19
27
72
1,528
1,693
—
3
8
118
221
—
11
20
541
599
Arizona
11
12
45
714
772
—
1
5
53
97
—
5
10
226
218
Colorado
8
9
23
489
519
—
0
4
33
63
—
2
6
104
137
Idaho§
N
0
0
N
N
—
0
1
5
8
—
0
4
12
4
Montana§
N
0
0
N
N
N
0
0
N
N
—
0
1
4
3
Nevada§
N
0
0
N
N
N
0
0
N
N
—
2
9
127
124
New Mexico§
—
4
13
225
157
—
0
2
15
17
—
1
4
57
51
Utah
—
1
8
77
216
—
0
3
12
32
—
0
2
11
62
Wyoming§
—
0
3
23
29
—
0
0
—
4
—
0
0
—
—
Pacific
—
3
11
146
109
—
0
2
15
17
11
53
74
2,548
2,370
Alaska
—
2
11
139
105
—
0
1
11
17
—
0
1
3
3
California
N
0
0
N
N
N
0
0
N
N
6
42
62
2,077
2,006
Hawaii
—
0
1
7
4
—
0
1
4
—
—
0
2
11
35
Oregon
N
0
0
N
N
N
0
0
N
N
2
4
14
185
70
Washington
N
0
0
N
N
N
0
0
N
N
3
5
11
272
256
Territories
American Samoa
N
0
0
N
N
—
0
0
—
—
—
0
0
—
—
C.N.M.I.
—
—
—
—
—
—
—
—
—
—
—
—
—
—
—
Guam
—
0
0
—
—
—
0
0
—
—
—
0
0
—
—
Puerto Rico
—
0
0
—
—
—
0
0
—
—
—
4
14
232
215
U.S. Virgin Islands
—
0
0
—
—
—
0
0
—
—
—
0
0
—
—
C.N.M.I.: Commonwealth of Northern Mariana Islands.
U: Unavailable. —: No reported cases. N: Not reportable. NN: Not Nationally Notifiable. Cum: Cumulative year-to-date counts. Med: Median. Max: Maximum.
† Includes drug resistant and susceptible cases of invasive Streptococcus pneumoniae disease among children <5 years and among all ages. Case definition: Isolation of S. pneumoniae from a normally sterile body site (e.g., blood or cerebrospinal fluid).
§ Contains data reported through the National Electronic Disease Surveillance System (NEDSS).
TABLE II. (Continued) Provisional cases of selected notifiable diseases, United States, weeks ending December 17, 2011, and December 18, 2010 (50th week)*
West Nile virus disease†
Reporting area
Varicella (chickenpox)
Neuroinvasive
Nonneuroinvasive§
Current week
Previous 52 weeks
Cum 2011
Cum 2010
Current week
Previous 52 weeks
Cum 2011
Cum 2010
Current week
Previous 52 weeks
Cum 2011
Cum 2010
Med
Max
Med
Max
Med
Max
United States
147
256
364
11,542
14,856
—
0
59
460
629
—
0
32
222
392
New England
4
23
50
1,149
1,127
—
0
3
14
14
—
0
1
2
5
Connecticut
2
5
16
283
315
—
0
2
8
7
—
0
1
1
4
Maine¶
—
4
11
201
237
—
0
0
—
—
—
0
0
—
—
Massachusetts
—
9
18
429
253
—
0
2
4
6
—
0
1
1
1
New Hampshire
—
1
7
102
156
—
0
0
—
1
—
0
0
—
—
Rhode Island¶
—
0
6
34
46
—
0
1
1
—
—
0
0
—
—
Vermont¶
2
1
9
100
120
—
0
1
1
—
—
0
0
—
—
Mid. Atlantic
15
19
42
963
1,685
—
0
11
34
123
—
0
6
22
63
New Jersey
—
0
9
—
559
—
0
1
2
15
—
0
2
5
15
New York (Upstate)
N
0
0
N
N
—
0
5
18
56
—
0
4
14
30
New York City
—
0
0
—
—
—
0
4
9
33
—
0
1
2
9
Pennsylvania
15
19
39
963
1,126
—
0
2
5
19
—
0
1
1
9
E.N. Central
49
63
110
2,965
4,793
—
0
13
73
80
—
0
6
27
30
Illinois
1
14
31
713
1,183
—
0
6
22
45
—
0
5
12
16
Indiana¶
11
5
20
268
355
—
0
2
7
6
—
0
1
2
7
Michigan
16
18
43
970
1,435
—
0
7
32
25
—
0
1
1
4
Ohio
21
21
58
1,012
1,311
—
0
3
10
4
—
0
3
11
1
Wisconsin
—
0
13
2
509
—
0
1
2
—
—
0
1
1
2
W.N. Central
—
21
64
702
979
—
0
9
31
32
—
0
7
29
75
Iowa
N
0
0
N
N
—
0
2
5
5
—
0
2
4
4
Kansas¶
—
15
61
403
372
—
0
1
4
4
—
0
0
—
15
Minnesota
—
0
1
1
—
—
0
1
1
4
—
0
1
1
4
Missouri
—
3
24
200
474
—
0
2
6
3
—
0
2
4
—
Nebraska¶
—
0
2
7
25
—
0
4
14
10
—
0
3
15
29
North Dakota
—
0
10
36
49
—
0
1
1
2
—
0
1
3
7
South Dakota
—
1
6
55
59
—
0
0
—
4
—
0
1
2
16
S. Atlantic
10
32
65
1,674
2,049
—
0
10
52
38
—
0
7
28
22
Delaware¶
—
0
1
8
39
—
0
1
1
—
—
0
0
—
—
District of Columbia
—
0
2
12
20
—
0
1
3
3
—
0
5
11
3
Florida¶
7
17
38
837
952
—
0
5
20
9
—
0
2
3
3
Georgia
N
0
0
N
N
—
0
2
7
4
—
0
1
5
9
Maryland¶
N
0
0
N
N
—
0
5
10
17
—
0
3
9
6
North Carolina
N
0
0
N
N
—
0
1
2
—
—
0
0
—
—
South Carolina¶
—
0
9
12
77
—
0
0
—
1
—
0
0
—
—
Virginia¶
3
8
26
437
529
—
0
2
8
4
—
0
0
—
1
West Virginia
—
5
32
368
432
—
0
1
1
—
—
0
0
—
—
E.S. Central
5
5
15
258
298
—
0
11
55
8
—
0
5
25
10
Alabama¶
4
5
14
245
289
—
0
2
5
1
—
0
0
—
2
Kentucky
N
0
0
N
N
—
0
2
4
2
—
0
1
1
1
Mississippi
1
0
3
13
9
—
0
5
30
3
—
0
4
22
5
Tennessee¶
N
0
0
N
N
—
0
3
16
2
—
0
1
2
2
W.S. Central
49
48
258
2,609
2,769
—
0
4
26
104
—
0
3
11
20
Arkansas¶
—
5
20
292
192
—
0
1
1
6
—
0
0
—
1
Louisiana
—
1
6
75
89
—
0
1
6
20
—
0
2
4
7
Oklahoma
N
0
0
N
N
—
0
0
—
1
—
0
0
—
—
Texas¶
49
43
247
2,242
2,488
—
0
3
19
77
—
0
3
7
12
Mountain
15
18
65
1,089
1,035
—
0
10
65
157
—
0
5
33
127
Arizona
—
4
50
418
—
—
0
6
43
107
—
0
4
19
60
Colorado¶
12
4
31
279
399
—
0
2
2
26
—
0
2
5
55
Idaho¶
N
0
0
N
N
—
0
1
1
—
—
0
1
1
1
Montana¶
1
2
28
133
188
—
0
1
1
—
—
0
0
—
—
Nevada¶
N
0
0
N
N
—
0
4
12
—
—
0
2
4
2
New Mexico¶
2
1
4
43
95
—
0
1
4
21
—
0
0
—
4
Utah
—
3
26
204
332
—
0
1
1
1
—
0
1
2
1
Wyoming¶
—
0
1
12
21
—
0
1
1
2
—
0
1
2
4
Pacific
—
3
9
133
121
—
0
18
110
73
—
0
7
45
40
Alaska
—
1
4
64
48
—
0
0
—
—
—
0
0
—
—
California
—
0
4
29
35
—
0
18
110
72
—
0
7
45
39
Hawaii
—
1
4
40
38
—
0
0
—
—
—
0
0
—
—
Oregon
N
0
0
N
N
—
0
0
—
—
—
0
0
—
—
Washington
N
0
0
N
N
—
0
0
—
1
—
0
0
—
1
Territories
American Samoa
N
0
0
N
N
—
0
0
—
—
—
0
0
—
—
C.N.M.I.
—
—
—
—
—
—
—
—
—
—
—
—
—
—
—
Guam
—
2
4
16
28
—
0
0
—
—
—
0
0
—
—
Puerto Rico
—
4
14
179
619
—
0
0
—
—
—
0
0
—
—
U.S. Virgin Islands
—
0
0
—
—
—
0
0
—
—
—
0
0
—
—
C.N.M.I.: Commonwealth of Northern Mariana Islands.
U: Unavailable. —: No reported cases. N: Not reportable. NN: Not Nationally Notifiable. Cum: Cumulative year-to-date counts. Med: Median. Max: Maximum.
† Updated weekly from reports to the Division of Vector-Borne Infectious Diseases, National Center for Zoonotic, Vector-Borne, and Enteric Diseases (ArboNET Surveillance). Data for California serogroup, eastern equine, Powassan, St. Louis, and western equine diseases are available in Table I.
§ Not reportable in all states. Data from states where the condition is not reportable are excluded from this table, except starting in 2007 for the domestic arboviral diseases and influenza-associated pediatric mortality, and in 2003 for SARS-CoV. Reporting exceptions are available at http://www.cdc.gov/osels/ph_surveillance/nndss/phs/infdis.htm.
¶ Contains data reported through the National Electronic Disease Surveillance System (NEDSS).
TABLE III. Deaths in 122 U.S. cities,* week ending December 17, 2011 (50th week)
Reporting area
All causes, by age (years)
P&I† Total
Reporting area (Continued)
All causes, by age (years)
P&I† Total
All Ages
=65
45–64
25–44
1–24
<1
All Ages
=65
45–64
25–44
1–24
<1
New England
498
340
111
28
13
6
36
S. Atlantic
1,137
696
303
79
32
27
56
Boston, MA
135
85
34
7
7
2
13
Atlanta, GA
154
74
60
11
5
4
6
Bridgeport, CT
28
21
5
1
—
1
1
Baltimore, MD
173
83
62
16
7
5
9
Cambridge, MA
16
10
5
—
1
—
—
Charlotte, NC
138
87
31
11
7
2
8
Fall River, MA
24
20
3
1
—
—
4
Jacksonville, FL
21
17
3
1
—
—
1
Hartford, CT
47
28
15
2
1
1
1
Miami, FL
102
70
19
9
2
2
6
Lowell, MA
20
15
5
—
—
—
2
Norfolk, VA
52
33
9
4
3
3
6
Lynn, MA
4
3
—
—
1
—
—
Richmond, VA
65
36
18
7
3
1
—
New Bedford, MA
23
16
5
1
1
—
1
Savannah, GA
55
36
12
6
—
1
1
New Haven, CT
37
21
8
6
1
1
—
St. Petersburg, FL
57
41
11
2
2
1
4
Providence, RI
43
30
5
7
1
—
2
Tampa, FL
203
143
47
5
1
7
11
Somerville, MA
4
3
1
—
—
—
—
Washington, D.C.
103
65
28
7
2
1
3
Springfield, MA
30
20
9
1
—
—
4
Wilmington, DE
14
11
3
—
—
—
1
Waterbury, CT
35
29
5
1
—
—
1
E.S. Central
976
631
245
53
24
23
82
Worcester, MA
52
39
11
1
—
1
7
Birmingham, AL
193
126
47
8
4
8
15
Mid. Atlantic
2,149
1,485
495
102
39
28
81
Chattanooga, TN
118
83
26
5
3
1
7
Albany, NY
62
46
12
1
1
2
1
Knoxville, TN
110
84
24
2
—
—
16
Allentown, PA
21
16
4
1
—
—
3
Lexington, KY
71
46
15
7
1
2
4
Buffalo, NY
81
59
18
4
—
—
4
Memphis, TN
175
95
59
10
5
6
18
Camden, NJ
22
12
7
—
2
1
—
Mobile, AL
125
81
30
8
5
1
9
Elizabeth, NJ
19
9
10
—
—
—
2
Montgomery, AL
43
28
9
3
1
2
2
Erie, PA
53
43
8
2
—
—
3
Nashville, TN
141
88
35
10
5
3
11
Jersey City, NJ
15
8
5
2
—
—
1
W.S. Central
1,249
798
311
78
30
27
64
New York City, NY
1,168
811
262
53
25
17
38
Austin, TX
92
61
25
4
2
—
6
Newark, NJ
49
27
13
8
1
—
1
Baton Rouge, LA
64
44
15
4
1
—
—
Paterson, NJ
U
U
U
U
U
U
U
Corpus Christi, TX
65
35
18
9
3
—
5
Philadelphia, PA
357
214
106
21
9
7
11
Dallas, TX
242
151
62
19
5
3
11
Pittsburgh, PA§
32
24
6
1
1
—
1
El Paso, TX
83
64
13
5
1
—
3
Reading, PA
36
28
7
1
—
—
—
Fort Worth, TX
U
U
U
U
U
U
U
Rochester, NY
67
51
13
2
—
1
5
Houston, TX
92
53
23
4
3
8
4
Schenectady, NY
22
18
4
—
—
—
4
Little Rock, AR
73
47
19
3
—
3
4
Scranton, PA
28
23
2
3
—
—
1
New Orleans, LA
U
U
U
U
U
U
U
Syracuse, NY
77
61
14
2
—
—
3
San Antonio, TX
288
180
77
16
10
5
20
Trenton, NJ
13
11
2
—
—
—
1
Shreveport, LA
114
65
32
7
3
7
1
Utica, NY
10
9
—
1
—
—
1
Tulsa, OK
136
98
27
7
2
1
10
Yonkers, NY
17
15
2
—
—
—
1
Mountain
1,194
839
247
61
25
21
76
E.N. Central
2,198
1,454
534
113
51
46
142
Albuquerque, NM
89
64
16
3
6
—
9
Akron, OH
69
46
19
2
—
2
9
Boise, ID
56
42
11
1
1
1
4
Canton, OH
41
24
15
1
—
1
3
Colorado Springs, CO
71
50
14
2
2
3
—
Chicago, IL
245
162
52
17
12
2
22
Denver, CO
91
63
18
6
1
3
5
Cincinnati, OH
73
44
22
2
2
3
6
Las Vegas, NV
314
225
66
12
7
4
18
Cleveland, OH
247
171
52
11
8
5
15
Ogden, UT
24
16
4
4
—
—
2
Columbus, OH
365
242
84
24
6
9
25
Phoenix, AZ
180
120
43
9
2
6
13
Dayton, OH
135
97
27
6
2
3
10
Pueblo, CO
48
26
16
6
—
—
2
Detroit, MI
193
94
69
21
4
5
—
Salt Lake City, UT
124
85
26
9
4
—
13
Evansville, IN
48
29
18
1
—
—
3
Tucson, AZ
197
148
33
9
2
4
10
Fort Wayne, IN
68
46
14
5
3
—
4
Pacific
1,834
1,308
376
93
33
23
181
Gary, IN
11
7
3
—
1
—
—
Berkeley, CA
9
6
3
—
—
—
1
Grand Rapids, MI
67
54
10
1
—
2
6
Fresno, CA
132
82
29
11
7
3
23
Indianapolis, IN
188
122
50
5
5
6
12
Glendale, CA
27
21
5
1
—
—
7
Lansing, MI
70
55
14
1
—
—
5
Honolulu, HI
69
51
12
3
—
3
6
Milwaukee, WI
99
59
29
6
2
3
7
Long Beach, CA
70
49
14
3
3
1
9
Peoria, IL
47
32
10
2
—
3
2
Los Angeles, CA
292
208
60
16
4
4
41
Rockford, IL
42
29
10
1
2
—
2
Pasadena, CA
25
20
3
2
—
—
2
South Bend, IN
42
29
8
2
1
2
4
Portland, OR
143
94
36
8
3
1
6
Toledo, OH
76
58
13
2
3
—
5
Sacramento, CA
203
146
48
6
1
2
17
Youngstown, OH
72
54
15
3
—
—
2
San Diego, CA
201
149
36
11
3
2
8
W.N. Central
744
456
201
55
17
15
46
San Francisco, CA
118
86
23
8
—
1
13
Des Moines, IA
101
67
26
6
1
1
4
San Jose, CA
198
146
30
12
7
3
23
Duluth, MN
32
24
7
1
—
—
1
Santa Cruz, CA
46
37
7
1
1
—
5
Kansas City, KS
24
16
6
1
1
—
1
Seattle, WA
111
73
29
5
1
3
6
Kansas City, MO
106
64
29
9
1
3
3
Spokane, WA
68
56
10
1
1
—
3
Lincoln, NE
42
30
9
2
1
—
—
Tacoma, WA
122
84
31
5
2
—
11
Minneapolis, MN
65
38
19
5
1
2
8
Total¶
11,979
8,007
2,823
662
264
216
764
Omaha, NE
83
53
19
8
1
2
9
St. Louis, MO
151
70
55
15
8
3
10
St. Paul, MN
62
35
17
6
2
2
2
Wichita, KS
78
59
14
2
1
2
8
U: Unavailable. —: No reported cases.
* Mortality data in this table are voluntarily reported from 122 cities in the United States, most of which have populations of >100,000. A death is reported by the place of its occurrence and by the week that the death certificate was filed. Fetal deaths are not included.
† Pneumonia and influenza.
§ Because of changes in reporting methods in this Pennsylvania city, these numbers are partial counts for the current week. Complete counts will be available in 4 to 6 weeks.