|
Persons using assistive technology might not be able to fully access information in this file. For assistance, please send e-mail to: mmwrq@cdc.gov. Type 508 Accommodation and the title of the report in the subject line of e-mail. Cancer Screening — United States, 2010Each year, approximately 350,000 persons are diagnosed with breast, cervical, or colorectal cancer in the United States, and nearly 100,000 die from these diseases (1). The U.S. Preventive Services Task Force (USPSTF) recommends screening tests for each of these cancers to reduce morbidity and mortality (2). Healthy People 2020 sets national objectives for use of the recommended cancer screening tests and identifies the National Health Interview Survey (NHIS) as the means to measure progress. Data from the 2010 NHIS were analyzed to assess use of the recommended tests by age, race, ethnicity, education, length of U.S. residence, and source and financing of health care to identify groups not receiving the full benefits of screening and to target specific interventions to increase screening rates. Overall, the breast cancer screening rate was 72.4% (below the Healthy People 2020 target of 81.1%), cervical cancer screening was 83.0% (below the target of 93.0%), and colorectal cancer screening was 58.6% (below the target of 70.5%). Screening rates for all three cancer screening tests were significantly lower among Asians than among whites and blacks. Hispanics were less likely to be screened for cervical and colorectal cancer. Higher screening rates were positively associated with education, availability and use of health care, and length of U.S. residence. Continued monitoring of screening rates helps to assess progress toward meeting Healthy People 2020 targets and to develop strategies to reach those targets. NHIS is a periodic, nationwide, household survey of a representative sample of the U.S. civilian noninstitutionalized population; it includes cancer screening questions on the adult questionnaire. Respondents are asked whether they have been screened with specific tests for cancer, and if they have, when the tests were performed last. For this analysis, because the questionnaire did not distinguish between tests for screening and those performed for other reasons, any report of testing for cancer was categorized as a screening test. Reports of screening were used to determine the portion of the population up-to-date for screenings recommended by USPSTF (2). Since 2006, NHIS has oversampled Hispanic and Asian populations (3), increasing the ability to examine screening use among specific racial and ethnic subgroups. Asians were categorized as Chinese, Filipino, or other Asian. Hispanics were categorized as Puerto Rican, Mexican, Mexican-American, Central or South American, or other Hispanic. Sampling weights were applied to account for the probability of selection. Screening percentages and 95% confidence intervals (CIs) were calculated using statistical software to account for complex sample design. Linear trends during 2000–2010 were tested for men and women separately using unadjusted logistic regression models. The conditional response rate for the 2010 NHIS adult sample was 77.3%, and the final response rate was 60.8% (3). Breast Cancer Screening USPSTF recommends that women aged 50–74 years be screened for breast cancer by mammography every 2 years (2). Based on responses to the 2010 NHIS, 72.4% (CI = 70.7%–74.0%) of women overall followed this recommendation, significantly less than the Healthy People 2020 target of 81.1% (4), with whites and blacks more frequently screened than Asians (Table 1). Considerably lower mammography use was reported by those reporting no usual source of health care (36.2%) or no health insurance (38.2%). Immigrant women who had been in the United States for =10 years were almost as likely as U.S.-born women to report having had a mammogram within the past 2 years (70.3% and 73.1%, respectively), whereas only 46.6% of immigrants in the United States for <10 years reported being screened in the past 2 years. Education level also was associated positively with screening. Overall, the proportion of women aged 50–74 years who reported having had a mammogram in the past 2 years remained stable during 2000–2010 (Figure). Cervical Cancer Screening USPSTF recommends that women aged 21–65 years with a cervix be screened for cervical cancer and precancerous lesions by Papanicolau (Pap) smear testing every 3 years (2). Overall, 83.0% (CI = 82.0%–84.0%) of women with no hysterectomy reported having a Pap test within the past 3 years (Table 1), significantly less than the Healthy People 2020 target of 93.0% (4). Rates were significantly lower among Asians (75.4% [CI = 71.1%–79.3%]). Among Asians, Filipinas were more likely to have been screened (86.9% [CI = 80.2%–91.6%]) than other Asians. Those without access to health care were less likely to receive testing; 64.9% of women with no usual source of care and 63.8% of uninsured women were up-to-date. From 2000 to 2010, a small but significant downward trend was observed in the number of women who reported having had a Pap test within the past 3 years. Colorectal Cancer Screening The USPSTF guidelines call for regular screening of both men and women for colorectal cancer, starting at age 50 years and continuing until age 75 years, by any of the following three regimens: 1) annual high-sensitivity fecal occult blood testing, 2) sigmoidoscopy every 5 years combined with high-sensitivity fecal occult blood testing every 3 years, or 3) screening colonoscopy at intervals of 10 years (2). Overall, 58.6% (CI = 57.3%–59.9%) of adults reported being up-to-date with colorectal cancer screening (Table 2). This is significantly lower than the Healthy People 2020 target of 70.5%. Nearly identical proportions of men (58.5%) and women (58.8%) reported being up-to-date. Whites were significantly more likely to report being up-to-date than blacks or Asians. Hispanics were less likely to report being up-to-date (46.5% [CI = 42.9%–50.2%]) than non-Hispanics. Among respondents who 1) had been in the United States for <10 years; 2) did not have a usual, nonemergency department source of care; or 3) did not have health insurance, less than a quarter reported having been screened within the recommended interval. Respondents aged 65–75 years were more likely to be up-to-date than those aged 50–64 years. Significant upward trends were seen in the proportion of adults up-to-date with colorectal cancer screening from 2000 to 2010 using any colorectal cancer screening regimen (Figure). Reported byCarrie N. Klabunde, PhD, Martin Brown, PhD, Rachel Ballard-Barbash, MD, National Cancer Institute. Mary C. White, ScD, Trevor Thompson, Marcus Plescia, MD, Div of Cancer Prevention and Control, National Center for Chronic Disease Prevention and Health Promotion; Sallyann Coleman King, MD, EIS Officer, CDC. Corresponding contributor: Sallyann Coleman King, scolemanking@cdc.gov, 770-488-5892. Editorial NoteMeasuring use of recommended cancer screening regimens and changes in use over time is important to identify groups that might not be receiving the full benefits of screening. The population-based estimates in this report show a slight downward trend in the proportion of women up-to-date with screening for cervical cancer but no change over time in breast cancer screening rates. Screening rates for colorectal cancer increased markedly for men and women, with the rate for women increasing slightly faster, so that rates among men and women were the same in 2010. Breast cancer and colorectal cancer screening rates for persons living in the United States <10 years have declined since 2008 (5,6), and many of those known to face health disparities, such as those without a source of health care and those who are uninsured, continue to be screened less often than recommended. The proportions of women being screened for breast cancer (72.4%) and cervical cancers (83.0%) are below the respective Healthy People 2020 targets of 81.1% and 93.0%. Screening for colorectal cancer has increased over time, reaching 58.6%, according to the 2010 NHIS data, and 65.4%, according to 2010 Behavioral Risk Factor Surveillance Survey (BRFSS) data (7). Both estimates are considerably lower than the Healthy People 2020 target of 70.5% (4). Differences between BRFSS and NHIS estimates of cancer screening rates are likely the result of differences in the methods used for the surveys (8). Financial barriers to screening might explain some of the observed disparities in cancer screening rates. The National Breast and Cervical Cancer Early Detection Program provides free or low-cost screening and diagnostic breast and cervical cancer services to low-income, underinsured, and uninsured women, and access to state Medicaid programs for treatment if breast or cervical cancer are diagnosed.* The Affordable Care Act is expected to reduce financial barriers to screening by expanding insurance coverage. Breast, cervical, and colorectal cancer screening are now covered free in Medicare and in newly offered private insurance plans. State Medicaid programs that provide these services free will receive an enhanced federal match rate. Other efforts are needed, such as developing systems that identify persons eligible for cancer screening tests, actively encouraging the use of screening tests, and monitoring participation to improve screening rates. Previous studies have shown that racial and ethnic subgroups differ in cancer screening use (9,10). Large variations were seen between some subgroups. Subgroups that were more likely to receive one type of cancer screening were not necessarily more likely to receive all types. This study further illustrates the importance of identifying and tracking differences among racial and ethnic subgroups and provides guidance for future targeted interventions. The age ranges examined in this report correspond to the specifications in Healthy People 2020 objectives, based on current guidelines from USPSTF (2,3), but some persons younger or older than those ages also might benefit from screening. For cervical cancer screening, USPSTF recommends screening women aged >65 years who previously have not been screened or for whom information about previous screening is not available. For adults aged 75–85 years who previously have not been screened for colorectal cancer, USPSTF recommends that screening decisions be made considering the person's health status and competing risks. For mammography screening, USPSTF states that evidence is insufficient to assess the additional benefits and harms of screening in women aged =75 years. The findings in this report are subject to at least four limitations. First, NHIS data are self-reported, and any report of testing for cancer was classified as a screening test; therefore, these data are subject to inaccuracies. Second, screening recommendations have changed over time. Third, before 2005, the NHIS survey allowed incomplete responses to questions about the date of the test, often requiring assumptions to recode screening measures. To facilitate comparisons over time, this analysis imposed the 2000 method, which allows use of data defined consistently across all years. As a result, the description of screening rates might be less accurate, so that the percentages shown for 2010 in the trend analysis differ slightly from those reported in the tables (5). Finally, the 2003 NHIS did not include questions on prior hysterectomy; consequently, 2003 data for Pap smears in the trend analysis were excluded to allow for exclusion of women who had undergone hysterectomy. Although progress toward achieving the Healthy People 2020 objective for colorectal cancer screening is being made, screening for breast cancer and cervical cancer has not increased over the past decade, and screening use remains low for many groups. This study shows the disparity in subgroup screening rates. Monitoring of these groups is important to assess progress toward reaching Healthy People 2020 cancer screening targets. Efforts should be made to improve screening rates in all population groups (including targeted efforts for populations with particularly low levels of cancer screening). References
* Additional information is available at http://www.cdc.gov/cancer/nbccedp. What is already known on this topic? Screening at certain ages detects breast, cervical, and colorectal cancer early and reduces morbidity and mortality. The Healthy People 2020 targets for breast, cervical, and colorectal cancer screening are 81.1%, 93.0%, and 70.5% of the targeted age groups. What is added by this report? Analysis of data from the 2010 National Health Interview Survey shows that the proportion of the U.S. population screened for cancer according to current recommendations remains below target levels. The proportions screened are 72.4% for breast cancer, 83.0% for cervical cancer, and 58.6% for colorectal cancer. Screening rates for breast cancer have changed little in the past 10 years, whereas rates for cervical cancer have decreased slightly, and rates for colorectal cancer have increased. Screening use varies with age group, race, ethnicity, education, access to health care, and length of U.S. residence. What are the implications for public health practice? Efforts should be made to improve screening rates in all population groups (including targeting populations with particularly low levels of cancer screening) to increase population screening levels to meet Healthy People 2020 targets and reduce cancer morbidity and mortality. FIGURE. Percentage of men and women up-to-date on screening for breast, cervical, or colorectal cancer, by type of test, sex, and year — United States, 2000–2010 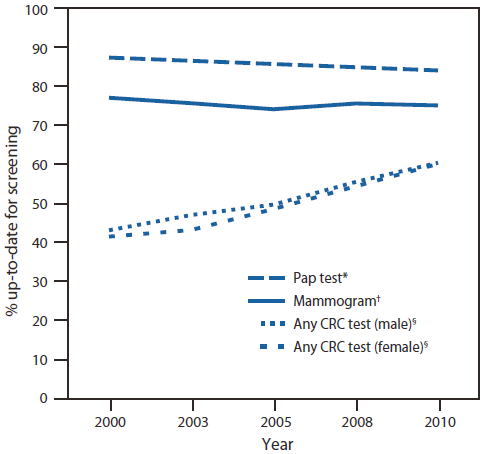
Abbreviations: CRC = colorectal cancer; Pap = Papanicolaou. * Among women aged 21–65 years with no hysterectomy. † Among women aged 50–74 years. § Among persons aged 50–75 years. Alternate Text: The figure above shows the percentage of men and women up-to-date on screening for breast, cervical, or colorectal cancer, by type of test, sex, and year in the United States during 2000-2010. Overall, the proportion of women aged 50-74 years who reported having had a mammogram in the past 2 years remained stable during 2000-2010. A small but significant downward trend was observed in the number of women who reported having had a Pap test within the past 3 years. Significant upward trends were seen in the proportion of adults up-to-date with colorectal cancer screening from 2000 to 2010 using any colorectal cancer screening regimen. Syndicated Content Details:
Source URL: http://www.cdc.gov/mmwr/preview/mmwrhtml/mm6103a1.htm Source Agency: Centers for Disease Control and Prevention (CDC) Captured Date: 2016-05-23 22:05:03.0
|