Persons using assistive technology might not be able to fully access information in this file. For assistance, please send e-mail to: mmwrq@cdc.gov. Type 508 Accommodation and the title of the report in the subject line of e-mail.
Notifiable Diseases and Mortality Tables
Table I Summary of provisional cases of selected notifiable diseases, United States, cumulative, week ending January 21, 2012 (3rd Week)
Figure I Selected notifiable disease reports, United States, comparison of provisional 4-week totals ending January 21, 2012, with historical data
Table II Provisional cases of selected notifiable diseases, United States, weeks ending January 21, 2012 and January 22, 2011 (3rd Week)
Table III Deaths in 122 U.S. cities, week ending January 21, 2012 (3rd Week)
TABLE I. Provisional cases of infrequently reported notifiable diseases (<1,000 cases reported during the preceding year) — United States, week ending January 21, 2012 (3rd week)*
TABLE I. (Continued) Provisional cases of infrequently reported notifiable diseases (<1,000 cases reported during the preceding year) — United States, week ending January 21, 2012 (3rd week)*
—: No reported cases. N: Not reportable. NN: Not Nationally Notifiable. Cum: Cumulative year-to-date counts.
§ Not reportable in all states. Data from states where the condition is not reportable are excluded from this table except starting in 2007 for the arboviral diseases, STD data, TB data, and influenza-associated pediatric mortality, and in 2003 for SARS-CoV. Reporting exceptions are available at http://www.cdc.gov/osels/ph_surveillance/nndss/phs/infdis.htm.
¶ Includes both neuroinvasive and nonneuroinvasive. Updated weekly from reports to the Division of Vector-Borne Infectious Diseases, National Center for Zoonotic, Vector-Borne, and Enteric Diseases (ArboNET Surveillance). Data for West Nile virus are available in Table II.
** Data for H. influenzae (all ages, all serotypes) are available in Table II.
†† Updated weekly from reports to the Influenza Division, National Center for Immunization and Respiratory Diseases. Since October 2, 2011, one influenza-associated pediatric death occurring during the 2011-12 influenza season has been reported.
§§ The one measles case reported for the current week was imported.
¶¶ Data for meningococcal disease (all serogroups) are available in Table II.
*** CDC discontinued reporting of individual confirmed and probable cases of 2009 pandemic influenza A (H1N1) virus infections on July 24, 2009. During 2009, four cases of human infection with novel influenza A viruses, different from the 2009 pandemic influenza A (H1N1) strain, were reported to CDC. The four cases of novel influenza A virus infection reported to CDC during 2010, and the eight cases reported during 2011, were identified as swine influenza A (H3N2) virus and are unrelated to the 2009 pandemic influenza A (H1N1) virus. Total case counts are provided by the Influenza Division, National Center for Immunization and Respiratory Diseases (NCIRD).
††† No rubella cases were reported for the current week.
§§§ Updated weekly from reports to the Division of STD Prevention, National Center for HIV/AIDS, Viral Hepatitis, STD, and TB Prevention.
¶¶¶ There were no cases of viral hemorrhagic fever reported during the current week. See Table II for dengue hemorrhagic fever.
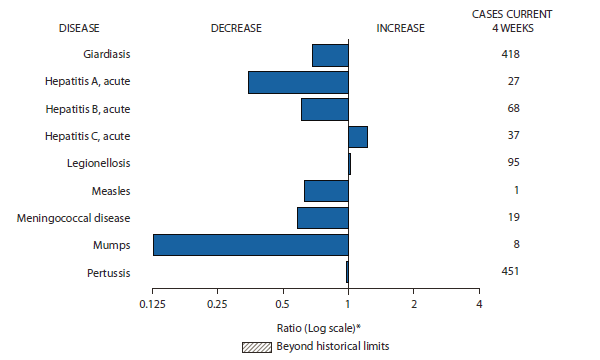
FIGURE I. Selected notifiable disease reports, United States, comparison of provisional 4-week totals January 21, 2012, with historical data
* Ratio of current 4-week total to mean of 15 4-week totals (from previous, comparable, and subsequent 4-week periods for the past 5 years). The point where the hatched area begins is based on the mean and two standard deviations of these 4-week totals.
Alternate Text: The figure above shows selected notifiable disease reports for the United States, with comparison of provisional 4-week totals through January 21, 2012, with historical data. Reports of acute hepatitis C and legionellosis increased. Reports of giardiasis, acute hepatitis A, acute hepatitis B, measles, meningococcal disease, mumps, and pertussis all decreased.
TABLE II. Provisional cases of selected notifiable diseases, United States, weeks ending January 21, 2012, and January 22, 2011 (3rd week)*
Reporting area
Chlamydia trachomatis infection
Coccidioidomycosis
Cryptosporidiosis
Current week
Previous 52 weeks
Cum 2012
Cum 2011
Current week
Previous 52 weeks
Cum 2012
Cum 2011
Current week
Previous 52 weeks
Cum 2012
Cum 2011
Med
Max
Med
Max
Med
Max
United States
11,159
26,719
30,774
42,040
73,417
51
390
586
237
1,370
46
132
396
166
275
New England
438
891
1,594
701
1,809
—
0
1
—
—
1
6
22
3
15
Connecticut
—
240
474
—
39
—
0
0
—
—
—
1
9
—
4
Maine
—
58
99
—
172
—
0
0
—
—
—
1
4
1
3
Massachusetts
359
419
860
482
1,247
—
0
0
—
—
—
2
8
—
7
New Hampshire
—
59
90
—
149
—
0
1
—
—
—
1
5
1
1
Rhode Island
79
79
170
219
117
—
0
0
—
—
—
0
1
—
—
Vermont
—
27
84
—
85
—
0
0
—
—
1
1
5
1
—
Mid. Atlantic
1,700
3,231
3,954
6,794
8,686
—
0
1
—
—
5
14
43
17
30
New Jersey
116
540
1,004
1,100
1,063
—
0
0
—
—
—
0
1
1
—
New York (Upstate)
580
715
1,545
1,231
1,348
—
0
0
—
—
2
4
16
4
4
New York City
134
1,067
1,315
1,831
3,384
—
0
0
—
—
—
1
6
1
5
Pennsylvania
870
996
1,531
2,632
2,891
—
0
1
—
—
3
9
27
11
21
E.N. Central
921
4,095
4,565
5,217
14,231
1
1
5
2
—
11
32
146
44
79
Illinois
25
1,124
1,356
611
3,691
—
0
0
—
—
—
3
26
—
11
Indiana
163
549
715
743
2,409
—
0
0
—
—
—
3
14
—
13
Michigan
487
931
1,229
1,805
3,464
—
0
3
—
—
—
6
14
6
14
Ohio
172
995
1,112
1,349
3,181
1
0
3
2
—
11
11
95
34
28
Wisconsin
74
464
537
709
1,486
—
0
0
—
—
—
8
64
4
13
W.N. Central
112
1,495
1,815
862
4,309
—
0
2
—
—
3
16
87
11
33
Iowa
9
211
327
436
690
—
0
0
—
—
—
6
19
3
10
Kansas
2
209
288
47
518
—
0
0
—
—
—
0
11
—
—
Minnesota
—
313
399
—
1,003
—
0
0
—
—
—
0
0
—
—
Missouri
—
534
759
—
1,537
—
0
0
—
—
3
5
63
5
8
Nebraska
72
126
215
217
228
—
0
2
—
—
—
2
12
2
10
North Dakota
1
44
64
5
96
—
0
0
—
—
—
0
12
—
—
South Dakota
28
63
89
157
237
—
0
0
—
—
—
2
13
1
5
S. Atlantic
3,444
5,401
7,461
12,389
14,877
—
0
2
—
—
8
21
50
43
57
Delaware
81
86
182
177
197
—
0
0
—
—
—
0
1
—
1
District of Columbia
18
110
190
283
315
—
0
0
—
—
—
0
1
—
—
Florida
907
1,507
1,698
3,309
4,260
—
0
0
—
—
8
8
17
23
27
Georgia
709
1,022
1,569
2,219
2,366
—
0
0
—
—
—
5
11
5
8
Maryland
118
469
790
165
1,050
—
0
2
—
—
—
1
7
9
3
North Carolina
915
1,000
1,688
4,011
2,857
—
0
0
—
—
—
0
34
—
—
South Carolina
—
530
1,343
—
1,172
—
0
0
—
—
—
2
6
5
11
Virginia
624
662
1,688
2,055
2,378
—
0
1
—
—
—
2
8
1
7
West Virginia
72
81
120
170
282
—
0
0
—
—
—
0
5
—
—
E.S. Central
342
1,899
2,804
1,625
4,090
—
0
0
—
—
3
7
25
11
9
Alabama
—
536
1,566
—
1,473
—
0
0
—
—
—
2
7
4
5
Kentucky
219
299
557
560
153
—
0
0
—
—
1
2
17
1
3
Mississippi
—
398
696
—
808
—
0
0
—
—
—
1
4
1
—
Tennessee
123
600
751
1,065
1,656
—
0
0
—
—
2
2
6
5
1
W.S. Central
2,248
3,353
4,326
6,460
9,483
—
0
1
—
—
1
8
43
5
7
Arkansas
—
309
440
—
794
—
0
0
—
—
—
0
2
1
—
Louisiana
522
371
1,071
841
1,024
—
0
1
—
—
—
0
9
—
—
Oklahoma
149
130
675
251
582
—
0
0
—
—
1
2
6
1
1
Texas
1,577
2,414
3,124
5,368
7,083
—
0
0
—
—
—
5
39
3
6
Mountain
942
1,775
2,381
2,933
4,232
38
306
459
169
1,023
3
10
30
13
27
Arizona
430
552
782
1,512
1,438
37
303
456
166
1,010
—
1
4
—
2
Colorado
405
420
847
891
790
—
0
0
—
—
—
3
12
—
6
Idaho
—
82
235
—
189
—
0
0
—
—
3
1
9
5
3
Montana
55
66
88
188
196
—
0
2
—
—
—
1
6
3
2
Nevada
39
203
380
84
584
1
2
5
3
8
—
0
2
2
1
New Mexico
—
199
481
—
558
—
1
4
—
3
—
3
9
3
8
Utah
13
133
190
258
366
—
0
4
—
2
—
1
5
—
5
Wyoming
—
34
67
—
111
—
0
2
—
—
—
0
5
—
—
Pacific
1,012
3,984
5,418
5,059
11,700
12
90
145
66
347
11
11
21
19
18
Alaska
62
109
157
276
351
—
0
0
—
—
—
0
3
—
—
California
511
2,992
4,489
3,248
8,993
12
90
145
66
346
10
6
16
17
7
Hawaii
—
114
142
—
312
—
0
0
—
—
—
0
1
—
—
Oregon
223
273
412
747
751
—
0
1
—
1
1
2
8
2
11
Washington
216
441
611
788
1,293
—
0
0
—
—
—
1
6
—
—
Territories
American Samoa
—
0
0
—
—
—
0
0
—
—
N
0
0
N
N
C.N.M.I.
—
—
—
—
—
—
—
—
—
—
—
—
—
—
—
Guam
—
14
44
—
3
—
0
0
—
—
—
0
0
—
—
Puerto Rico
—
102
349
49
392
—
0
0
—
—
N
0
0
N
N
U.S. Virgin Islands
—
16
27
—
37
—
0
0
—
—
—
0
0
—
—
C.N.M.I.: Commonwealth of Northern Mariana Islands.
U: Unavailable. —: No reported cases. N: Not reportable. NN: Not Nationally Notifiable. Cum: Cumulative year-to-date counts. Med: Median. Max: Maximum.
TABLE II. (Continued) Provisional cases of selected notifiable diseases, United States, weeks ending January 21, 2012, and January 22, 2011 (3rd week)*
Reporting area
Dengue Virus Infection
Dengue Fever†
Dengue Hemorrhagic Fever§
Current week
Previous 52 weeks
Cum 2012
Cum 2011
Current week
Previous 52 weeks
Cum 2012
Cum 2011
Med
Max
Med
Max
United States
—
3
16
—
13
—
0
1
—
—
New England
—
0
1
—
—
—
0
0
—
—
Connecticut
—
0
0
—
—
—
0
0
—
—
Maine
—
0
0
—
—
—
0
0
—
—
Massachusetts
—
0
0
—
—
—
0
0
—
—
New Hampshire
—
0
0
—
—
—
0
0
—
—
Rhode Island
—
0
0
—
—
—
0
0
—
—
Vermont
—
0
1
—
—
—
0
0
—
—
Mid. Atlantic
—
1
6
—
3
—
0
0
—
—
New Jersey
—
0
0
—
—
—
0
0
—
—
New York (Upstate)
—
0
0
—
—
—
0
0
—
—
New York City
—
0
4
—
2
—
0
0
—
—
Pennsylvania
—
0
2
—
1
—
0
0
—
—
E.N. Central
—
0
2
—
3
—
0
1
—
—
Illinois
—
0
1
—
—
—
0
1
—
—
Indiana
—
0
1
—
1
—
0
0
—
—
Michigan
—
0
1
—
—
—
0
0
—
—
Ohio
—
0
1
—
—
—
0
0
—
—
Wisconsin
—
0
2
—
2
—
0
0
—
—
W.N. Central
—
0
2
—
—
—
0
0
—
—
Iowa
—
0
1
—
—
—
0
0
—
—
Kansas
—
0
1
—
—
—
0
0
—
—
Minnesota
—
0
1
—
—
—
0
0
—
—
Missouri
—
0
1
—
—
—
0
0
—
—
Nebraska
—
0
0
—
—
—
0
0
—
—
North Dakota
—
0
1
—
—
—
0
0
—
—
South Dakota
—
0
0
—
—
—
0
0
—
—
S. Atlantic
—
1
8
—
4
—
0
1
—
—
Delaware
—
0
2
—
—
—
0
0
—
—
District of Columbia
—
0
0
—
—
—
0
0
—
—
Florida
—
1
7
—
3
—
0
0
—
—
Georgia
—
0
1
—
—
—
0
0
—
—
Maryland
—
0
2
—
—
—
0
0
—
—
North Carolina
—
0
1
—
—
—
0
0
—
—
South Carolina
—
0
1
—
—
—
0
0
—
—
Virginia
—
0
1
—
1
—
0
1
—
—
West Virginia
—
0
0
—
—
—
0
0
—
—
E.S. Central
—
0
3
—
—
—
0
0
—
—
Alabama
—
0
1
—
—
—
0
0
—
—
Kentucky
—
0
1
—
—
—
0
0
—
—
Mississippi
—
0
0
—
—
—
0
0
—
—
Tennessee
—
0
2
—
—
—
0
0
—
—
W.S. Central
—
0
2
—
—
—
0
0
—
—
Arkansas
—
0
0
—
—
—
0
0
—
—
Louisiana
—
0
1
—
—
—
0
0
—
—
Oklahoma
—
0
0
—
—
—
0
0
—
—
Texas
—
0
1
—
—
—
0
0
—
—
Mountain
—
0
1
—
1
—
0
0
—
—
Arizona
—
0
1
—
1
—
0
0
—
—
Colorado
—
0
0
—
—
—
0
0
—
—
Idaho
—
0
0
—
—
—
0
0
—
—
Montana
—
0
0
—
—
—
0
0
—
—
Nevada
—
0
1
—
—
—
0
0
—
—
New Mexico
—
0
1
—
—
—
0
0
—
—
Utah
—
0
1
—
—
—
0
0
—
—
Wyoming
—
0
0
—
—
—
0
0
—
—
Pacific
—
0
4
—
2
—
0
0
—
—
Alaska
—
0
0
—
—
—
0
0
—
—
California
—
0
2
—
1
—
0
0
—
—
Hawaii
—
0
4
—
—
—
0
0
—
—
Oregon
—
0
0
—
—
—
0
0
—
—
Washington
—
0
1
—
1
—
0
0
—
—
Territories
American Samoa
—
0
0
—
—
—
0
0
—
—
C.N.M.I.
—
—
—
—
—
—
—
—
—
—
Guam
—
0
0
—
—
—
0
0
—
—
Puerto Rico
—
18
83
—
79
—
0
3
—
1
U.S. Virgin Islands
—
0
0
—
—
—
0
0
—
—
C.N.M.I.: Commonwealth of Northern Mariana Islands.
U: Unavailable. —: No reported cases. N: Not reportable. NN: Not Nationally Notifiable. Cum: Cumulative year-to-date counts. Med: Median. Max: Maximum.
† Dengue Fever includes cases that meet criteria for Dengue Fever with hemorrhage, other clinical and unknown case classifications.
§ DHF includes cases that meet criteria for dengue shock syndrome (DSS), a more severe form of DHF.
TABLE II. (Continued) Provisional cases of selected notifiable diseases, United States, weeks ending January 21, 2012, and January 22, 2011 (3rd week)*
Reporting area
Ehrlichiosis/Anaplasmosis†
Ehrlichia chaffeensis
Anaplasma phagocytophilum
Undetermined
Current week
Previous 52 weeks
Cum 2012
Cum 2011
Current week
Previous 52 weeks
Cum 2012
Cum 2011
Current week
Previous 52 weeks
Cum 2012
Cum 2011
Med
Max
Med
Max
Med
Max
United States
—
8
93
2
4
2
16
57
3
6
2
2
9
2
1
New England
—
0
1
—
—
—
3
28
1
3
—
0
1
—
—
Connecticut
—
0
0
—
—
—
0
0
—
—
—
0
0
—
—
Maine
—
0
1
—
—
—
0
3
1
1
—
0
0
—
—
Massachusetts
—
0
0
—
—
—
1
18
—
—
—
0
0
—
—
New Hampshire
—
0
1
—
—
—
0
4
—
—
—
0
1
—
—
Rhode Island
—
0
1
—
—
—
0
15
—
2
—
0
1
—
—
Vermont
—
0
0
—
—
—
0
1
—
—
—
0
0
—
—
Mid. Atlantic
—
1
5
—
—
1
6
32
1
2
—
0
2
—
—
New Jersey
—
0
0
—
—
—
0
0
—
—
—
0
0
—
—
New York (Upstate)
—
0
4
—
—
1
3
32
1
1
—
0
2
—
—
New York City
—
0
2
—
—
—
0
5
—
1
—
0
0
—
—
Pennsylvania
—
0
0
—
—
—
0
1
—
—
—
0
0
—
—
E.N. Central
—
0
5
—
—
—
0
2
—
—
—
0
6
—
1
Illinois
—
0
4
—
—
—
0
2
—
—
—
0
1
—
—
Indiana
—
0
0
—
—
—
0
0
—
—
—
0
4
—
1
Michigan
—
0
2
—
—
—
0
0
—
—
—
0
2
—
—
Ohio
—
0
1
—
—
—
0
1
—
—
—
0
1
—
—
Wisconsin
—
0
0
—
—
—
0
1
—
—
—
0
1
—
—
W.N. Central
—
1
19
1
—
—
0
8
—
—
—
0
7
—
—
Iowa
N
0
0
N
N
N
0
0
N
N
N
0
0
N
N
Kansas
—
0
2
—
—
—
0
1
—
—
—
0
1
—
—
Minnesota
—
0
0
—
—
—
0
1
—
—
—
0
0
—
—
Missouri
—
1
19
1
—
—
0
7
—
—
—
0
7
—
—
Nebraska
—
0
1
—
—
—
0
1
—
—
—
0
0
—
—
North Dakota
N
0
0
N
N
N
0
0
N
N
N
0
0
N
N
South Dakota
—
0
1
—
—
—
0
1
—
—
—
0
0
—
—
S. Atlantic
—
3
33
1
4
1
1
8
1
1
2
0
2
2
—
Delaware
—
0
2
—
—
—
0
1
—
—
—
0
0
—
—
District of Columbia
N
0
0
N
N
N
0
0
N
N
N
0
0
N
N
Florida
—
0
3
—
1
—
0
3
—
—
—
0
0
—
—
Georgia
—
0
3
1
1
1
0
2
1
—
1
0
1
1
—
Maryland
—
0
3
—
1
—
0
2
—
—
1
0
1
1
—
North Carolina
—
0
17
—
1
—
0
6
—
1
—
0
0
—
—
South Carolina
—
0
1
—
—
—
0
0
—
—
—
0
1
—
—
Virginia
—
1
13
—
—
—
0
3
—
—
—
0
1
—
—
West Virginia
—
0
1
—
—
—
0
0
—
—
—
0
1
—
—
E.S. Central
—
1
8
—
—
—
0
2
—
—
—
0
3
—
—
Alabama
—
0
2
—
—
—
0
1
—
—
N
0
0
N
N
Kentucky
—
0
3
—
—
—
0
0
—
—
—
0
0
—
—
Mississippi
—
0
1
—
—
—
0
1
—
—
—
0
0
—
—
Tennessee
—
0
5
—
—
—
0
2
—
—
—
0
3
—
—
W.S. Central
—
0
30
—
—
—
0
3
—
—
—
0
0
—
—
Arkansas
—
0
13
—
—
—
0
3
—
—
—
0
0
—
—
Louisiana
—
0
0
—
—
—
0
0
—
—
—
0
0
—
—
Oklahoma
—
0
25
—
—
—
0
1
—
—
—
0
0
—
—
Texas
—
0
1
—
—
—
0
1
—
—
—
0
0
—
—
Mountain
—
0
0
—
—
—
0
0
—
—
—
0
1
—
—
Arizona
—
0
0
—
—
—
0
0
—
—
—
0
1
—
—
Colorado
N
0
0
N
N
N
0
0
N
N
N
0
0
N
N
Idaho
N
0
0
N
N
N
0
0
N
N
N
0
0
N
N
Montana
N
0
0
N
N
N
0
0
N
N
N
0
0
N
N
Nevada
N
0
0
N
N
N
0
0
N
N
N
0
0
N
N
New Mexico
N
0
0
N
N
N
0
0
N
N
N
0
0
N
N
Utah
—
0
0
—
—
—
0
0
—
—
—
0
1
—
—
Wyoming
—
0
0
—
—
—
0
0
—
—
—
0
0
—
—
Pacific
—
0
0
—
—
—
0
1
—
—
—
0
2
—
—
Alaska
N
0
0
N
N
N
0
0
N
N
N
0
0
N
N
California
—
0
0
—
—
—
0
0
—
—
—
0
2
—
—
Hawaii
N
0
0
N
N
N
0
0
N
N
N
0
0
N
N
Oregon
—
0
0
—
—
—
0
1
—
—
—
0
0
—
—
Washington
—
0
0
—
—
—
0
0
—
—
—
0
0
—
—
Territories
American Samoa
N
0
0
N
N
N
0
0
N
N
N
0
0
N
N
C.N.M.I.
—
—
—
—
—
—
—
—
—
—
—
—
—
—
—
Guam
N
0
0
N
N
N
0
0
N
N
N
0
0
N
N
Puerto Rico
N
0
0
N
N
N
0
0
N
N
N
0
0
N
N
U.S. Virgin Islands
—
0
0
—
—
—
0
0
—
—
—
0
0
—
—
C.N.M.I.: Commonwealth of Northern Mariana Islands.
U: Unavailable. —: No reported cases. N: Not reportable. NN: Not Nationally Notifiable. Cum: Cumulative year-to-date counts. Med: Median. Max: Maximum.
† Cumulative total E. ewingii cases reported for year 2011 = 13 and 0 case reports for 2012.
TABLE II. (Continued) Provisional cases of selected notifiable diseases, United States, weeks ending January 21, 2012, and January 22, 2011 (3rd week)*
Reporting area
Giardiasis
Gonorrhea
Haemophilus influenzae, invasive† All ages, all serotypes
Current week
Previous 52 weeks
Cum 2012
Cum 2011
Current week
Previous 52 weeks
Cum 2012
Cum 2011
Current week
Previous 52 weeks
Cum 2012
Cum 2011
Med
Max
Med
Max
Med
Max
United States
111
282
441
355
700
2,693
5,973
6,719
10,749
17,756
31
64
87
141
235
New England
1
27
64
6
63
45
108
178
91
198
—
4
9
4
18
Connecticut
—
4
10
—
13
—
45
101
—
49
—
1
4
1
5
Maine
—
3
10
3
4
—
5
18
—
7
—
0
2
2
3
Massachusetts
—
12
29
—
36
41
47
80
61
133
—
2
4
—
8
New Hampshire
1
2
8
1
5
—
2
7
—
5
—
0
2
1
1
Rhode Island
—
0
10
—
1
4
7
35
30
2
—
0
1
—
—
Vermont
—
3
19
2
4
—
0
6
—
2
—
0
2
—
1
Mid. Atlantic
16
54
91
52
120
405
744
916
1,690
2,014
11
15
25
49
43
New Jersey
—
0
0
—
—
23
151
232
296
366
—
2
6
—
8
New York (Upstate)
12
22
51
22
25
94
115
288
220
207
5
3
12
8
3
New York City
3
16
29
14
50
39
241
315
426
719
2
3
10
12
5
Pennsylvania
1
16
30
16
45
249
258
416
748
722
4
5
13
29
27
E.N. Central
21
47
84
71
147
244
1,055
1,263
1,490
3,996
5
11
22
20
44
Illinois
—
10
19
1
29
11
288
383
182
965
—
3
11
1
10
Indiana
—
6
13
2
15
50
133
169
203
704
—
2
6
1
5
Michigan
3
10
21
16
30
124
237
371
544
1,020
—
1
4
2
5
Ohio
18
15
31
41
44
48
310
398
387
1,019
5
4
7
15
15
Wisconsin
—
8
19
11
29
11
88
118
174
288
—
1
4
1
9
W.N. Central
11
20
52
44
56
14
311
378
175
862
1
2
10
3
6
Iowa
3
4
15
15
13
1
37
79
104
120
—
0
1
—
—
Kansas
—
2
9
—
5
—
42
65
13
101
—
0
2
—
—
Minnesota
—
0
0
—
—
—
44
61
—
119
—
0
0
—
—
Missouri
6
8
23
18
20
—
150
204
—
416
1
1
5
1
4
Nebraska
2
3
11
10
11
13
27
52
51
57
—
0
2
2
2
North Dakota
—
0
12
—
—
—
4
9
—
14
—
0
6
—
—
South Dakota
—
1
8
1
7
—
11
20
7
35
—
0
1
—
—
S. Atlantic
26
50
103
78
122
965
1,490
1,947
3,548
4,186
6
14
31
36
53
Delaware
—
0
3
—
—
15
15
35
38
48
—
0
2
—
—
District of Columbia
—
1
5
—
1
8
38
105
131
126
—
0
1
—
—
Florida
19
23
69
46
82
220
376
472
905
1,183
—
5
12
11
20
Georgia
—
10
51
10
12
221
312
461
683
765
1
2
6
5
13
Maryland
7
6
13
13
8
53
117
176
84
283
2
2
5
8
3
North Carolina
N
0
0
N
N
274
334
548
1,208
975
3
1
7
4
3
South Carolina
—
2
8
5
6
—
162
420
—
360
—
1
5
4
3
Virginia
—
5
12
4
13
160
121
352
471
387
—
2
8
2
11
West Virginia
—
0
8
—
—
14
14
29
28
59
—
0
5
2
—
E.S. Central
1
3
9
5
5
78
515
789
410
1,204
4
3
12
10
19
Alabama
1
3
9
5
5
—
165
408
—
479
—
1
3
—
7
Kentucky
N
0
0
N
N
61
76
151
163
39
1
1
4
4
3
Mississippi
N
0
0
N
N
—
103
191
—
249
—
0
3
—
2
Tennessee
N
0
0
N
N
17
145
222
247
437
3
2
8
6
7
W.S. Central
2
5
15
2
13
625
878
1,176
1,779
2,628
3
2
10
6
9
Arkansas
2
2
8
2
3
—
85
138
—
254
—
0
3
1
1
Louisiana
—
2
10
—
10
184
120
255
231
290
—
0
4
—
4
Oklahoma
—
0
0
—
—
40
33
196
60
212
3
1
9
5
4
Texas
N
0
0
N
N
401
590
834
1,488
1,872
—
0
1
—
—
Mountain
2
25
45
20
66
131
202
322
414
617
—
5
10
7
26
Arizona
—
2
6
1
6
84
84
130
299
202
—
1
6
3
10
Colorado
—
11
25
10
22
43
39
89
95
158
—
1
5
—
7
Idaho
1
3
9
3
11
—
3
13
—
9
—
0
2
—
2
Montana
1
2
5
2
2
—
1
4
2
6
—
0
1
—
1
Nevada
—
1
7
3
4
3
38
103
12
125
—
0
2
2
1
New Mexico
—
1
6
—
7
—
34
73
—
102
—
1
3
2
5
Utah
—
3
9
1
13
1
5
10
6
12
—
0
3
—
—
Wyoming
—
0
5
—
1
—
0
3
—
3
—
0
1
—
—
Pacific
31
47
124
77
108
186
631
755
1,152
2,051
1
3
9
6
17
Alaska
—
2
7
4
4
8
20
31
40
55
—
0
3
—
2
California
29
32
51
62
75
146
516
608
954
1,721
1
1
5
2
3
Hawaii
—
0
3
—
—
—
12
24
—
39
—
0
3
1
3
Oregon
2
7
20
10
26
12
27
60
52
86
—
1
6
3
9
Washington
—
6
95
1
3
20
50
79
106
150
—
0
1
—
—
Territories
American Samoa
—
0
0
—
—
—
0
0
—
—
—
0
0
—
—
C.N.M.I.
—
—
—
—
—
—
—
—
—
—
—
—
—
—
—
Guam
—
0
0
—
—
—
0
5
—
—
—
0
0
—
—
Puerto Rico
—
0
4
—
3
—
6
14
2
15
—
0
0
—
—
U.S. Virgin Islands
—
0
0
—
—
—
2
10
—
9
—
0
0
—
—
C.N.M.I.: Commonwealth of Northern Mariana Islands.
U: Unavailable. —: No reported cases. N: Not reportable. NN: Not Nationally Notifiable. Cum: Cumulative year-to-date counts. Med: Median. Max: Maximum.
† Data for H. influenzae (age <5 yrs for serotype b, nonserotype b, and unknown serotype) are available in Table I.
TABLE II. (Continued) Provisional cases of selected notifiable diseases, United States, weeks ending January 21, 2012, and January 22, 2011 (3rd week)*
Reporting area
Hepatitis (viral, acute), by type
A
B
C
Current week
Previous 52 weeks
Cum 2012
Cum 2011
Current week
Previous 52 weeks
Cum 2012
Cum 2011
Current week
Previous 52 weeks
Cum 2012
Cum 2011
Med
Max
Med
Max
Med
Max
United States
4
21
39
22
60
30
47
95
74
125
8
19
36
32
49
New England
—
1
5
—
4
—
1
8
—
6
—
1
5
—
1
Connecticut
—
0
3
—
2
—
0
4
—
—
—
0
5
—
1
Maine
—
0
2
—
—
—
0
2
—
—
—
0
3
—
—
Massachusetts
—
0
3
—
1
—
1
6
—
5
—
0
2
—
—
New Hampshire
—
0
0
—
—
—
0
1
—
1
N
0
0
N
N
Rhode Island
—
0
1
—
—
U
0
0
U
U
U
0
0
U
U
Vermont
—
0
2
—
1
—
0
0
—
—
—
0
1
—
—
Mid. Atlantic
—
3
7
1
11
1
5
8
3
12
1
1
5
2
4
New Jersey
—
0
0
—
—
—
0
1
—
—
—
0
1
—
—
New York (Upstate)
—
1
4
—
1
—
1
4
—
3
—
1
4
—
4
New York City
—
1
5
—
7
—
1
5
1
3
—
0
1
—
—
Pennsylvania
—
1
4
1
3
1
2
4
2
6
1
1
3
2
—
E.N. Central
—
4
8
3
12
3
6
37
8
20
—
2
8
1
14
Illinois
—
1
4
—
3
—
1
6
—
6
—
0
2
—
1
Indiana
—
0
3
—
1
—
1
4
2
1
—
0
5
—
9
Michigan
—
1
6
3
4
—
1
6
1
8
—
1
4
1
3
Ohio
—
1
3
—
3
3
1
30
5
3
—
0
1
—
—
Wisconsin
—
0
1
—
1
—
0
3
—
2
—
0
1
—
1
W.N. Central
—
1
7
1
1
—
2
9
2
11
—
0
4
—
—
Iowa
—
0
1
—
1
—
0
1
—
—
—
0
0
—
—
Kansas
—
0
1
—
—
—
0
2
—
2
—
0
1
—
—
Minnesota
—
0
7
—
—
—
0
7
—
—
—
0
2
—
—
Missouri
—
0
1
1
—
—
1
5
1
5
—
0
0
—
—
Nebraska
—
0
1
—
—
—
0
2
1
3
—
0
1
—
—
North Dakota
—
0
0
—
—
—
0
0
—
—
—
0
0
—
—
South Dakota
—
0
2
—
—
—
0
0
—
1
—
0
0
—
—
S. Atlantic
3
4
11
3
12
13
12
57
25
30
5
5
13
12
12
Delaware
—
0
1
—
1
—
0
2
—
—
U
0
0
U
U
District of Columbia
—
0
0
—
—
—
0
0
—
—
—
0
0
—
—
Florida
2
1
8
2
3
4
4
7
9
12
1
1
3
2
5
Georgia
—
1
5
—
3
3
2
7
4
4
—
1
3
—
3
Maryland
—
0
4
—
2
2
1
4
4
2
—
0
3
1
2
North Carolina
—
0
3
—
—
2
2
9
3
5
—
1
7
3
2
South Carolina
—
0
2
—
1
—
1
3
—
3
—
0
1
—
—
Virginia
—
0
3
—
2
2
1
4
5
4
—
0
3
—
—
West Virginia
1
0
2
1
—
—
0
43
—
—
4
0
7
6
—
E.S. Central
—
1
6
1
1
8
10
15
24
18
1
5
10
12
5
Alabama
—
0
2
—
—
—
2
6
3
3
—
0
3
1
—
Kentucky
—
0
2
—
1
3
3
7
8
7
1
2
8
7
2
Mississippi
—
0
1
—
—
—
1
4
2
—
U
0
0
U
U
Tennessee
—
0
5
1
—
5
4
8
11
8
—
1
5
4
3
W.S. Central
1
3
7
4
3
2
6
15
5
7
—
1
5
2
7
Arkansas
—
0
2
—
—
—
1
4
—
—
—
0
0
—
—
Louisiana
—
0
2
—
1
—
0
4
—
3
—
0
1
—
4
Oklahoma
—
0
2
—
—
—
1
9
—
1
—
1
4
—
1
Texas
1
2
7
4
2
2
3
8
5
3
—
0
3
2
2
Mountain
—
1
5
4
7
3
1
4
5
10
—
1
5
2
3
Arizona
—
0
2
1
2
—
0
3
1
1
U
0
0
U
U
Colorado
—
0
2
2
3
—
0
2
—
2
—
0
2
—
1
Idaho
—
0
1
—
—
—
0
1
—
1
—
0
2
—
2
Montana
—
0
1
—
1
—
0
0
—
—
—
0
1
—
—
Nevada
—
0
3
1
—
3
0
2
4
5
—
0
2
2
—
New Mexico
—
0
1
—
1
—
0
2
—
—
—
0
2
—
—
Utah
—
0
1
—
—
—
0
1
—
1
—
0
2
—
—
Wyoming
—
0
1
—
—
—
0
0
—
—
—
0
1
—
—
Pacific
—
3
11
5
9
—
3
8
2
11
1
2
8
1
3
Alaska
—
0
1
—
—
—
0
1
—
—
U
0
0
U
U
California
—
3
7
5
8
—
2
7
—
10
1
1
4
1
1
Hawaii
—
0
2
—
—
—
0
1
1
—
U
0
0
U
U
Oregon
—
0
2
—
1
—
0
4
1
1
—
0
2
—
1
Washington
—
0
4
—
—
—
0
3
—
—
—
0
4
—
1
Territories
American Samoa
—
0
0
—
—
—
0
0
—
—
—
0
0
—
—
C.N.M.I.
—
—
—
—
—
—
—
—
—
—
—
—
—
—
—
Guam
—
0
5
—
—
—
2
8
—
—
—
0
3
—
1
Puerto Rico
—
0
1
—
—
—
0
2
—
—
N
0
0
N
N
U.S. Virgin Islands
—
0
0
—
—
—
0
0
—
—
—
0
0
—
—
C.N.M.I.: Commonwealth of Northern Mariana Islands.
U: Unavailable. —: No reported cases. N: Not reportable. NN: Not Nationally Notifiable. Cum: Cumulative year-to-date counts. Med: Median. Max: Maximum.
TABLE II. (Continued) Provisional cases of selected notifiable diseases, United States, weeks ending January 21, 2012, and January 22, 2011 (3rd week)*
Reporting area
Legionellosis
Lyme disease
Malaria
Current week
Previous 52 weeks
Cum 2012
Cum 2011
Current week
Previous 52 weeks
Cum 2012
Cum 2011
Current week
Previous 52 weeks
Cum 2012
Cum 2011
Med
Max
Med
Max
Med
Max
United States
16
66
165
79
100
113
378
1,566
517
495
14
24
48
38
77
New England
—
4
40
—
7
1
81
503
19
162
—
1
7
—
6
Connecticut
—
1
11
—
1
—
36
234
—
79
—
0
2
—
1
Maine
—
0
3
—
—
—
13
67
8
6
—
0
2
—
—
Massachusetts
—
3
24
—
5
—
18
106
—
48
—
1
6
—
4
New Hampshire
—
0
3
—
—
—
10
90
3
21
—
0
1
—
—
Rhode Island
—
0
9
—
—
—
1
31
—
1
—
0
2
—
—
Vermont
—
0
2
—
1
1
6
70
8
7
—
0
1
—
1
Mid. Atlantic
3
16
76
16
24
87
186
751
418
206
2
6
13
4
20
New Jersey
—
0
0
—
—
58
1
145
295
—
—
0
0
—
—
New York (Upstate)
1
6
27
8
5
9
56
212
13
10
1
1
4
1
2
New York City
—
3
14
2
10
—
1
14
—
4
—
4
11
2
15
Pennsylvania
2
5
41
6
9
20
108
526
110
192
1
1
5
1
3
E.N. Central
3
12
51
21
22
1
16
240
8
40
1
3
10
3
11
Illinois
—
2
11
—
2
—
1
18
—
2
—
1
5
—
5
Indiana
—
2
7
2
4
—
1
12
—
—
—
0
2
—
1
Michigan
—
2
15
—
6
—
1
12
4
—
—
0
4
1
—
Ohio
3
7
34
19
10
1
1
6
4
1
1
1
4
2
4
Wisconsin
—
0
1
—
—
—
14
201
—
37
—
0
2
—
1
W.N. Central
1
1
8
2
1
—
1
16
1
1
—
1
5
2
1
Iowa
—
0
2
—
—
—
0
13
1
—
—
0
3
1
—
Kansas
—
0
2
—
—
—
0
2
—
—
—
0
2
—
—
Minnesota
—
0
0
—
—
—
0
0
—
—
—
0
0
—
—
Missouri
1
1
5
2
1
—
0
2
—
1
—
0
2
1
1
Nebraska
—
0
2
—
—
—
0
2
—
—
—
0
1
—
—
North Dakota
—
0
1
—
—
—
0
9
—
—
—
0
0
—
—
South Dakota
—
0
1
—
—
—
0
2
—
—
—
0
1
—
—
S. Atlantic
7
10
29
25
13
17
59
178
57
85
7
8
24
22
27
Delaware
1
0
4
2
—
2
12
48
10
32
—
0
3
—
—
District of Columbia
—
0
3
—
—
—
0
3
1
2
—
0
1
—
1
Florida
6
4
13
13
6
4
3
8
8
1
6
2
6
11
6
Georgia
—
1
4
3
1
1
0
5
3
—
—
1
6
3
5
Maryland
—
1
14
2
3
3
20
114
19
26
1
2
14
5
7
North Carolina
—
1
7
2
1
—
0
12
—
2
—
0
6
—
3
South Carolina
—
0
5
1
—
—
0
6
—
—
—
0
1
—
—
Virginia
—
1
7
2
2
3
15
75
10
22
—
1
8
3
5
West Virginia
—
0
5
—
—
4
0
13
6
—
—
0
1
—
—
E.S. Central
—
2
11
2
3
—
1
5
1
—
—
1
4
—
—
Alabama
—
0
2
—
1
—
0
2
—
—
—
0
3
—
—
Kentucky
—
1
4
—
1
—
0
1
—
—
—
0
2
—
—
Mississippi
—
0
3
—
—
—
0
1
—
—
—
0
1
—
—
Tennessee
—
1
8
2
1
—
1
4
1
—
—
0
3
—
—
W.S. Central
1
3
8
2
4
—
1
3
—
—
—
1
4
—
1
Arkansas
—
0
2
—
—
—
0
0
—
—
—
0
1
—
—
Louisiana
—
0
3
—
1
—
0
1
—
—
—
0
1
—
—
Oklahoma
—
0
3
—
—
—
0
0
—
—
—
0
1
—
—
Texas
1
2
7
2
3
—
1
3
—
—
—
0
4
—
1
Mountain
—
2
9
1
3
—
0
5
2
1
—
1
5
—
5
Arizona
—
1
4
—
1
—
0
4
1
—
—
0
4
—
1
Colorado
—
0
4
—
1
—
0
1
—
—
—
0
3
—
1
Idaho
—
0
1
1
—
—
0
2
1
—
—
0
1
—
—
Montana
—
0
1
—
—
—
0
3
—
—
—
0
1
—
—
Nevada
—
0
2
—
1
—
0
1
—
—
—
0
2
—
2
New Mexico
—
0
2
—
—
—
0
2
—
1
—
0
1
—
1
Utah
—
0
2
—
—
—
0
1
—
—
—
0
1
—
—
Wyoming
—
0
2
—
—
—
0
1
—
—
—
0
0
—
—
Pacific
1
5
12
10
23
7
2
8
11
—
4
3
11
7
6
Alaska
—
0
0
—
—
—
0
3
—
—
1
0
2
1
—
California
1
4
11
8
22
7
1
5
11
—
3
2
7
5
5
Hawaii
—
0
2
—
—
N
0
0
N
N
—
0
1
—
—
Oregon
—
0
3
2
1
—
0
2
—
—
—
0
4
1
1
Washington
—
0
3
—
—
—
0
6
—
—
—
0
2
—
—
Territories
American Samoa
N
0
0
N
N
N
0
0
N
N
—
0
1
—
—
C.N.M.I.
—
—
—
—
—
—
—
—
—
—
—
—
—
—
—
Guam
—
0
0
—
—
—
0
0
—
—
—
0
0
—
—
Puerto Rico
—
0
0
—
—
N
0
0
N
N
—
0
0
—
—
U.S. Virgin Islands
—
0
0
—
—
—
0
0
—
—
—
0
0
—
—
C.N.M.I.: Commonwealth of Northern Mariana Islands.
U: Unavailable. —: No reported cases. N: Not reportable. NN: Not Nationally Notifiable. Cum: Cumulative year-to-date counts. Med: Median. Max: Maximum.
TABLE II. (Continued) Provisional cases of selected notifiable diseases, United States, weeks ending January 21, 2012, and January 22, 2011 (3rd week)*
Reporting area
Meningococcal disease, invasive† All serogroups
Mumps
Pertussis
Current week
Previous 52 weeks
Cum 2012
Cum 2011
Current week
Previous 52 weeks
Cum 2012
Cum 2011
Current week
Previous 52 weeks
Cum 2012
Cum 2011
Med
Max
Med
Max
Med
Max
United States
6
12
30
17
44
4
7
19
8
17
126
310
511
383
1,042
New England
—
0
3
—
2
—
0
2
—
1
3
14
32
20
26
Connecticut
—
0
1
—
1
—
0
0
—
—
—
1
5
—
6
Maine
—
0
1
—
—
—
0
2
—
—
2
3
19
6
2
Massachusetts
—
0
2
—
1
—
0
1
—
1
—
4
10
—
14
New Hampshire
—
0
1
—
—
—
0
0
—
—
1
2
13
2
2
Rhode Island
—
0
1
—
—
—
0
2
—
—
—
0
4
1
2
Vermont
—
0
3
—
—
—
0
1
—
—
—
0
16
11
—
Mid. Atlantic
—
1
4
1
7
—
1
7
—
2
51
35
130
117
75
New Jersey
—
0
0
—
—
—
0
2
—
2
—
4
10
—
9
New York (Upstate)
—
0
4
—
—
—
0
3
—
—
38
12
110
64
24
New York City
—
0
2
—
5
—
0
6
—
—
—
2
42
2
—
Pennsylvania
—
0
2
1
2
—
0
1
—
—
13
13
38
51
42
E.N. Central
1
2
6
3
6
1
2
12
1
6
18
66
207
76
277
Illinois
—
0
3
—
—
—
1
10
—
2
—
18
121
7
58
Indiana
—
0
2
—
1
—
0
2
—
—
—
4
21
—
22
Michigan
—
0
1
—
1
—
0
2
—
—
—
10
38
8
75
Ohio
1
0
2
3
2
1
0
2
1
4
14
13
37
43
88
Wisconsin
—
0
1
—
2
—
0
1
—
—
4
12
53
18
34
W.N. Central
1
1
3
2
6
1
0
3
1
3
11
21
119
39
64
Iowa
—
0
1
—
1
—
0
2
—
—
—
4
9
—
14
Kansas
—
0
1
—
1
—
0
1
—
1
—
2
10
—
4
Minnesota
—
0
0
—
—
—
0
1
—
—
—
0
110
—
—
Missouri
1
0
3
2
2
1
0
3
1
1
11
7
27
38
36
Nebraska
—
0
2
—
2
—
0
1
—
1
—
1
5
1
9
North Dakota
—
0
1
—
—
—
0
3
—
—
—
0
10
—
—
South Dakota
—
0
1
—
—
—
0
0
—
—
—
0
7
—
1
S. Atlantic
1
2
8
4
2
2
0
4
2
—
24
25
67
50
94
Delaware
—
0
1
—
—
—
0
0
—
—
2
0
5
3
2
District of Columbia
—
0
1
—
—
—
0
1
—
—
—
0
2
1
1
Florida
1
1
5
2
1
1
0
2
1
—
12
6
17
18
12
Georgia
—
0
1
—
—
—
0
2
—
—
—
3
8
7
17
Maryland
—
0
2
2
—
1
0
1
1
—
1
2
8
7
13
North Carolina
—
0
3
—
—
—
0
2
—
—
—
3
35
4
—
South Carolina
—
0
1
—
1
—
0
1
—
—
—
2
9
—
20
Virginia
—
0
2
—
—
—
0
4
—
—
5
6
25
6
29
West Virginia
—
0
3
—
—
—
0
1
—
—
4
0
15
4
—
E.S. Central
—
0
3
—
3
—
0
1
—
1
5
9
15
20
42
Alabama
—
0
2
—
2
—
0
1
—
1
—
2
11
—
7
Kentucky
—
0
2
—
—
—
0
0
—
—
1
3
9
10
25
Mississippi
—
0
1
—
1
—
0
1
—
—
1
0
4
2
3
Tennessee
—
0
2
—
—
—
0
1
—
—
3
2
7
8
7
W.S. Central
—
1
5
—
2
—
1
12
—
2
4
19
60
6
19
Arkansas
—
0
2
—
1
—
0
2
—
—
—
1
5
—
2
Louisiana
—
0
2
—
1
—
0
0
—
—
—
0
3
—
1
Oklahoma
—
0
2
—
—
—
0
2
—
—
—
0
11
—
—
Texas
—
0
2
—
—
—
1
12
—
2
4
18
58
6
16
Mountain
—
1
4
—
4
—
0
2
1
1
7
39
85
40
141
Arizona
—
0
1
—
2
—
0
0
—
—
2
12
28
6
53
Colorado
—
0
1
—
1
—
0
1
1
—
—
8
25
17
36
Idaho
—
0
1
—
1
—
0
2
—
—
2
3
12
9
7
Montana
—
0
2
—
—
—
0
0
—
—
—
1
32
5
10
Nevada
—
0
1
—
—
—
0
0
—
—
3
0
4
3
3
New Mexico
—
0
1
—
—
—
0
1
—
1
—
3
24
—
3
Utah
—
0
2
—
—
—
0
0
—
—
—
7
15
—
29
Wyoming
—
0
0
—
—
—
0
1
—
—
—
0
1
—
—
Pacific
3
2
10
7
12
—
0
11
3
1
3
61
125
15
304
Alaska
—
0
1
—
—
—
0
1
—
—
—
0
4
2
4
California
3
2
9
5
9
—
0
11
3
—
1
36
86
5
286
Hawaii
—
0
1
—
1
—
0
1
—
—
1
1
9
6
1
Oregon
—
0
3
2
2
—
0
1
—
1
1
5
23
2
13
Washington
—
0
2
—
—
—
0
1
—
—
—
11
88
—
—
Territories
American Samoa
—
0
0
—
—
—
0
0
—
—
—
0
0
—
—
C.N.M.I.
—
—
—
—
—
—
—
—
—
—
—
—
—
—
—
Guam
—
0
0
—
—
—
1
3
—
—
—
2
14
—
—
Puerto Rico
—
0
0
—
—
—
0
1
—
—
—
0
1
—
1
U.S. Virgin Islands
—
0
0
—
—
—
0
0
—
—
—
0
0
—
—
C.N.M.I.: Commonwealth of Northern Mariana Islands.
U: Unavailable. —: No reported cases. N: Not reportable. NN: Not Nationally Notifiable. Cum: Cumulative year-to-date counts. Med: Median. Max: Maximum.
† Data for meningococcal disease, invasive caused by serogroups A, C, Y, and W-135; serogroup B; other serogroup; and unknown serogroup are available in Table I.
TABLE II. (Continued) Provisional cases of selected notifiable diseases, United States, weeks ending January 21, 2012, and January 22, 2011 (3rd week)*
Reporting area
Rabies, animal
Salmonellosis
Shiga toxin-producing E. coli(STEC)†
Current week
Previous 52 weeks
Cum 2012
Cum 2011
Current week
Previous 52 weeks
Cum 2012
Cum 2011
Current week
Previous 52 weeks
Cum 2012
Cum 2011
Med
Max
Med
Max
Med
Max
United States
14
60
113
49
163
268
863
1,850
844
1,436
18
85
201
63
122
New England
—
5
16
11
6
1
36
107
14
60
—
3
13
—
5
Connecticut
—
2
10
—
2
—
8
30
—
13
—
1
4
—
2
Maine
—
1
6
8
1
—
2
8
5
2
—
0
3
—
—
Massachusetts
—
0
0
—
—
—
19
44
—
33
—
1
9
—
2
New Hampshire
—
0
3
2
—
1
3
8
3
8
—
0
3
—
1
Rhode Island
—
0
6
—
—
—
1
62
—
—
—
0
2
—
—
Vermont
—
0
2
1
3
—
1
8
6
4
—
0
3
—
—
Mid. Atlantic
2
16
35
9
37
19
72
172
76
132
2
8
28
7
15
New Jersey
—
0
0
—
—
—
0
3
—
—
—
0
0
—
—
New York (Upstate)
2
7
20
9
14
8
26
67
18
20
1
3
13
1
6
New York City
—
0
3
—
—
3
19
42
24
43
—
1
6
1
1
Pennsylvania
—
8
21
—
23
8
31
113
34
69
1
3
16
5
8
E.N. Central
—
2
17
1
2
21
88
184
60
196
2
14
51
10
29
Illinois
—
0
6
—
1
—
27
80
2
84
—
4
14
1
6
Indiana
—
0
7
—
—
—
9
27
—
16
—
1
10
—
7
Michigan
—
1
6
1
1
2
14
42
15
28
—
3
19
6
8
Ohio
—
1
5
—
—
19
20
46
42
48
2
3
10
3
2
Wisconsin
N
0
0
N
N
—
11
46
1
20
—
3
21
—
6
W.N. Central
—
1
7
—
—
10
40
103
33
62
1
11
40
9
9
Iowa
—
0
0
—
—
1
8
19
5
14
—
2
15
1
2
Kansas
—
0
4
—
—
—
7
27
—
12
—
2
8
—
1
Minnesota
—
0
0
—
—
—
0
0
—
—
—
0
0
—
—
Missouri
—
0
1
—
—
8
16
46
23
27
—
5
32
5
2
Nebraska
—
0
3
—
—
1
4
13
4
6
1
1
7
2
4
North Dakota
—
0
3
—
—
—
0
15
—
—
—
0
4
—
—
South Dakota
—
0
0
—
—
—
3
10
1
3
—
1
4
1
—
S. Atlantic
6
19
93
14
113
151
271
725
390
425
8
12
28
21
28
Delaware
—
0
0
—
—
—
3
12
5
6
—
0
2
—
—
District of Columbia
—
0
0
—
—
—
1
6
—
—
—
0
1
—
—
Florida
4
0
84
6
84
60
107
203
183
166
6
3
9
10
4
Georgia
—
0
0
—
—
4
40
128
38
68
—
2
8
1
6
Maryland
—
6
13
4
1
10
18
43
36
41
—
1
3
1
5
North Carolina
—
0
0
—
—
73
29
251
73
67
2
2
11
2
5
South Carolina
N
0
0
N
N
—
26
70
30
28
—
0
4
—
—
Virginia
—
11
27
—
28
3
19
53
23
49
—
3
9
7
8
West Virginia
2
0
30
4
—
1
0
18
2
—
—
0
2
—
—
E.S. Central
1
3
11
5
3
13
63
190
72
113
1
4
18
5
6
Alabama
1
2
7
4
1
—
20
70
18
35
—
0
15
2
2
Kentucky
—
0
2
1
—
5
11
30
14
16
—
1
5
—
1
Mississippi
—
0
1
—
—
1
22
66
21
27
—
0
4
2
—
Tennessee
—
1
6
—
2
7
16
52
19
35
1
1
11
1
3
W.S. Central
4
0
21
4
—
6
125
250
22
111
3
10
45
3
3
Arkansas
—
0
10
—
—
3
13
52
12
18
2
1
6
2
1
Louisiana
—
0
0
—
—
—
14
44
1
34
—
0
1
—
—
Oklahoma
4
0
21
4
—
3
12
31
5
9
1
1
10
1
1
Texas
—
0
0
—
—
—
87
156
4
50
—
7
45
—
1
Mountain
1
1
4
5
—
12
46
92
51
135
1
10
25
7
14
Arizona
N
0
0
N
N
9
15
34
27
48
—
1
7
1
2
Colorado
—
0
0
—
—
—
10
24
11
30
—
2
7
1
7
Idaho
—
0
1
—
—
1
3
8
1
10
—
1
8
1
4
Montana
N
0
0
N
N
1
2
10
4
2
—
1
4
—
—
Nevada
—
0
2
—
—
1
3
7
2
12
—
1
7
1
—
New Mexico
1
0
3
5
—
—
5
22
2
20
—
1
3
2
1
Utah
—
0
2
—
—
—
6
15
3
13
1
1
7
1
—
Wyoming
—
0
0
—
—
—
1
9
1
—
—
0
7
—
—
Pacific
—
4
13
—
2
35
91
173
126
202
—
9
26
1
13
Alaska
—
0
2
—
1
1
1
6
6
3
—
0
1
—
—
California
—
3
12
—
—
31
72
141
103
152
—
4
14
—
9
Hawaii
—
0
0
—
—
3
7
14
7
26
—
0
2
—
—
Oregon
—
0
1
—
1
—
5
12
9
21
—
1
11
1
4
Washington
—
0
0
—
—
—
9
29
1
—
—
2
13
—
—
Territories
American Samoa
N
0
0
N
N
—
0
0
—
—
—
0
0
—
—
C.N.M.I.
—
—
—
—
—
—
—
—
—
—
—
—
—
—
—
Guam
—
0
0
—
—
—
0
3
—
3
—
0
0
—
—
Puerto Rico
—
0
6
—
1
—
3
12
—
6
—
0
0
—
—
U.S. Virgin Islands
—
0
0
—
—
—
0
0
—
—
—
0
0
—
—
C.N.M.I.: Commonwealth of Northern Mariana Islands.
U: Unavailable. —: No reported cases. N: Not reportable. NN: Not Nationally Notifiable. Cum: Cumulative year-to-date counts. Med: Median. Max: Maximum.
† Includes E. coli O157:H7; Shiga toxin-positive, serogroup non-O157; and Shiga toxin-positive, not serogrouped.
TABLE II. (Continued) Provisional cases of selected notifiable diseases, United States, weeks ending January 21, 2012, and January 22, 2011 (3rd week)*
Spotted Fever Rickettsiosis (including RMSF)†
Reporting area
Shigellosis
Confirmed
Probable
Current week
Previous 52 weeks
Cum 2012
Cum 2011
Current week
Previous 52 weeks
Cum 2012
Cum 2011
Current week
Previous 52 weeks
Cum 2012
Cum 2011
Med
Max
Med
Max
Med
Max
United States
99
242
350
358
466
—
3
15
4
6
4
27
140
15
12
New England
—
5
21
—
12
—
0
1
—
—
—
0
1
—
—
Connecticut
—
0
4
—
2
—
0
0
—
—
—
0
0
—
—
Maine
—
0
8
—
1
—
0
0
—
—
—
0
1
—
—
Massachusetts
—
3
20
—
8
—
0
0
—
—
—
0
1
—
—
New Hampshire
—
0
1
—
—
—
0
1
—
—
—
0
1
—
—
Rhode Island
—
0
3
—
—
—
0
0
—
—
—
0
1
—
—
Vermont
—
0
1
—
1
—
0
0
—
—
—
0
0
—
—
Mid. Atlantic
7
16
53
55
28
—
0
2
1
—
—
1
5
1
1
New Jersey
1
0
17
26
—
—
0
0
—
—
—
0
0
—
—
New York (Upstate)
3
5
33
6
5
—
0
1
—
—
—
0
2
—
—
New York City
3
7
28
19
15
—
0
0
—
—
—
0
3
—
1
Pennsylvania
—
2
13
4
8
—
0
2
1
—
—
0
3
1
—
E.N. Central
18
14
40
77
47
—
0
2
1
—
—
2
10
—
2
Illinois
—
4
16
—
16
—
0
1
—
—
—
1
4
—
1
Indiana
—
0
4
—
4
—
0
1
1
—
—
0
4
—
—
Michigan
1
3
11
10
9
—
0
1
—
—
—
0
1
—
—
Ohio
17
5
27
67
18
—
0
2
—
—
—
0
2
—
1
Wisconsin
—
0
0
—
—
—
0
0
—
—
—
0
0
—
—
W.N. Central
3
5
18
9
40
—
0
4
—
—
—
4
29
2
1
Iowa
—
0
3
—
2
—
0
0
—
—
—
0
2
—
—
Kansas
—
1
5
—
9
—
0
0
—
—
—
0
0
—
—
Minnesota
—
0
0
—
—
—
0
0
—
—
—
0
0
—
—
Missouri
3
3
14
8
27
—
0
3
—
—
—
4
29
2
1
Nebraska
—
0
2
1
1
—
0
3
—
—
—
0
1
—
—
North Dakota
—
0
0
—
—
—
0
1
—
—
—
0
0
—
—
South Dakota
—
0
2
—
1
—
0
1
—
—
—
0
0
—
—
S. Atlantic
28
73
134
88
137
—
1
8
—
2
3
6
56
10
2
Delaware
—
0
2
—
—
—
0
1
—
—
—
0
4
1
—
District of Columbia
—
0
5
—
3
—
0
1
—
—
—
0
1
—
—
Florida
20
50
98
66
93
—
0
1
—
1
—
0
2
3
—
Georgia
2
10
24
13
17
—
1
7
—
—
—
0
0
—
—
Maryland
2
1
7
4
3
—
0
1
—
1
—
0
2
—
—
North Carolina
4
3
19
4
13
—
0
4
—
—
3
0
49
3
1
South Carolina
—
1
54
1
4
—
0
2
—
—
—
0
2
—
—
Virginia
—
2
7
—
4
—
0
1
—
—
—
4
14
3
1
West Virginia
—
0
2
—
—
—
0
0
—
—
—
0
1
—
—
E.S. Central
12
17
51
48
31
—
0
2
—
—
1
4
25
2
2
Alabama
—
5
21
12
14
—
0
1
—
—
1
1
8
1
1
Kentucky
11
4
22
30
1
—
0
1
—
—
—
0
2
—
—
Mississippi
—
4
24
4
5
—
0
0
—
—
—
0
2
—
—
Tennessee
1
4
11
2
11
—
0
2
—
—
—
4
20
1
1
W.S. Central
18
54
114
39
60
—
0
3
—
—
—
2
51
—
—
Arkansas
1
2
7
1
2
—
0
3
—
—
—
1
51
—
—
Louisiana
—
4
21
—
14
—
0
0
—
—
—
0
2
—
—
Oklahoma
9
3
28
14
4
—
0
1
—
—
—
0
25
—
—
Texas
8
43
98
24
40
—
0
1
—
—
—
0
4
—
—
Mountain
2
14
42
13
47
—
0
3
1
4
—
1
7
—
4
Arizona
2
5
27
8
21
—
0
3
—
4
—
0
6
—
4
Colorado
—
1
8
1
9
—
0
0
—
—
—
0
1
—
—
Idaho
—
0
3
—
2
—
0
1
1
—
—
0
1
—
—
Montana
—
1
15
1
1
—
0
0
—
—
—
0
1
—
—
Nevada
—
0
4
1
1
—
0
0
—
—
—
0
1
—
—
New Mexico
—
2
7
1
10
—
0
0
—
—
—
0
0
—
—
Utah
—
1
4
1
3
—
0
0
—
—
—
0
1
—
—
Wyoming
—
0
1
—
—
—
0
0
—
—
—
0
2
—
—
Pacific
11
19
44
29
64
—
0
2
1
—
—
0
1
—
—
Alaska
—
0
2
2
—
N
0
0
N
N
N
0
0
N
N
California
10
15
41
26
59
—
0
2
1
—
—
0
1
—
—
Hawaii
—
1
3
—
2
N
0
0
N
N
N
0
0
N
N
Oregon
1
0
4
1
3
—
0
0
—
—
—
0
0
—
—
Washington
—
1
9
—
—
—
0
0
—
—
—
0
0
—
—
Territories
American Samoa
—
0
0
—
1
N
0
0
N
N
N
0
0
N
N
C.N.M.I.
—
—
—
—
—
—
—
—
—
—
—
—
—
—
—
Guam
—
0
1
—
—
N
0
0
N
N
N
0
0
N
N
Puerto Rico
—
0
0
—
—
N
0
0
N
N
N
0
0
N
N
U.S. Virgin Islands
—
0
0
—
—
—
0
0
—
—
—
0
0
—
—
C.N.M.I.: Commonwealth of Northern Mariana Islands.
U: Unavailable. —: No reported cases. N: Not reportable. NN: Not Nationally Notifiable. Cum: Cumulative year-to-date counts. Med: Median. Max: Maximum.
† Illnesses with similar clinical presentation that result from Spotted fever group rickettsia infections are reported as Spotted fever rickettsioses. Rocky Mountain spotted fever (RMSF) caused by Rickettsia rickettsii, is the most common and well-known spotted fever.
TABLE II. (Continued) Provisional cases of selected notifiable diseases, United States, weeks ending January 21, 2012, and January 22, 2011 (3rd week)*
Reporting area
Streptococcus pneumoniae,† invasive disease
Syphilis, primary and secondary
All ages
Age <5
Current week
Previous 52 weeks
Cum 2012
Cum 2011
Current week
Previous 52 weeks
Cum 2012
Cum 2011
Current week
Previous 52 weeks
Cum 2012
Cum 2011
Med
Max
Med
Max
Med
Max
United States
146
261
464
695
1,177
11
20
41
46
62
58
263
316
276
656
New England
2
14
31
20
69
—
1
4
—
1
—
7
22
7
22
Connecticut
—
6
20
3
36
—
0
3
—
—
—
0
12
—
1
Maine
2
2
8
11
11
—
0
1
—
—
—
0
2
—
1
Massachusetts
—
0
3
—
3
—
0
2
—
1
—
5
10
6
14
New Hampshire
—
1
8
1
7
—
0
1
—
—
—
0
3
—
1
Rhode Island
—
1
6
—
10
—
0
1
—
—
—
0
7
1
5
Vermont
—
1
6
5
2
—
0
2
—
—
—
0
2
—
—
Mid. Atlantic
19
15
50
92
83
1
1
9
3
2
9
30
53
32
95
New Jersey
—
0
12
18
—
—
0
2
2
—
—
4
13
—
8
New York (Upstate)
17
2
30
49
5
1
1
8
1
2
1
4
9
7
5
New York City
2
12
24
25
78
—
0
9
—
—
—
14
24
10
59
Pennsylvania
N
0
0
N
N
N
0
0
N
N
8
7
17
15
23
E.N. Central
37
63
123
165
239
3
3
10
11
14
8
30
48
21
80
Illinois
N
0
0
N
N
—
0
0
—
—
7
11
24
12
31
Indiana
—
14
36
5
46
—
1
4
—
1
1
3
8
4
11
Michigan
4
13
26
32
48
1
0
3
2
5
—
5
12
1
17
Ohio
32
27
43
103
110
1
2
7
6
5
—
8
17
4
19
Wisconsin
1
8
24
25
35
1
0
2
3
3
—
1
5
—
2
W.N. Central
4
2
28
13
11
—
0
2
—
1
—
6
13
1
22
Iowa
N
0
0
N
N
N
0
0
N
N
—
0
3
1
—
Kansas
N
0
0
N
N
N
0
0
N
N
—
0
4
—
—
Minnesota
—
0
0
—
—
—
0
0
—
—
—
2
8
—
10
Missouri
N
0
0
N
N
—
0
0
—
—
—
2
6
—
11
Nebraska
4
2
9
13
11
—
0
2
—
1
—
0
2
—
1
North Dakota
—
0
25
—
—
—
0
1
—
—
—
0
0
—
—
South Dakota
N
0
0
N
N
—
0
0
—
—
—
0
0
—
—
S. Atlantic
38
67
143
211
402
4
5
15
13
24
20
68
100
93
146
Delaware
1
1
5
4
9
—
0
0
—
—
1
0
4
2
2
District of Columbia
—
1
5
1
2
—
0
1
1
—
6
3
8
13
8
Florida
21
21
55
92
170
1
2
8
5
10
1
23
36
28
71
Georgia
8
19
38
58
110
1
2
5
5
8
2
15
31
17
16
Maryland
2
9
29
20
65
—
1
3
—
5
3
8
20
5
13
North Carolina
N
0
0
N
N
N
0
0
N
N
7
8
21
19
17
South Carolina
—
8
22
23
46
—
0
3
—
1
—
4
11
—
8
Virginia
N
0
0
N
N
—
0
0
—
—
—
4
12
9
11
West Virginia
6
0
48
13
—
2
0
4
2
—
—
0
1
—
—
E.S. Central
21
23
45
74
102
2
2
4
7
11
—
15
30
4
32
Alabama
N
0
0
N
N
N
0
0
N
N
—
4
11
—
13
Kentucky
3
4
12
14
20
—
0
3
—
3
—
2
8
2
3
Mississippi
N
0
0
N
N
—
0
0
—
—
—
3
14
—
1
Tennessee
18
19
39
60
82
2
2
4
7
8
—
5
11
2
15
W.S. Central
16
31
96
49
100
1
3
10
6
1
16
36
50
66
84
Arkansas
4
4
14
11
19
1
0
4
2
1
—
4
10
—
9
Louisiana
—
2
11
1
20
—
0
2
—
—
3
7
25
9
6
Oklahoma
N
0
0
N
N
—
0
0
—
—
—
1
6
—
2
Texas
12
24
83
37
61
—
3
9
4
—
13
23
38
57
67
Mountain
9
26
72
65
162
—
2
8
3
8
—
12
20
4
21
Arizona
7
11
45
43
80
—
1
5
2
2
—
4
10
3
12
Colorado
—
8
23
10
39
—
0
4
—
1
—
2
6
1
2
Idaho
N
0
0
N
N
—
0
0
—
—
—
0
4
—
—
Montana
N
0
0
N
N
N
0
0
N
N
—
0
1
—
2
Nevada
N
0
0
N
N
N
0
0
N
N
—
2
9
—
5
New Mexico
2
4
12
12
24
—
0
2
1
1
—
1
4
—
—
Utah
—
2
8
—
16
—
0
3
—
4
—
0
2
—
—
Wyoming
—
0
3
—
3
—
0
0
—
—
—
0
0
—
—
Pacific
—
3
11
6
9
—
0
2
3
—
5
56
74
48
154
Alaska
—
2
11
6
9
—
0
2
3
—
—
0
2
—
—
California
N
0
0
N
N
N
0
0
N
N
3
44
62
39
130
Hawaii
—
0
1
—
—
—
0
1
—
—
—
0
3
—
—
Oregon
N
0
0
N
N
N
0
0
N
N
—
4
14
2
5
Washington
N
0
0
N
N
N
0
0
N
N
2
6
11
7
19
Territories
American Samoa
N
0
0
N
N
—
0
0
—
—
—
0
0
—
—
C.N.M.I.
—
—
—
—
—
—
—
—
—
—
—
—
—
—
—
Guam
—
0
0
—
—
—
0
0
—
—
—
0
0
—
—
Puerto Rico
—
0
0
—
—
—
0
0
—
—
—
4
15
4
7
U.S. Virgin Islands
—
0
0
—
—
—
0
0
—
—
—
0
0
—
—
C.N.M.I.: Commonwealth of Northern Mariana Islands.
U: Unavailable. —: No reported cases. N: Not reportable. NN: Not Nationally Notifiable. Cum: Cumulative year-to-date counts. Med: Median. Max: Maximum.
† Includes drug resistant and susceptible cases of invasive Streptococcus pneumoniae disease among children <5 years and among all ages. Case definition: Isolation of S. pneumoniae from a normally sterile body site (e.g., blood or cerebrospinal fluid).
TABLE II. (Continued) Provisional cases of selected notifiable diseases, United States, weeks ending January 21, 2012, and January 22, 2011 (3rd week)*
Reporting area
Varicella (chickenpox)
West Nile virus disease†
Neuroinvasive
Nonneuroinvasive§
Current week
Previous 52 weeks
Cum 2012
Cum 2011
Current week
Previous 52 weeks
Cum 2012
Cum 2011
Current week
Previous 52 weeks
Cum 2012
Cum 2011
Med
Max
Med
Max
Med
Max
United States
108
257
342
416
784
—
0
60
—
—
—
0
31
—
—
New England
3
21
50
11
84
—
0
3
—
—
—
0
1
—
—
Connecticut
—
5
16
—
15
—
0
2
—
—
—
0
1
—
—
Maine
2
4
11
2
18
—
0
0
—
—
—
0
0
—
—
Massachusetts
—
9
18
—
28
—
0
2
—
—
—
0
1
—
—
New Hampshire
—
1
7
—
8
—
0
0
—
—
—
0
0
—
—
Rhode Island
—
0
6
—
1
—
0
1
—
—
—
0
0
—
—
Vermont
1
1
9
9
14
—
0
1
—
—
—
0
0
—
—
Mid. Atlantic
19
19
51
108
56
—
0
11
—
—
—
0
6
—
—
New Jersey
10
0
41
73
—
—
0
1
—
—
—
0
2
—
—
New York (Upstate)
N
0
0
N
N
—
0
5
—
—
—
0
4
—
—
New York City
—
0
0
—
—
—
0
4
—
—
—
0
1
—
—
Pennsylvania
9
19
39
35
56
—
0
2
—
—
—
0
1
—
—
E.N. Central
23
65
114
141
244
—
0
13
—
—
—
0
6
—
—
Illinois
5
18
38
35
47
—
0
6
—
—
—
0
5
—
—
Indiana
—
5
20
14
11
—
0
2
—
—
—
0
1
—
—
Michigan
6
18
44
28
78
—
0
7
—
—
—
0
1
—
—
Ohio
12
21
47
64
108
—
0
3
—
—
—
0
3
—
—
Wisconsin
—
0
1
—
—
—
0
1
—
—
—
0
1
—
—
W.N. Central
—
11
32
2
61
—
0
9
—
—
—
0
7
—
—
Iowa
N
0
0
N
N
—
0
2
—
—
—
0
2
—
—
Kansas
—
7
21
—
29
—
0
1
—
—
—
0
0
—
—
Minnesota
—
0
1
—
—
—
0
1
—
—
—
0
1
—
—
Missouri
—
3
14
1
30
—
0
2
—
—
—
0
2
—
—
Nebraska
—
0
2
—
—
—
0
4
—
—
—
0
3
—
—
North Dakota
—
0
7
—
1
—
0
1
—
—
—
0
1
—
—
South Dakota
—
1
6
1
1
—
0
0
—
—
—
0
1
—
—
S. Atlantic
19
36
65
57
77
—
0
10
—
—
—
0
5
—
—
Delaware
—
0
2
—
1
—
0
1
—
—
—
0
0
—
—
District of Columbia
—
0
2
—
2
—
0
3
—
—
—
0
3
—
—
Florida
17
17
38
45
42
—
0
5
—
—
—
0
2
—
—
Georgia
N
0
0
N
N
—
0
2
—
—
—
0
1
—
—
Maryland
N
0
0
N
N
—
0
5
—
—
—
0
3
—
—
North Carolina
N
0
0
N
N
—
0
1
—
—
—
0
0
—
—
South Carolina
—
0
9
—
—
—
0
0
—
—
—
0
0
—
—
Virginia
2
9
26
12
16
—
0
2
—
—
—
0
0
—
—
West Virginia
—
6
32
—
16
—
0
1
—
—
—
0
0
—
—
E.S. Central
1
5
15
11
20
—
0
11
—
—
—
0
5
—
—
Alabama
1
5
14
9
17
—
0
2
—
—
—
0
0
—
—
Kentucky
N
0
0
N
N
—
0
2
—
—
—
0
1
—
—
Mississippi
—
0
2
2
3
—
0
5
—
—
—
0
4
—
—
Tennessee
N
0
0
N
N
—
0
3
—
—
—
0
1
—
—
W.S. Central
30
53
136
53
70
—
0
4
—
—
—
0
3
—
—
Arkansas
—
5
26
1
6
—
0
1
—
—
—
0
0
—
—
Louisiana
—
2
6
—
4
—
0
1
—
—
—
0
2
—
—
Oklahoma
N
0
0
N
N
—
0
1
—
—
—
0
0
—
—
Texas
30
46
131
52
60
—
0
3
—
—
—
0
3
—
—
Mountain
13
23
68
33
153
—
0
11
—
—
—
0
5
—
—
Arizona
1
4
50
2
49
—
0
7
—
—
—
0
4
—
—
Colorado
9
7
32
22
40
—
0
2
—
—
—
0
2
—
—
Idaho
N
0
0
N
N
—
0
1
—
—
—
0
1
—
—
Montana
—
2
15
—
41
—
0
1
—
—
—
0
0
—
—
Nevada
N
0
0
N
N
—
0
4
—
—
—
0
2
—
—
New Mexico
3
1
4
4
4
—
0
1
—
—
—
0
0
—
—
Utah
—
3
26
4
19
—
0
1
—
—
—
0
1
—
—
Wyoming
—
0
1
1
—
—
0
1
—
—
—
0
1
—
—
Pacific
—
2
9
—
19
—
0
18
—
—
—
0
7
—
—
Alaska
—
1
4
—
6
—
0
0
—
—
—
0
0
—
—
California
—
0
4
—
6
—
0
18
—
—
—
0
7
—
—
Hawaii
—
1
4
—
7
—
0
0
—
—
—
0
0
—
—
Oregon
N
0
0
N
N
—
0
0
—
—
—
0
0
—
—
Washington
N
0
0
N
N
—
0
0
—
—
—
0
0
—
—
Territories
American Samoa
N
0
0
N
N
—
0
0
—
—
—
0
0
—
—
C.N.M.I.
—
—
—
—
—
—
—
—
—
—
—
—
—
—
—
Guam
—
2
4
—
1
—
0
0
—
—
—
0
0
—
—
Puerto Rico
—
3
10
—
12
—
0
0
—
—
—
0
0
—
—
U.S. Virgin Islands
—
0
0
—
—
—
0
0
—
—
—
0
0
—
—
C.N.M.I.: Commonwealth of Northern Mariana Islands.
U: Unavailable. —: No reported cases. N: Not reportable. NN: Not Nationally Notifiable. Cum: Cumulative year-to-date counts. Med: Median. Max: Maximum.
† Updated weekly from reports to the Division of Vector-Borne Infectious Diseases, National Center for Zoonotic, Vector-Borne, and Enteric Diseases (ArboNET Surveillance). Data for California serogroup, eastern equine, Powassan, St. Louis, and western equine diseases are available in Table I.
§ Not reportable in all states. Data from states where the condition is not reportable are excluded from this table, except starting in 2007 for the domestic arboviral diseases and influenza-associated pediatric mortality, and in 2003 for SARS-CoV. Reporting exceptions are available at http://www.cdc.gov/ncphi/disss/nndss/phs/infdis.htm.
TABLE III. Deaths in 122 U.S. cities,* week ending January 21, 2012 (3rd week)
Reporting area
All causes, by age (years)
P&I† Total
Reporting area (Continued)
All causes, by age (years)
P&I† Total
All Ages
=65
45–64
25–44
1–24
<1
All Ages
=65
45–64
25–44
1–24
<1
New England
576
400
136
25
9
6
56
S. Atlantic
1,358
907
313
79
24
35
93
Boston, MA
143
90
38
7
6
2
16
Atlanta, GA
172
102
47
16
2
5
10
Bridgeport, CT
47
38
6
3
—
—
8
Baltimore, MD
161
97
46
14
—
4
15
Cambridge, MA
16
13
3
—
—
—
—
Charlotte, NC
141
96
28
9
5
3
8
Fall River, MA
35
26
7
2
—
—
1
Jacksonville, FL
19
16
3
—
—
—
3
Hartford, CT
44
33
9
1
—
1
7
Miami, FL
173
124
35
9
3
2
5
Lowell, MA
24
19
4
1
—
—
3
Norfolk, VA
61
36
19
3
—
3
8
Lynn, MA
7
3
3
1
—
—
—
Richmond, VA
74
49
17
3
4
1
3
New Bedford, MA
29
20
7
1
—
1
1
Savannah, GA
63
45
14
3
—
1
6
New Haven, CT
35
21
10
3
1
—
2
St. Petersburg, FL
61
40
14
3
1
3
2
Providence, RI
58
41
15
—
—
2
2
Tampa, FL
297
219
57
14
3
4
20
Somerville, MA
1
1
—
—
—
—
—
Washington, D.C.
115
67
28
5
6
9
10
Springfield, MA
41
28
10
2
1
—
4
Wilmington, DE
21
16
5
—
—
—
3
Waterbury, CT
35
22
11
1
1
—
4
E.S. Central
893
576
236
50
19
12
79
Worcester, MA
61
45
13
3
—
—
8
Birmingham, AL
157
103
45
5
3
1
12
Mid. Atlantic
1,938
1,378
418
88
31
23
106
Chattanooga, TN
104
75
17
7
3
2
7
Albany, NY
44
36
8
—
—
—
4
Knoxville, TN
100
68
23
6
2
1
20
Allentown, PA
22
16
5
1
—
—
—
Lexington, KY
79
48
28
1
1
1
3
Buffalo, NY
69
49
16
4
—
—
6
Memphis, TN
172
100
48
13
6
5
21
Camden, NJ
25
13
8
4
—
—
2
Mobile, AL
79
54
23
2
—
—
5
Elizabeth, NJ
21
11
7
2
—
1
—
Montgomery, AL
33
22
8
1
2
—
2
Erie, PA
51
36
13
1
1
—
2
Nashville, TN
169
106
44
15
2
2
9
Jersey City, NJ
14
9
3
2
—
—
—
W.S. Central
1,234
789
279
93
35
36
73
New York City, NY
997
717
217
40
15
8
51
Austin, TX
84
53
22
4
2
3
4
Newark, NJ
56
32
15
6
1
2
2
Baton Rouge, LA
72
45
10
9
6
2
—
Paterson, NJ
28
16
5
3
—
4
—
Corpus Christi, TX
77
44
22
8
2
1
8
Philadelphia, PA
169
104
40
13
9
3
6
Dallas, TX
217
125
57
18
9
6
13
Pittsburgh, PA§
57
41
13
1
2
—
4
El Paso, TX
133
90
30
8
3
2
4
Reading, PA
37
27
6
2
2
—
—
Fort Worth, TX
U
U
U
U
U
U
U
Rochester, NY
87
64
16
4
—
3
4
Houston, TX
117
59
24
14
10
10
5
Schenectady, NY
21
18
3
—
—
—
2
Little Rock, AR
74
46
21
4
—
3
4
Scranton, PA
20
19
1
—
—
—
5
New Orleans, LA
U
U
U
U
U
U
U
Syracuse, NY
155
119
31
2
1
2
15
San Antonio, TX
276
201
57
14
2
2
16
Trenton, NJ
36
28
5
3
—
—
1
Shreveport, LA
71
50
16
1
—
4
6
Utica, NY
16
12
4
—
—
—
2
Tulsa, OK
113
76
20
13
1
3
13
Yonkers, NY
13
11
2
—
—
—
—
Mountain
1,170
804
257
71
14
24
99
E.N. Central
1,934
1,296
449
104
42
43
154
Albuquerque, NM
122
87
25
8
1
1
16
Akron, OH
46
30
8
5
2
1
6
Boise, ID
55
38
11
1
—
5
2
Canton, OH
44
35
9
—
—
—
5
Colorado Springs, CO
66
42
18
6
—
—
2
Chicago, IL
241
145
57
27
10
2
19
Denver, CO
102
64
26
12
—
—
6
Cincinnati, OH
83
55
18
6
3
1
9
Las Vegas, NV
265
196
55
8
5
1
24
Cleveland, OH
242
176
60
3
—
3
13
Ogden, UT
46
29
11
5
1
—
1
Columbus, OH
165
104
41
9
5
6
14
Phoenix, AZ
159
83
51
13
1
11
8
Dayton, OH
118
90
19
2
4
3
15
Pueblo, CO
25
18
5
2
—
—
2
Detroit, MI
154
68
56
18
5
7
7
Salt Lake City, UT
141
97
26
7
5
6
11
Evansville, IN
50
40
7
1
—
2
6
Tucson, AZ
189
150
29
9
1
—
27
Fort Wayne, IN
80
54
19
3
1
3
3
Pacific
1,538
1,106
301
80
23
27
165
Gary, IN
11
8
3
—
—
—
5
Berkeley, CA
14
12
2
—
—
—
1
Grand Rapids, MI
54
39
7
3
1
4
8
Fresno, CA
U
U
U
U
U
U
U
Indianapolis, IN
198
129
56
6
3
4
10
Glendale, CA
36
34
2
—
—
—
4
Lansing, MI
63
44
15
4
—
—
4
Honolulu, HI
75
58
10
2
2
3
9
Milwaukee, WI
88
45
29
7
4
3
8
Long Beach, CA
72
45
16
6
3
2
13
Peoria, IL
38
34
2
2
—
—
3
Los Angeles, CA
237
150
67
15
2
3
27
Rockford, IL
46
34
9
2
1
—
2
Pasadena, CA
23
17
3
3
—
—
3
South Bend, IN
45
34
7
2
—
2
5
Portland, OR
139
100
27
10
1
1
7
Toledo, OH
99
72
20
3
3
1
10
Sacramento, CA
239
185
42
7
1
3
29
Youngstown, OH
69
60
7
1
—
1
2
San Diego, CA
170
115
35
12
4
4
18
W.N. Central
618
397
159
35
14
13
53
San Francisco, CA
115
87
15
7
4
2
19
Des Moines, IA
—
—
—
—
—
—
—
San Jose, CA
202
152
38
6
3
3
20
Duluth, MN
35
24
8
2
1
—
5
Santa Cruz, CA
30
25
5
—
—
—
4
Kansas City, KS
38
17
13
3
3
2
4
Seattle, WA
67
43
15
4
1
4
3
Kansas City, MO
94
63
25
3
1
2
9
Spokane, WA
45
31
8
4
—
2
2
Lincoln, NE
36
31
4
—
1
—
2
Tacoma, WA
74
52
16
4
2
—
6
Minneapolis, MN
50
31
13
2
—
4
4
Total¶
11,259
7,653
2,548
625
211
219
878
Omaha, NE
76
61
10
2
3
—
10
St. Louis, MO
126
64
48
10
2
2
6
St. Paul, MN
69
46
17
4
1
1
3
Wichita, KS
94
60
21
9
2
2
10
U: Unavailable. —: No reported cases.
* Mortality data in this table are voluntarily reported from 122 cities in the United States, most of which have populations of >100,000. A death is reported by the place of its occurrence and by the week that the death certificate was filed. Fetal deaths are not included.
† Pneumonia and influenza.
§ Because of changes in reporting methods in this Pennsylvania city, these numbers are partial counts for the current week. Complete counts will be available in 4 to 6 weeks.