Persons using assistive technology might not be able to fully access information in this file. For assistance, please send e-mail to: mmwrq@cdc.gov. Type 508 Accommodation and the title of the report in the subject line of e-mail.
Notifiable Diseases and Mortality Tables
Table I Summary of provisional cases of selected notifiable diseases, United States, cumulative, week ending January 14, 2012 (2nd Week)
Figure I Selected notifiable disease reports, United States, comparison of provisional 4-week totals ending January 14, 2012, with historical data
Table II Provisional cases of selected notifiable diseases, United States, weeks ending January 14, 2012 and January 15, 2011 (2nd Week)
Table III Deaths in 122 U.S. cities, week ending January 14, 2012 (2nd Week)
TABLE I. Provisional cases of infrequently reported notifiable diseases (<1,000 cases reported during the preceding year) — United States, week ending January 14, 2012 (2nd week)*
TABLE I. (Continued) Provisional cases of infrequently reported notifiable diseases (<1,000 cases reported during the preceding year) — United States, week ending January 14, 2012 (2nd week)*
—: No reported cases. N: Not reportable. NN: Not Nationally Notifiable. Cum: Cumulative year-to-date counts.
§ Not reportable in all states. Data from states where the condition is not reportable are excluded from this table except starting in 2007 for the arboviral diseases, STD data, TB data, and influenza-associated pediatric mortality, and in 2003 for SARS-CoV. Reporting exceptions are available at http://www.cdc.gov/osels/ph_surveillance/nndss/phs/infdis.htm.
¶ Includes both neuroinvasive and nonneuroinvasive. Updated weekly from reports to the Division of Vector-Borne Infectious Diseases, National Center for Zoonotic, Vector-Borne, and Enteric Diseases (ArboNET Surveillance). Data for West Nile virus are available in Table II.
** Data for H. influenzae (all ages, all serotypes) are available in Table II.
†† Updated weekly from reports to the Influenza Division, National Center for Immunization and Respiratory Diseases. Since October 2, 2011, no influenza-associated pediatric deaths occurring during the 2011-12 influenza season have been reported.
§§ No measles cases were reported for the current week.
¶¶ Data for meningococcal disease (all serogroups) are available in Table II.
*** CDC discontinued reporting of individual confirmed and probable cases of 2009 pandemic influenza A (H1N1) virus infections on July 24, 2009. During 2009, four cases of human infection with novel influenza A viruses, different from the 2009 pandemic influenza A (H1N1) strain, were reported to CDC. The four cases of novel influenza A virus infection reported to CDC during 2010, and the eight cases reported during 2011, were identified as swine influenza A (H3N2) virus and are unrelated to the 2009 pandemic influenza A (H1N1) virus. Total case counts are provided by the Influenza Division, National Center for Immunization and Respiratory Diseases (NCIRD).
††† No rubella cases were reported for the current week.
§§§ Updated weekly from reports to the Division of STD Prevention, National Center for HIV/AIDS, Viral Hepatitis, STD, and TB Prevention.
¶¶¶ There were no cases of viral hemorrhagic fever reported during the current week. See Table II for dengue hemorrhagic fever.
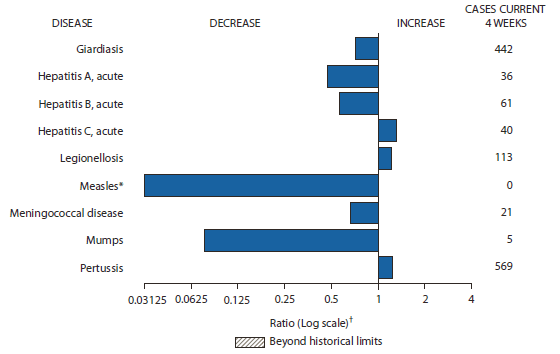
FIGURE I. Selected notifiable disease reports, United States, comparison of provisional 4-week totals January 14, 2012, with historical data
* No measles cases were reported for the current 4-week period yielding a ratio for week 2 of zero (0).
† Ratio of current 4-week total to mean of 15 4-week totals (from previous, comparable, and subsequent 4-week periods for the past 5 years). The point where the hatched area begins is based on the mean and two standard deviations of these 4-week totals.
Alternate Text: The figure above shows selected notifiable disease reports for the United States with comparison of 4-week totals through January 14, 2012, with historical data. Reports of acute hepatitis C, legionellosis, and pertussis all increased. Reports of giardiasis, acute hepatitis A, acute hepatitis B, measles, meningococcal disease, and mumps all decreased.
TABLE II. Provisional cases of selected notifiable diseases, United States, weeks ending January 14, 2012, and January 15, 2011 (2nd week)*
Reporting area
Chlamydia trachomatis infection
Coccidioidomycosis
Cryptosporidiosis
Current week
Previous 52 weeks
Cum 2012
Cum 2011
Current week
Previous 52 weeks
Cum 2012
Cum 2011
Current week
Previous 52 weeks
Cum 2012
Cum 2011
Med
Max
Med
Max
Med
Max
United States
8,893
26,696
30,779
19,877
49,928
70
383
586
164
795
46
128
394
93
193
New England
—
868
1,594
—
1,205
—
0
1
—
—
—
6
22
1
12
Connecticut
—
227
474
—
25
—
0
0
—
—
—
1
9
—
4
Maine
—
58
99
—
87
—
0
0
—
—
—
1
4
1
1
Massachusetts
—
434
860
—
867
—
0
0
—
—
—
2
8
—
6
New Hampshire
—
56
90
—
98
—
0
1
—
—
—
1
5
—
1
Rhode Island
—
79
170
—
73
—
0
0
—
—
—
0
1
—
—
Vermont
—
27
84
—
55
—
0
0
—
—
—
1
5
—
—
Mid. Atlantic
1,715
3,216
3,954
3,993
5,769
—
0
1
—
—
7
15
42
10
16
New Jersey
156
540
1,004
600
686
—
0
0
—
—
—
0
0
—
—
New York (Upstate)
482
715
1,339
653
772
—
0
0
—
—
3
4
16
3
1
New York City
268
1,084
1,315
1,212
2,373
—
0
0
—
—
—
1
6
—
2
Pennsylvania
809
995
1,236
1,528
1,938
—
0
1
—
—
4
9
26
7
13
E.N. Central
836
4,095
4,979
2,339
10,168
1
1
5
1
—
13
32
146
29
61
Illinois
23
1,127
1,347
226
2,576
—
0
0
—
—
—
3
26
—
8
Indiana
117
540
714
322
1,941
—
0
0
—
—
—
3
14
—
12
Michigan
509
943
1,429
991
2,477
—
0
3
—
—
1
6
14
3
9
Ohio
187
1,002
1,124
681
2,186
1
0
3
1
—
12
11
95
24
21
Wisconsin
—
468
553
119
988
—
0
0
—
—
—
8
64
2
11
W.N. Central
7
1,485
1,809
248
3,028
—
0
2
—
—
2
16
87
5
22
Iowa
7
212
253
238
455
—
0
0
—
—
—
6
19
1
7
Kansas
—
210
288
—
392
—
0
0
—
—
—
0
11
—
—
Minnesota
—
312
396
—
703
—
0
0
—
—
—
0
0
—
—
Missouri
—
539
759
—
1,072
—
0
0
—
—
1
5
63
2
5
Nebraska
—
119
215
—
186
—
0
2
—
—
1
2
12
2
5
North Dakota
—
39
64
—
54
—
0
0
—
—
—
0
12
—
—
South Dakota
—
62
89
10
166
—
0
0
—
—
—
2
13
—
5
S. Atlantic
3,695
5,401
7,458
7,730
9,762
—
0
2
—
—
12
21
50
26
45
Delaware
68
86
182
96
133
—
0
0
—
—
—
0
1
—
1
District of Columbia
124
109
190
259
212
—
0
0
—
—
—
0
1
—
—
Florida
793
1,507
1,700
1,686
2,884
—
0
0
—
—
11
8
17
15
20
Georgia
659
1,021
1,569
1,252
1,388
—
0
0
—
—
—
5
11
2
7
Maryland
—
468
790
—
643
—
0
2
—
—
1
1
7
8
2
North Carolina
1,431
997
1,688
2,956
2,059
—
0
0
—
—
—
0
34
—
—
South Carolina
—
530
1,343
—
674
—
0
0
—
—
—
2
6
1
9
Virginia
575
665
1,574
1,385
1,563
—
0
1
—
—
—
2
8
—
6
West Virginia
45
81
120
96
206
—
0
0
—
—
—
0
5
—
—
E.S. Central
584
1,894
2,804
1,038
2,855
—
0
0
—
—
4
7
25
7
5
Alabama
—
536
1,566
—
1,078
—
0
0
—
—
3
2
7
4
3
Kentucky
242
299
557
340
54
—
0
0
—
—
—
1
17
—
1
Mississippi
—
398
696
—
578
—
0
0
—
—
—
1
4
—
—
Tennessee
342
599
750
698
1,145
—
0
0
—
—
1
2
6
3
1
W.S. Central
66
3,372
4,327
215
6,294
—
0
1
—
—
1
8
43
3
4
Arkansas
—
309
440
—
568
—
0
0
—
—
1
0
2
1
—
Louisiana
—
377
1,071
113
638
—
0
1
—
—
—
0
9
—
—
Oklahoma
66
153
675
102
328
—
0
0
—
—
—
2
6
—
1
Texas
—
2,419
3,129
—
4,760
—
0
0
—
—
—
5
39
2
3
Mountain
1,038
1,767
2,369
1,621
2,759
61
303
459
117
593
5
10
30
6
14
Arizona
594
548
782
1,017
942
59
297
456
115
585
—
1
4
—
1
Colorado
394
421
847
440
495
—
0
0
—
—
—
3
12
—
1
Idaho
—
82
235
—
93
—
0
0
—
—
1
1
9
1
3
Montana
—
65
88
—
136
—
0
2
—
—
3
1
6
3
2
Nevada
25
205
380
31
409
2
2
5
2
6
1
0
2
2
1
New Mexico
—
202
481
—
381
—
1
4
—
—
—
3
9
—
3
Utah
25
133
190
133
249
—
0
4
—
2
—
1
5
—
3
Wyoming
—
34
67
—
54
—
0
2
—
—
—
0
5
—
—
Pacific
952
3,966
5,412
2,693
8,088
8
89
145
46
202
2
11
21
6
14
Alaska
39
109
157
132
245
—
0
0
—
—
—
0
3
—
—
California
624
2,978
4,483
1,743
6,215
8
89
145
46
201
1
6
16
3
3
Hawaii
—
114
141
—
202
—
0
0
—
—
—
0
1
—
—
Oregon
—
273
412
246
547
—
0
1
—
1
1
2
8
3
11
Washington
289
431
672
572
879
—
0
0
—
—
—
1
6
—
—
Territories
American Samoa
—
0
0
—
—
—
0
0
—
—
N
0
0
N
N
C.N.M.I.
—
—
—
—
—
—
—
—
—
—
—
—
—
—
—
Guam
—
14
44
—
—
—
0
0
—
—
—
0
0
—
—
Puerto Rico
14
104
349
49
287
—
0
0
—
—
N
0
0
N
N
U.S. Virgin Islands
—
17
27
—
19
—
0
0
—
—
—
0
0
—
—
C.N.M.I.: Commonwealth of Northern Mariana Islands.
U: Unavailable. —: No reported cases. N: Not reportable. NN: Not Nationally Notifiable. Cum: Cumulative year-to-date counts. Med: Median. Max: Maximum.
TABLE II. (Continued) Provisional cases of selected notifiable diseases, United States, weeks ending January 14, 2012, and January 15, 2011 (2nd week)*
Reporting area
Dengue Virus Infection
Dengue Fever†
Dengue Hemorrhagic Fever§
Current week
Previous 52 weeks
Cum 2012
Cum 2011
Current week
Previous 52 weeks
Cum 2012
Cum 2011
Med
Max
Med
Max
United States
—
2
16
—
10
—
0
1
—
—
New England
—
0
1
—
—
—
0
0
—
—
Connecticut
—
0
0
—
—
—
0
0
—
—
Maine
—
0
0
—
—
—
0
0
—
—
Massachusetts
—
0
0
—
—
—
0
0
—
—
New Hampshire
—
0
0
—
—
—
0
0
—
—
Rhode Island
—
0
0
—
—
—
0
0
—
—
Vermont
—
0
1
—
—
—
0
0
—
—
Mid. Atlantic
—
1
6
—
2
—
0
0
—
—
New Jersey
—
0
0
—
—
—
0
0
—
—
New York (Upstate)
—
0
0
—
—
—
0
0
—
—
New York City
—
0
4
—
1
—
0
0
—
—
Pennsylvania
—
0
2
—
1
—
0
0
—
—
E.N. Central
—
0
2
—
1
—
0
1
—
—
Illinois
—
0
1
—
—
—
0
1
—
—
Indiana
—
0
1
—
1
—
0
0
—
—
Michigan
—
0
1
—
—
—
0
0
—
—
Ohio
—
0
1
—
—
—
0
0
—
—
Wisconsin
—
0
2
—
—
—
0
0
—
—
W.N. Central
—
0
2
—
—
—
0
0
—
—
Iowa
—
0
1
—
—
—
0
0
—
—
Kansas
—
0
1
—
—
—
0
0
—
—
Minnesota
—
0
1
—
—
—
0
0
—
—
Missouri
—
0
1
—
—
—
0
0
—
—
Nebraska
—
0
0
—
—
—
0
0
—
—
North Dakota
—
0
1
—
—
—
0
0
—
—
South Dakota
—
0
0
—
—
—
0
0
—
—
S. Atlantic
—
1
8
—
4
—
0
1
—
—
Delaware
—
0
2
—
—
—
0
0
—
—
District of Columbia
—
0
0
—
—
—
0
0
—
—
Florida
—
1
7
—
3
—
0
0
—
—
Georgia
—
0
1
—
—
—
0
0
—
—
Maryland
—
0
2
—
—
—
0
0
—
—
North Carolina
—
0
1
—
—
—
0
0
—
—
South Carolina
—
0
1
—
—
—
0
0
—
—
Virginia
—
0
1
—
1
—
0
1
—
—
West Virginia
—
0
0
—
—
—
0
0
—
—
E.S. Central
—
0
3
—
—
—
0
0
—
—
Alabama
—
0
1
—
—
—
0
0
—
—
Kentucky
—
0
1
—
—
—
0
0
—
—
Mississippi
—
0
0
—
—
—
0
0
—
—
Tennessee
—
0
2
—
—
—
0
0
—
—
W.S. Central
—
0
2
—
—
—
0
0
—
—
Arkansas
—
0
0
—
—
—
0
0
—
—
Louisiana
—
0
1
—
—
—
0
0
—
—
Oklahoma
—
0
0
—
—
—
0
0
—
—
Texas
—
0
1
—
—
—
0
0
—
—
Mountain
—
0
1
—
1
—
0
0
—
—
Arizona
—
0
1
—
1
—
0
0
—
—
Colorado
—
0
0
—
—
—
0
0
—
—
Idaho
—
0
0
—
—
—
0
0
—
—
Montana
—
0
0
—
—
—
0
0
—
—
Nevada
—
0
1
—
—
—
0
0
—
—
New Mexico
—
0
1
—
—
—
0
0
—
—
Utah
—
0
1
—
—
—
0
0
—
—
Wyoming
—
0
0
—
—
—
0
0
—
—
Pacific
—
0
4
—
2
—
0
0
—
—
Alaska
—
0
0
—
—
—
0
0
—
—
California
—
0
2
—
1
—
0
0
—
—
Hawaii
—
0
4
—
—
—
0
0
—
—
Oregon
—
0
0
—
—
—
0
0
—
—
Washington
—
0
1
—
1
—
0
0
—
—
Territories
American Samoa
—
0
0
—
—
—
0
0
—
—
C.N.M.I.
—
—
—
—
—
—
—
—
—
—
Guam
—
0
0
—
—
—
0
0
—
—
Puerto Rico
—
18
83
—
46
—
0
3
—
1
U.S. Virgin Islands
—
0
0
—
—
—
0
0
—
—
C.N.M.I.: Commonwealth of Northern Mariana Islands.
U: Unavailable. —: No reported cases. N: Not reportable. NN: Not Nationally Notifiable. Cum: Cumulative year-to-date counts. Med: Median. Max: Maximum.
† Dengue Fever includes cases that meet criteria for Dengue Fever with hemorrhage, other clinical and unknown case classifications.
§ DHF includes cases that meet criteria for dengue shock syndrome (DSS), a more severe form of DHF.
TABLE II. (Continued) Provisional cases of selected notifiable diseases, United States, weeks ending January 14, 2012, and January 15, 2011 (2nd week)*
Reporting area
Ehrlichiosis/Anaplasmosis†
Ehrlichia chaffeensis
Anaplasma phagocytophilum
Undetermined
Current week
Previous 52 weeks
Cum 2012
Cum 2011
Current week
Previous 52 weeks
Cum 2012
Cum 2011
Current week
Previous 52 weeks
Cum 2012
Cum 2011
Med
Max
Med
Max
Med
Max
United States
—
7
93
1
3
1
17
57
1
6
—
2
9
—
1
New England
—
0
1
—
—
1
3
28
1
3
—
0
1
—
—
Connecticut
—
0
0
—
—
—
0
0
—
—
—
0
0
—
—
Maine
—
0
1
—
—
1
0
3
1
1
—
0
0
—
—
Massachusetts
—
0
0
—
—
—
1
18
—
—
—
0
0
—
—
New Hampshire
—
0
1
—
—
—
0
4
—
—
—
0
1
—
—
Rhode Island
—
0
1
—
—
—
0
15
—
2
—
0
1
—
—
Vermont
—
0
0
—
—
—
0
1
—
—
—
0
0
—
—
Mid. Atlantic
—
1
5
—
—
—
6
31
—
2
—
0
2
—
—
New Jersey
—
0
0
—
—
—
0
0
—
—
—
0
0
—
—
New York (Upstate)
—
0
4
—
—
—
3
27
—
1
—
0
2
—
—
New York City
—
0
2
—
—
—
0
5
—
1
—
0
0
—
—
Pennsylvania
—
0
0
—
—
—
0
1
—
—
—
0
0
—
—
E.N. Central
—
0
5
—
—
—
0
2
—
—
—
0
6
—
1
Illinois
—
0
4
—
—
—
0
2
—
—
—
0
1
—
—
Indiana
—
0
0
—
—
—
0
0
—
—
—
0
4
—
1
Michigan
—
0
2
—
—
—
0
0
—
—
—
0
2
—
—
Ohio
—
0
1
—
—
—
0
1
—
—
—
0
1
—
—
Wisconsin
—
0
0
—
—
—
0
1
—
—
—
0
1
—
—
W.N. Central
—
1
19
1
—
—
0
8
—
—
—
0
7
—
—
Iowa
N
0
0
N
N
N
0
0
N
N
N
0
0
N
N
Kansas
—
0
2
—
—
—
0
1
—
—
—
0
1
—
—
Minnesota
—
0
0
—
—
—
0
1
—
—
—
0
0
—
—
Missouri
—
1
19
1
—
—
0
7
—
—
—
0
7
—
—
Nebraska
—
0
1
—
—
—
0
1
—
—
—
0
0
—
—
North Dakota
N
0
0
N
N
N
0
0
N
N
N
0
0
N
N
South Dakota
—
0
1
—
—
—
0
1
—
—
—
0
0
—
—
S. Atlantic
—
2
33
—
3
—
1
8
—
1
—
0
2
—
—
Delaware
—
0
2
—
—
—
0
1
—
—
—
0
0
—
—
District of Columbia
N
0
0
N
N
N
0
0
N
N
N
0
0
N
N
Florida
—
0
3
—
—
—
0
3
—
—
—
0
0
—
—
Georgia
—
0
3
—
1
—
0
2
—
—
—
0
1
—
—
Maryland
—
0
3
—
1
—
0
2
—
—
—
0
1
—
—
North Carolina
—
0
17
—
1
—
0
6
—
1
—
0
0
—
—
South Carolina
—
0
1
—
—
—
0
0
—
—
—
0
1
—
—
Virginia
—
1
13
—
—
—
0
3
—
—
—
0
1
—
—
West Virginia
—
0
0
—
—
—
0
0
—
—
—
0
1
—
—
E.S. Central
—
0
8
—
—
—
0
2
—
—
—
0
3
—
—
Alabama
—
0
2
—
—
—
0
1
—
—
N
0
0
N
N
Kentucky
—
0
3
—
—
—
0
0
—
—
—
0
0
—
—
Mississippi
—
0
1
—
—
—
0
1
—
—
—
0
0
—
—
Tennessee
—
0
5
—
—
—
0
2
—
—
—
0
3
—
—
W.S. Central
—
0
30
—
—
—
0
3
—
—
—
0
0
—
—
Arkansas
—
0
13
—
—
—
0
3
—
—
—
0
0
—
—
Louisiana
—
0
0
—
—
—
0
0
—
—
—
0
0
—
—
Oklahoma
—
0
25
—
—
—
0
1
—
—
—
0
0
—
—
Texas
—
0
1
—
—
—
0
1
—
—
—
0
0
—
—
Mountain
—
0
0
—
—
—
0
0
—
—
—
0
1
—
—
Arizona
—
0
0
—
—
—
0
0
—
—
—
0
1
—
—
Colorado
N
0
0
N
N
N
0
0
N
N
N
0
0
N
N
Idaho
N
0
0
N
N
N
0
0
N
N
N
0
0
N
N
Montana
N
0
0
N
N
N
0
0
N
N
N
0
0
N
N
Nevada
N
0
0
N
N
N
0
0
N
N
N
0
0
N
N
New Mexico
N
0
0
N
N
N
0
0
N
N
N
0
0
N
N
Utah
—
0
0
—
—
—
0
0
—
—
—
0
1
—
—
Wyoming
—
0
0
—
—
—
0
0
—
—
—
0
0
—
—
Pacific
—
0
0
—
—
—
0
1
—
—
—
0
2
—
—
Alaska
N
0
0
N
N
N
0
0
N
N
N
0
0
N
N
California
—
0
0
—
—
—
0
0
—
—
—
0
2
—
—
Hawaii
N
0
0
N
N
N
0
0
N
N
N
0
0
N
N
Oregon
—
0
0
—
—
—
0
1
—
—
—
0
0
—
—
Washington
—
0
0
—
—
—
0
0
—
—
—
0
0
—
—
Territories
American Samoa
N
0
0
N
N
N
0
0
N
N
N
0
0
N
N
C.N.M.I.
—
—
—
—
—
—
—
—
—
—
—
—
—
—
—
Guam
N
0
0
N
N
N
0
0
N
N
N
0
0
N
N
Puerto Rico
N
0
0
N
N
N
0
0
N
N
N
0
0
N
N
U.S. Virgin Islands
—
0
0
—
—
—
0
0
—
—
—
0
0
—
—
C.N.M.I.: Commonwealth of Northern Mariana Islands.
U: Unavailable. —: No reported cases. N: Not reportable. NN: Not Nationally Notifiable. Cum: Cumulative year-to-date counts. Med: Median. Max: Maximum.
† Cumulative total E. ewingii cases reported for year 2011 = 13 and 0 case reports for 2012.
TABLE II. (Continued) Provisional cases of selected notifiable diseases, United States, weeks ending January 14, 2012, and January 15, 2011 (2nd week)*
Reporting area
Giardiasis
Gonorrhea
Haemophilus influenzae, invasive† All ages, all serotypes
Current week
Previous 52 weeks
Cum 2012
Cum 2011
Current week
Previous 52 weeks
Cum 2012
Cum 2011
Current week
Previous 52 weeks
Cum 2012
Cum 2011
Med
Max
Med
Max
Med
Max
United States
90
282
436
197
477
2,329
5,978
6,713
5,270
12,138
35
64
86
80
165
New England
3
27
64
5
41
—
107
178
—
125
—
4
12
2
17
Connecticut
—
4
10
—
9
—
45
101
—
32
—
1
4
—
4
Maine
3
3
10
3
4
—
5
18
—
2
—
0
2
2
3
Massachusetts
—
12
29
—
23
—
47
80
—
83
—
2
6
—
8
New Hampshire
—
2
8
—
4
—
2
7
—
4
—
0
2
—
1
Rhode Island
—
0
10
—
1
—
6
35
—
2
—
0
1
—
—
Vermont
—
3
19
2
—
—
0
6
—
2
—
0
2
—
1
Mid. Atlantic
16
54
92
25
82
411
744
916
1,015
1,309
15
15
25
29
29
New Jersey
—
0
0
—
—
39
150
232
179
205
—
2
6
—
4
New York (Upstate)
9
22
51
10
16
86
115
235
127
126
3
3
12
3
2
New York City
—
16
29
4
36
45
242
315
280
501
—
3
10
4
3
Pennsylvania
7
15
29
11
30
241
258
361
429
477
12
5
11
22
20
E.N. Central
13
47
82
35
105
258
1,059
1,427
692
2,912
3
11
22
11
32
Illinois
—
10
19
—
19
7
290
382
67
682
—
3
11
—
9
Indiana
—
6
12
—
13
21
133
168
79
558
—
2
6
—
5
Michigan
2
10
21
8
21
172
237
499
305
775
—
1
4
2
4
Ohio
11
15
31
23
34
58
311
398
200
698
3
4
7
9
9
Wisconsin
—
8
18
4
18
—
89
118
41
199
—
1
4
—
5
W.N. Central
15
19
52
26
40
—
310
375
51
612
—
2
10
1
2
Iowa
5
4
15
9
8
—
37
55
51
83
—
0
1
—
—
Kansas
—
2
9
—
5
—
42
65
—
73
—
0
2
—
—
Minnesota
—
0
0
—
—
—
44
61
—
85
—
0
0
—
—
Missouri
4
8
23
9
15
—
150
204
—
291
—
1
5
—
2
Nebraska
6
3
11
8
9
—
27
51
—
46
—
0
2
1
—
North Dakota
—
0
12
—
—
—
4
8
—
7
—
0
6
—
—
South Dakota
—
1
8
—
3
—
11
20
—
27
—
0
1
—
—
S. Atlantic
26
50
101
51
83
1,087
1,486
1,947
2,271
2,713
13
14
31
25
34
Delaware
—
0
3
—
—
16
15
35
23
35
—
0
2
—
—
District of Columbia
—
1
5
—
—
52
38
105
123
80
—
0
1
—
—
Florida
20
23
69
27
60
259
377
472
512
811
5
5
12
11
14
Georgia
—
10
51
10
5
172
312
461
400
452
1
2
6
3
9
Maryland
3
6
13
6
4
—
117
176
—
179
4
2
5
6
3
North Carolina
N
0
0
N
N
446
331
548
892
655
1
1
7
1
3
South Carolina
2
2
8
4
2
—
162
421
—
194
2
1
5
4
—
Virginia
1
5
12
4
12
133
116
352
307
266
—
2
8
—
5
West Virginia
—
0
8
—
—
9
15
29
14
41
—
0
5
—
—
E.S. Central
2
3
9
3
5
147
515
789
277
830
1
3
12
3
16
Alabama
2
3
9
3
5
—
164
408
—
352
—
1
3
—
6
Kentucky
N
0
0
N
N
64
76
151
102
16
—
1
4
—
3
Mississippi
N
0
0
N
N
—
103
191
—
176
—
0
3
—
2
Tennessee
N
0
0
N
N
83
148
222
175
286
1
2
6
3
5
W.S. Central
—
5
15
—
8
11
881
1,177
43
1,805
2
2
10
2
6
Arkansas
—
2
8
—
2
—
86
138
—
184
—
0
3
—
—
Louisiana
—
2
10
—
6
—
120
255
23
190
—
0
4
—
4
Oklahoma
—
0
0
—
—
11
36
196
20
105
2
1
9
2
2
Texas
N
0
0
N
N
—
592
837
—
1,326
—
0
1
—
—
Mountain
3
25
45
14
43
153
202
321
262
434
1
5
10
4
19
Arizona
—
2
6
—
5
110
82
130
205
130
—
1
6
—
9
Colorado
—
11
25
10
15
37
40
89
44
112
—
1
5
—
2
Idaho
—
3
9
1
7
—
3
13
—
8
—
0
2
—
2
Montana
1
2
5
1
2
—
1
4
—
5
—
0
1
—
1
Nevada
2
1
7
2
2
6
39
103
8
99
—
0
2
2
1
New Mexico
—
1
6
—
3
—
34
73
—
71
1
1
3
2
4
Utah
—
2
9
—
8
—
5
10
5
9
—
0
3
—
—
Wyoming
—
0
5
—
1
—
0
3
—
—
—
0
1
—
—
Pacific
12
47
117
38
70
262
631
745
659
1,398
—
3
9
3
10
Alaska
1
2
7
4
4
8
20
31
25
34
—
0
3
—
1
California
7
32
51
25
46
212
519
607
535
1,189
—
1
5
—
—
Hawaii
—
0
3
—
—
—
12
24
—
27
—
0
3
—
2
Oregon
3
7
20
8
17
—
27
60
13
57
—
1
6
3
7
Washington
1
6
95
1
3
42
49
79
86
91
—
0
1
—
—
Territories
American Samoa
—
0
0
—
—
—
0
0
—
—
—
0
0
—
—
C.N.M.I.
—
—
—
—
—
—
—
—
—
—
—
—
—
—
—
Guam
—
0
0
—
—
—
0
5
—
—
—
0
0
—
—
Puerto Rico
—
0
4
—
—
1
6
14
2
15
—
0
0
—
—
U.S. Virgin Islands
—
0
0
—
—
—
3
10
—
5
—
0
0
—
—
C.N.M.I.: Commonwealth of Northern Mariana Islands.
U: Unavailable. —: No reported cases. N: Not reportable. NN: Not Nationally Notifiable. Cum: Cumulative year-to-date counts. Med: Median. Max: Maximum.
† Data for H. influenzae (age <5 yrs for serotype b, nonserotype b, and unknown serotype) are available in Table I.
TABLE II. (Continued) Provisional cases of selected notifiable diseases, United States, weeks ending January 14, 2012, and January 15, 2011 (2nd week)*
Reporting area
Hepatitis (viral, acute), by type
A
B
C
Current week
Previous 52 weeks
Cum 2012
Cum 2011
Current week
Previous 52 weeks
Cum 2012
Cum 2011
Current week
Previous 52 weeks
Cum 2012
Cum 2011
Med
Max
Med
Max
Med
Max
United States
6
21
40
12
38
11
46
95
28
86
7
19
35
16
31
New England
—
1
5
—
4
—
1
8
—
4
—
1
5
—
—
Connecticut
—
0
3
—
2
—
0
4
—
—
—
0
5
—
—
Maine
—
0
2
—
—
—
0
2
—
—
—
0
2
—
—
Massachusetts
—
0
3
—
1
—
1
6
—
3
—
0
2
—
—
New Hampshire
—
0
0
—
—
—
0
1
—
1
N
0
0
N
N
Rhode Island
—
0
1
—
—
U
0
0
U
U
U
0
0
U
U
Vermont
—
0
2
—
1
—
0
0
—
—
—
0
1
—
—
Mid. Atlantic
1
3
7
1
3
—
5
8
1
6
—
1
5
1
1
New Jersey
—
0
0
—
—
—
0
1
—
—
—
0
1
—
—
New York (Upstate)
—
1
4
—
—
—
1
4
—
1
—
1
4
—
1
New York City
—
1
5
—
2
—
1
5
—
1
—
0
1
—
—
Pennsylvania
1
1
3
1
1
—
2
4
1
4
—
1
4
1
—
E.N. Central
2
4
8
2
7
1
6
37
2
15
—
2
8
1
10
Illinois
—
1
4
—
1
—
1
6
—
4
—
0
2
—
1
Indiana
—
0
3
—
—
—
1
4
—
1
—
0
5
—
7
Michigan
2
1
6
2
3
—
1
6
—
7
—
1
4
1
2
Ohio
—
1
3
—
2
1
1
30
2
2
—
0
1
—
—
Wisconsin
—
0
1
—
1
—
0
3
—
1
—
0
1
—
—
W.N. Central
—
1
7
—
1
—
2
9
1
9
—
0
4
—
—
Iowa
—
0
1
—
1
—
0
1
—
—
—
0
0
—
—
Kansas
—
0
1
—
—
—
0
2
—
2
—
0
1
—
—
Minnesota
—
0
7
—
—
—
0
7
—
—
—
0
2
—
—
Missouri
—
0
1
—
—
—
2
5
—
3
—
0
0
—
—
Nebraska
—
0
1
—
—
—
0
2
1
3
—
0
1
—
—
North Dakota
—
0
0
—
—
—
0
0
—
—
—
0
0
—
—
South Dakota
—
0
2
—
—
—
0
0
—
1
—
0
0
—
—
S. Atlantic
—
4
11
1
10
5
12
57
9
22
1
5
12
4
8
Delaware
—
0
1
—
1
—
0
2
—
—
U
0
0
U
U
District of Columbia
—
0
0
—
—
—
0
0
—
—
—
0
0
—
—
Florida
—
1
8
1
2
3
4
7
5
10
—
1
3
1
3
Georgia
—
1
5
—
3
—
2
7
1
1
—
1
3
—
1
Maryland
—
0
4
—
2
1
1
4
2
2
—
0
3
—
2
North Carolina
—
0
3
—
—
1
2
9
1
3
1
1
7
3
2
South Carolina
—
0
2
—
1
—
1
3
—
2
—
0
1
—
—
Virginia
—
0
3
—
1
—
1
4
—
4
—
0
3
—
—
West Virginia
—
0
2
—
—
—
0
43
—
—
—
0
7
—
—
E.S. Central
—
1
6
—
1
5
10
15
12
14
4
4
10
8
3
Alabama
—
0
2
—
—
1
2
6
2
3
1
0
3
1
—
Kentucky
—
0
2
—
1
2
3
7
4
5
2
2
8
3
1
Mississippi
—
0
1
—
—
—
1
4
—
—
U
0
0
U
U
Tennessee
—
0
5
—
—
2
4
8
6
6
1
1
5
4
2
W.S. Central
—
3
7
1
1
—
5
15
2
4
1
2
5
1
5
Arkansas
—
0
2
—
—
—
1
4
—
—
—
0
0
—
—
Louisiana
—
0
2
—
—
—
1
4
—
1
—
0
2
—
4
Oklahoma
—
0
2
—
—
—
1
9
—
1
—
1
4
—
—
Texas
—
2
7
1
1
—
3
7
2
2
1
0
3
1
1
Mountain
1
1
5
4
5
—
1
4
1
7
1
1
5
1
3
Arizona
1
0
2
1
2
—
0
3
1
1
U
0
0
U
U
Colorado
—
0
2
2
2
—
0
2
—
1
—
0
2
—
1
Idaho
—
0
1
—
—
—
0
1
—
1
—
0
2
—
2
Montana
—
0
1
—
—
—
0
0
—
—
—
0
1
—
—
Nevada
—
0
3
1
—
—
0
2
—
3
1
0
2
1
—
New Mexico
—
0
1
—
1
—
0
2
—
—
—
0
2
—
—
Utah
—
0
1
—
—
—
0
1
—
1
—
0
2
—
—
Wyoming
—
0
1
—
—
—
0
0
—
—
—
0
1
—
—
Pacific
2
3
11
3
6
—
3
8
—
5
—
1
8
—
1
Alaska
—
0
1
—
—
—
0
1
—
—
U
0
0
U
U
California
2
3
7
3
5
—
2
7
—
4
—
1
4
—
—
Hawaii
—
0
2
—
—
—
0
1
—
—
U
0
0
U
U
Oregon
—
0
2
—
1
—
0
4
—
1
—
0
2
—
—
Washington
—
0
4
—
—
—
0
3
—
—
—
0
4
—
1
Territories
American Samoa
—
0
0
—
—
—
0
0
—
—
—
0
0
—
—
C.N.M.I.
—
—
—
—
—
—
—
—
—
—
—
—
—
—
—
Guam
—
0
5
—
—
—
2
8
—
—
—
0
3
—
—
Puerto Rico
—
0
1
—
—
—
0
2
—
—
N
0
0
N
N
U.S. Virgin Islands
—
0
0
—
—
—
0
0
—
—
—
0
0
—
—
C.N.M.I.: Commonwealth of Northern Mariana Islands.
U: Unavailable. —: No reported cases. N: Not reportable. NN: Not Nationally Notifiable. Cum: Cumulative year-to-date counts. Med: Median. Max: Maximum.
TABLE II. (Continued) Provisional cases of selected notifiable diseases, United States, weeks ending January 14, 2012, and January 15, 2011 (2nd week)*
Reporting area
Legionellosis
Lyme disease
Malaria
Current week
Previous 52 weeks
Cum 2012
Cum 2011
Current week
Previous 52 weeks
Cum 2012
Cum 2011
Current week
Previous 52 weeks
Cum 2012
Cum 2011
Med
Max
Med
Max
Med
Max
United States
27
64
161
52
73
119
349
1,517
278
345
10
25
48
17
47
New England
—
4
39
—
3
1
78
500
5
120
—
1
7
—
3
Connecticut
—
1
10
—
—
—
33
232
—
64
—
0
2
—
1
Maine
—
0
3
—
—
—
12
67
2
—
—
0
2
—
—
Massachusetts
—
3
24
—
2
—
18
106
—
36
—
1
6
—
2
New Hampshire
—
0
3
—
—
—
10
90
—
16
—
0
1
—
—
Rhode Island
—
0
9
—
—
—
1
31
—
—
—
0
2
—
—
Vermont
—
0
2
—
1
1
6
68
3
4
—
0
1
—
—
Mid. Atlantic
7
16
72
9
18
98
185
746
234
142
—
6
13
—
11
New Jersey
—
0
0
—
—
81
1
107
172
—
—
0
0
—
—
New York (Upstate)
6
6
27
7
3
4
56
212
4
4
—
1
4
—
2
New York City
—
3
14
—
8
—
1
13
—
4
—
4
11
—
5
Pennsylvania
1
5
37
2
7
13
104
522
58
134
—
1
5
—
4
E.N. Central
10
12
51
18
15
2
15
211
3
27
1
3
10
2
5
Illinois
—
2
11
—
2
—
1
18
—
2
—
1
5
—
1
Indiana
1
2
7
2
3
—
1
12
—
—
—
0
2
—
—
Michigan
—
2
15
—
4
1
1
12
1
—
—
0
4
1
—
Ohio
9
7
34
16
6
1
1
6
2
—
1
1
4
1
3
Wisconsin
—
0
1
—
—
—
12
172
—
25
—
0
2
—
1
W.N. Central
—
1
8
1
1
—
1
16
—
1
—
1
5
1
—
Iowa
—
0
2
—
—
—
0
13
—
—
—
0
3
1
—
Kansas
—
0
2
—
—
—
0
2
—
—
—
0
2
—
—
Minnesota
—
0
0
—
—
—
0
0
—
—
—
0
0
—
—
Missouri
—
1
5
1
1
—
0
2
—
1
—
0
2
—
—
Nebraska
—
0
2
—
—
—
0
2
—
—
—
0
1
—
—
North Dakota
—
0
1
—
—
—
0
9
—
—
—
0
0
—
—
South Dakota
—
0
1
—
—
—
0
2
—
—
—
0
1
—
—
S. Atlantic
5
10
29
13
6
15
59
178
31
54
8
8
24
12
20
Delaware
—
0
4
—
—
5
12
48
8
20
—
0
3
—
—
District of Columbia
—
0
3
—
—
—
0
3
1
2
—
0
1
—
1
Florida
4
3
13
7
2
1
3
8
4
1
4
2
6
5
4
Georgia
—
1
3
3
1
—
0
5
—
—
—
1
6
—
3
Maryland
—
1
14
—
3
6
20
114
13
18
3
2
14
3
7
North Carolina
1
1
7
2
—
—
0
12
—
1
—
0
6
—
3
South Carolina
—
0
5
—
—
—
0
6
—
—
—
0
1
—
—
Virginia
—
1
7
1
—
1
14
75
3
12
1
1
8
4
2
West Virginia
—
0
5
—
—
2
0
13
2
—
—
0
0
—
—
E.S. Central
1
2
11
2
3
—
1
5
—
—
—
1
4
—
—
Alabama
—
0
2
—
1
—
0
2
—
—
—
0
3
—
—
Kentucky
—
1
4
—
1
—
0
1
—
—
—
0
2
—
—
Mississippi
—
0
3
—
—
—
0
1
—
—
—
0
1
—
—
Tennessee
1
1
8
2
1
—
0
4
—
—
—
0
3
—
—
W.S. Central
—
3
8
1
4
—
1
3
—
—
—
1
4
—
—
Arkansas
—
0
2
—
—
—
0
0
—
—
—
0
1
—
—
Louisiana
—
0
3
—
1
—
0
1
—
—
—
0
1
—
—
Oklahoma
—
0
3
—
—
—
0
0
—
—
—
0
1
—
—
Texas
—
2
7
1
3
—
1
3
—
—
—
0
4
—
—
Mountain
—
2
8
—
2
—
0
5
2
1
—
1
5
—
4
Arizona
—
1
4
—
1
—
0
4
1
—
—
0
4
—
1
Colorado
—
0
1
—
—
—
0
1
—
—
—
0
3
—
—
Idaho
—
0
1
—
—
—
0
2
1
—
—
0
1
—
—
Montana
—
0
1
—
—
—
0
3
—
—
—
0
1
—
—
Nevada
—
0
2
—
1
—
0
1
—
—
—
0
2
—
2
New Mexico
—
0
2
—
—
—
0
2
—
1
—
0
1
—
1
Utah
—
0
2
—
—
—
0
1
—
—
—
0
1
—
—
Wyoming
—
0
2
—
—
—
0
1
—
—
—
0
0
—
—
Pacific
4
5
14
8
21
3
2
8
3
—
1
3
11
2
4
Alaska
—
0
0
—
—
—
0
3
—
—
—
0
2
—
—
California
4
4
13
7
20
3
1
5
3
—
1
2
7
1
3
Hawaii
—
0
2
—
—
N
0
0
N
N
—
0
1
—
—
Oregon
—
0
3
1
1
—
0
2
—
—
—
0
4
1
1
Washington
—
0
3
—
—
—
0
6
—
—
—
0
2
—
—
Territories
American Samoa
N
0
0
N
N
N
0
0
N
N
—
0
1
—
—
C.N.M.I.
—
—
—
—
—
—
—
—
—
—
—
—
—
—
—
Guam
—
0
0
—
—
—
0
0
—
—
—
0
0
—
—
Puerto Rico
—
0
0
—
—
N
0
0
N
N
—
0
0
—
—
U.S. Virgin Islands
—
0
0
—
—
—
0
0
—
—
—
0
0
—
—
C.N.M.I.: Commonwealth of Northern Mariana Islands.
U: Unavailable. —: No reported cases. N: Not reportable. NN: Not Nationally Notifiable. Cum: Cumulative year-to-date counts. Med: Median. Max: Maximum.
TABLE II. (Continued) Provisional cases of selected notifiable diseases, United States, weeks ending January 14, 2012, and January 15, 2011 (2nd week)*
Reporting area
Meningococcal disease, invasive† All serogroups
Mumps
Pertussis
Current week
Previous 52 weeks
Cum 2012
Cum 2011
Current week
Previous 52 weeks
Cum 2012
Cum 2011
Current week
Previous 52 weeks
Cum 2012
Cum 2011
Med
Max
Med
Max
Med
Max
United States
3
12
30
9
37
1
7
19
4
12
85
309
495
200
714
New England
—
0
3
—
2
—
0
2
—
1
2
14
32
7
18
Connecticut
—
0
1
—
1
—
0
0
—
—
—
1
5
—
3
Maine
—
0
1
—
—
—
0
2
—
—
—
3
19
1
1
Massachusetts
—
0
2
—
1
—
0
1
—
1
—
4
10
—
10
New Hampshire
—
0
1
—
—
—
0
0
—
—
—
2
13
—
2
Rhode Island
—
0
1
—
—
—
0
2
—
—
—
0
4
1
2
Vermont
—
0
3
—
—
—
0
1
—
—
2
0
16
5
—
Mid. Atlantic
—
1
4
—
7
—
0
6
—
2
35
32
110
61
44
New Jersey
—
0
0
—
—
—
0
2
—
2
—
4
10
—
3
New York (Upstate)
—
0
4
—
—
—
0
3
—
—
25
12
90
27
13
New York City
—
0
2
—
5
—
0
6
—
—
—
2
42
—
—
Pennsylvania
—
0
2
—
2
—
0
1
—
—
10
13
40
34
28
E.N. Central
1
2
6
2
5
—
2
12
—
3
16
66
198
37
192
Illinois
—
0
3
—
—
—
1
10
—
1
—
18
121
1
44
Indiana
—
0
2
—
—
—
0
2
—
—
—
4
21
—
18
Michigan
—
0
1
—
1
—
0
2
—
—
1
10
38
6
46
Ohio
1
0
2
2
2
—
0
2
—
2
15
13
37
29
64
Wisconsin
—
0
2
—
2
—
0
1
—
—
—
12
44
1
20
W.N. Central
—
1
3
1
3
—
0
3
—
2
12
21
119
27
47
Iowa
—
0
1
—
1
—
0
2
—
—
—
4
9
—
8
Kansas
—
0
1
—
—
—
0
1
—
1
—
2
10
—
2
Minnesota
—
0
0
—
—
—
0
1
—
—
—
0
110
—
—
Missouri
—
0
3
1
1
—
0
3
—
—
11
7
27
26
28
Nebraska
—
0
2
—
1
—
0
1
—
1
1
1
5
1
8
North Dakota
—
0
1
—
—
—
0
3
—
—
—
0
10
—
—
South Dakota
—
0
1
—
—
—
0
0
—
—
—
0
7
—
1
S. Atlantic
1
2
8
3
2
—
0
4
—
—
9
25
67
24
63
Delaware
—
0
1
—
—
—
0
0
—
—
—
0
5
—
2
District of Columbia
—
0
1
—
—
—
0
1
—
—
1
0
2
1
1
Florida
1
1
5
1
1
—
0
2
—
—
1
6
17
6
8
Georgia
—
0
1
—
—
—
0
2
—
—
3
3
8
6
9
Maryland
—
0
2
2
—
—
0
1
—
—
2
2
8
6
8
North Carolina
—
0
3
—
—
—
0
2
—
—
1
3
35
4
—
South Carolina
—
0
1
—
1
—
0
1
—
—
—
2
9
—
19
Virginia
—
0
2
—
—
—
0
4
—
—
1
6
25
1
16
West Virginia
—
0
3
—
—
—
0
1
—
—
—
0
15
—
—
E.S. Central
—
0
3
—
2
1
0
1
1
1
5
9
25
12
33
Alabama
—
0
2
—
1
—
0
1
—
1
—
2
11
—
5
Kentucky
—
0
2
—
—
—
0
0
—
—
2
3
16
7
20
Mississippi
—
0
1
—
1
—
0
1
—
—
—
0
4
—
3
Tennessee
—
0
2
—
—
1
0
1
1
—
3
2
7
5
5
W.S. Central
—
1
5
—
2
—
1
12
—
1
1
19
38
2
7
Arkansas
—
0
2
—
1
—
0
2
—
—
—
1
5
—
1
Louisiana
—
0
2
—
1
—
0
0
—
—
—
0
3
—
1
Oklahoma
—
0
2
—
—
—
0
2
—
—
—
0
11
—
—
Texas
—
0
2
—
—
—
1
12
—
1
1
17
38
2
5
Mountain
—
1
4
—
4
—
0
2
1
1
1
37
79
24
96
Arizona
—
0
1
—
2
—
0
0
—
—
—
12
28
3
34
Colorado
—
0
1
—
1
—
0
1
1
—
—
8
25
17
26
Idaho
—
0
1
—
1
—
0
2
—
—
—
3
12
1
6
Montana
—
0
2
—
—
—
0
0
—
—
1
1
32
3
5
Nevada
—
0
1
—
—
—
0
0
—
—
—
0
4
—
2
New Mexico
—
0
1
—
—
—
0
1
—
1
—
3
23
—
1
Utah
—
0
2
—
—
—
0
0
—
—
—
6
16
—
22
Wyoming
—
0
0
—
—
—
0
1
—
—
—
0
1
—
—
Pacific
1
2
10
3
10
—
0
11
2
1
4
62
124
6
214
Alaska
—
0
1
—
—
—
0
1
—
—
2
0
4
2
4
California
1
2
9
2
8
—
0
11
2
—
2
36
102
4
200
Hawaii
—
0
1
—
1
—
0
1
—
—
—
1
9
—
1
Oregon
—
0
3
1
1
—
0
1
—
1
—
5
23
—
9
Washington
—
0
2
—
—
—
0
1
—
—
—
11
88
—
—
Territories
American Samoa
—
0
0
—
—
—
0
0
—
—
—
0
0
—
—
C.N.M.I.
—
—
—
—
—
—
—
—
—
—
—
—
—
—
—
Guam
—
0
0
—
—
—
1
3
—
—
—
2
14
—
—
Puerto Rico
—
0
0
—
—
—
0
1
—
—
—
0
1
—
1
U.S. Virgin Islands
—
0
0
—
—
—
0
0
—
—
—
0
0
—
—
C.N.M.I.: Commonwealth of Northern Mariana Islands.
U: Unavailable. —: No reported cases. N: Not reportable. NN: Not Nationally Notifiable. Cum: Cumulative year-to-date counts. Med: Median. Max: Maximum.
† Data for meningococcal disease, invasive caused by serogroups A, C, Y, and W-135; serogroup B; other serogroup; and unknown serogroup are available in Table I.
TABLE II. (Continued) Provisional cases of selected notifiable diseases, United States, weeks ending January 14, 2012, and January 15, 2011 (2nd week)*
Reporting area
Rabies, animal
Salmonellosis
Shiga toxin-producing E. coli(STEC)†
Current week
Previous 52 weeks
Cum 2012
Cum 2011
Current week
Previous 52 weeks
Cum 2012
Cum 2011
Current week
Previous 52 weeks
Cum 2012
Cum 2011
Med
Max
Med
Max
Med
Max
United States
14
58
113
26
49
220
855
1,824
437
979
17
87
204
37
87
New England
2
5
16
8
4
2
37
107
8
43
—
3
13
—
3
Connecticut
—
2
10
—
1
—
8
30
—
9
—
1
4
—
2
Maine
1
1
6
7
1
2
2
8
5
1
—
0
3
—
—
Massachusetts
—
0
0
—
—
—
19
44
—
24
—
1
9
—
1
New Hampshire
—
0
3
—
—
—
3
8
—
4
—
0
3
—
—
Rhode Island
—
0
6
—
—
—
1
62
—
1
—
0
2
—
—
Vermont
1
0
2
1
2
—
1
8
3
4
—
0
3
—
—
Mid. Atlantic
6
15
35
7
23
12
71
171
30
84
1
8
30
3
8
New Jersey
—
0
0
—
—
—
0
3
—
—
—
0
0
—
—
New York (Upstate)
6
7
20
7
11
7
26
67
9
11
—
3
13
—
4
New York City
—
0
3
—
—
—
19
42
3
24
—
1
6
—
1
Pennsylvania
—
8
21
—
12
5
31
112
18
49
1
3
18
3
3
E.N. Central
—
2
17
1
2
19
84
162
31
131
3
14
51
5
24
Illinois
—
0
6
—
1
—
27
80
—
51
—
3
14
—
4
Indiana
—
0
7
—
—
—
7
24
—
7
—
1
10
—
6
Michigan
—
1
6
1
1
3
14
42
7
23
2
3
19
4
7
Ohio
—
1
5
—
—
16
21
46
24
39
1
3
10
1
2
Wisconsin
N
0
0
N
N
—
6
45
—
11
—
2
21
—
5
W.N. Central
—
1
7
—
—
11
40
103
22
52
3
11
40
7
3
Iowa
—
0
0
—
—
—
8
19
3
10
—
2
15
1
—
Kansas
—
0
4
—
—
—
8
27
—
11
—
2
8
—
—
Minnesota
—
0
0
—
—
—
0
0
—
—
—
0
0
—
—
Missouri
—
0
1
—
—
10
16
46
15
24
2
5
32
4
—
Nebraska
—
0
3
—
—
1
4
13
3
5
1
1
7
1
3
North Dakota
—
0
3
—
—
—
0
15
—
—
—
0
4
—
—
South Dakota
—
0
0
—
—
—
3
10
1
2
—
1
4
1
—
S. Atlantic
5
19
93
7
20
115
254
724
194
301
6
12
28
12
17
Delaware
—
0
0
—
—
—
3
11
2
4
—
0
2
—
—
District of Columbia
—
0
0
—
—
—
1
6
—
—
—
0
1
—
—
Florida
3
0
84
5
—
77
107
203
123
111
4
3
9
4
2
Georgia
—
0
0
—
—
19
40
128
31
47
1
2
8
1
5
Maryland
—
6
13
—
—
18
18
43
26
28
—
1
3
1
3
North Carolina
—
0
0
—
—
—
30
251
—
54
—
2
11
—
3
South Carolina
N
0
0
N
N
—
26
70
2
18
—
0
4
—
—
Virginia
—
11
27
—
20
1
20
52
9
39
1
3
9
6
4
West Virginia
2
0
30
2
—
—
0
18
1
—
—
0
1
—
—
E.S. Central
1
3
11
3
—
9
63
190
34
78
—
4
18
2
6
Alabama
1
2
7
3
—
4
20
70
13
30
—
0
15
2
2
Kentucky
—
0
2
—
—
—
11
30
6
11
—
1
5
—
1
Mississippi
—
0
1
—
—
—
22
66
6
18
—
0
4
—
—
Tennessee
—
1
6
—
—
5
16
52
9
19
—
1
11
—
3
W.S. Central
—
0
21
—
—
9
122
250
15
65
—
10
39
—
2
Arkansas
—
0
10
—
—
7
13
52
9
13
—
1
6
—
1
Louisiana
—
0
0
—
—
—
14
44
1
23
—
0
1
—
—
Oklahoma
—
0
21
—
—
2
12
31
2
5
—
1
10
—
—
Texas
—
0
0
—
—
—
82
156
3
24
—
7
39
—
1
Mountain
—
0
4
—
—
8
46
93
34
79
—
10
25
3
7
Arizona
N
0
0
N
N
7
15
34
15
22
—
1
7
—
2
Colorado
—
0
0
—
—
—
10
24
11
23
—
2
7
1
3
Idaho
—
0
1
—
—
—
3
8
—
6
—
1
8
1
2
Montana
N
0
0
N
N
—
2
10
3
—
—
1
4
—
—
Nevada
—
0
2
—
—
1
3
7
1
11
—
1
7
—
—
New Mexico
—
0
2
—
—
—
6
22
2
10
—
1
3
1
—
Utah
—
0
2
—
—
—
6
15
1
7
—
1
7
—
—
Wyoming
—
0
0
—
—
—
1
9
1
—
—
0
7
—
—
Pacific
—
4
13
—
—
35
91
174
69
146
4
15
34
5
17
Alaska
—
0
2
—
—
3
1
6
3
2
—
0
1
—
—
California
—
3
12
—
—
30
73
142
60
111
3
9
19
4
14
Hawaii
—
0
0
—
—
—
7
14
2
17
—
0
2
—
—
Oregon
—
0
1
—
—
1
5
12
3
16
1
1
11
1
3
Washington
—
0
0
—
—
1
9
29
1
—
—
2
13
—
—
Territories
American Samoa
N
0
0
N
N
—
0
0
—
—
—
0
0
—
—
C.N.M.I.
—
—
—
—
—
—
—
—
—
—
—
—
—
—
—
Guam
—
0
0
—
—
—
0
3
—
—
—
0
0
—
—
Puerto Rico
—
0
6
—
—
—
3
12
—
2
—
0
0
—
—
U.S. Virgin Islands
—
0
0
—
—
—
0
0
—
—
—
0
0
—
—
C.N.M.I.: Commonwealth of Northern Mariana Islands.
U: Unavailable. —: No reported cases. N: Not reportable. NN: Not Nationally Notifiable. Cum: Cumulative year-to-date counts. Med: Median. Max: Maximum.
† Includes E. coli O157:H7; Shiga toxin-positive, serogroup non-O157; and Shiga toxin-positive, not serogrouped.
TABLE II. (Continued) Provisional cases of selected notifiable diseases, United States, weeks ending January 14, 2012, and January 15, 2011 (2nd week)*
Spotted Fever Rickettsiosis (including RMSF)†
Reporting area
Shigellosis
Confirmed
Probable
Current week
Previous 52 weeks
Cum 2012
Cum 2011
Current week
Previous 52 weeks
Cum 2012
Cum 2011
Current week
Previous 52 weeks
Cum 2012
Cum 2011
Med
Max
Med
Max
Med
Max
United States
105
235
346
193
318
—
3
15
2
4
3
26
140
11
9
New England
—
5
21
—
6
—
0
1
—
—
—
0
1
—
—
Connecticut
—
0
4
—
1
—
0
0
—
—
—
0
0
—
—
Maine
—
0
8
—
—
—
0
0
—
—
—
0
1
—
—
Massachusetts
—
3
20
—
4
—
0
0
—
—
—
0
1
—
—
New Hampshire
—
0
1
—
—
—
0
1
—
—
—
0
1
—
—
Rhode Island
—
0
3
—
—
—
0
0
—
—
—
0
1
—
—
Vermont
—
0
1
—
1
—
0
0
—
—
—
0
0
—
—
Mid. Atlantic
3
14
50
10
18
—
0
2
—
—
—
1
4
1
1
New Jersey
—
0
4
—
—
—
0
0
—
—
—
0
0
—
—
New York (Upstate)
1
5
30
3
3
—
0
1
—
—
—
0
2
—
—
New York City
—
7
28
4
9
—
0
0
—
—
—
0
3
—
1
Pennsylvania
2
2
6
3
6
—
0
2
—
—
—
0
3
1
—
E.N. Central
27
14
40
52
30
—
0
2
1
—
—
2
10
—
1
Illinois
—
4
16
—
10
—
0
1
—
—
—
1
4
—
1
Indiana
—
0
4
—
1
—
0
1
1
—
—
0
4
—
—
Michigan
2
3
11
2
7
—
0
1
—
—
—
0
1
—
—
Ohio
25
5
27
50
12
—
0
2
—
—
—
0
2
—
—
Wisconsin
—
0
0
—
—
—
0
0
—
—
—
0
0
—
—
W.N. Central
1
5
18
5
30
—
0
4
—
—
—
4
29
1
—
Iowa
—
0
3
—
1
—
0
0
—
—
—
0
2
—
—
Kansas
—
1
5
—
5
—
0
0
—
—
—
0
0
—
—
Minnesota
—
0
0
—
—
—
0
0
—
—
—
0
0
—
—
Missouri
—
3
14
4
23
—
0
3
—
—
—
4
29
1
—
Nebraska
1
0
2
1
1
—
0
3
—
—
—
0
1
—
—
North Dakota
—
0
0
—
—
—
0
1
—
—
—
0
0
—
—
South Dakota
—
0
2
—
—
—
0
1
—
—
—
0
0
—
—
S. Atlantic
40
73
134
59
101
—
1
8
—
1
2
6
56
6
2
Delaware
—
0
2
—
—
—
0
1
—
—
1
0
4
1
—
District of Columbia
—
0
5
—
2
—
0
1
—
—
—
0
1
—
—
Florida
28
50
98
46
65
—
0
1
—
—
1
0
2
3
—
Georgia
10
10
24
11
14
—
1
6
—
—
—
0
0
—
—
Maryland
2
1
7
2
3
—
0
1
—
1
—
0
2
—
—
North Carolina
—
3
19
—
11
—
0
4
—
—
—
0
49
—
1
South Carolina
—
1
54
—
3
—
0
2
—
—
—
0
2
—
—
Virginia
—
2
7
—
3
—
0
1
—
—
—
3
14
2
1
West Virginia
—
0
2
—
—
—
0
0
—
—
—
0
1
—
—
E.S. Central
13
17
47
32
22
—
0
2
—
—
1
4
25
2
2
Alabama
2
5
21
12
10
—
0
1
—
—
—
1
8
—
1
Kentucky
10
4
22
19
1
—
0
1
—
—
1
0
2
1
—
Mississippi
—
4
24
—
4
—
0
0
—
—
—
0
2
—
—
Tennessee
1
4
11
1
7
—
0
2
—
—
—
4
20
1
1
W.S. Central
13
54
103
15
40
—
0
3
—
—
—
2
51
—
—
Arkansas
—
2
7
—
2
—
0
3
—
—
—
1
51
—
—
Louisiana
—
4
21
—
11
—
0
0
—
—
—
0
2
—
—
Oklahoma
5
2
28
5
2
—
0
1
—
—
—
0
25
—
—
Texas
8
43
98
10
25
—
0
1
—
—
—
0
4
—
—
Mountain
2
14
42
5
30
—
0
2
—
3
—
1
7
—
3
Arizona
—
5
27
2
16
—
0
2
—
3
—
0
6
—
3
Colorado
—
1
8
1
9
—
0
0
—
—
—
0
1
—
—
Idaho
—
0
3
—
1
—
0
0
—
—
—
0
1
—
—
Montana
1
1
15
1
—
—
0
0
—
—
—
0
1
—
—
Nevada
1
0
4
1
—
—
0
0
—
—
—
0
1
—
—
New Mexico
—
2
7
—
2
—
0
0
—
—
—
0
0
—
—
Utah
—
1
4
—
2
—
0
0
—
—
—
0
1
—
—
Wyoming
—
0
1
—
—
—
0
0
—
—
—
0
2
—
—
Pacific
6
20
44
15
41
—
0
2
1
—
—
0
1
1
—
Alaska
2
0
2
2
—
N
0
0
N
N
N
0
0
N
N
California
4
16
41
13
36
—
0
2
1
—
—
0
1
1
—
Hawaii
—
1
3
—
2
N
0
0
N
N
N
0
0
N
N
Oregon
—
1
4
—
3
—
0
0
—
—
—
0
0
—
—
Washington
—
1
9
—
—
—
0
0
—
—
—
0
0
—
—
Territories
American Samoa
—
0
1
—
1
N
0
0
N
N
N
0
0
N
N
C.N.M.I.
—
—
—
—
—
—
—
—
—
—
—
—
—
—
—
Guam
—
0
1
—
—
N
0
0
N
N
N
0
0
N
N
Puerto Rico
—
0
0
—
—
N
0
0
N
N
N
0
0
N
N
U.S. Virgin Islands
—
0
0
—
—
—
0
0
—
—
—
0
0
—
—
C.N.M.I.: Commonwealth of Northern Mariana Islands.
U: Unavailable. —: No reported cases. N: Not reportable. NN: Not Nationally Notifiable. Cum: Cumulative year-to-date counts. Med: Median. Max: Maximum.
† Illnesses with similar clinical presentation that result from Spotted fever group rickettsia infections are reported as Spotted fever rickettsioses. Rocky Mountain spotted fever (RMSF) caused by Rickettsia rickettsii, is the most common and well-known spotted fever.
TABLE II. (Continued) Provisional cases of selected notifiable diseases, United States, weeks ending January 14, 2012, and January 15, 2011 (2nd week)*
Reporting area
Streptococcus pneumoniae,† invasive disease
Syphilis, primary and secondary
All ages
Age <5
Current week
Previous 52 weeks
Cum 2012
Cum 2011
Current week
Previous 52 weeks
Cum 2012
Cum 2011
Current week
Previous 52 weeks
Cum 2012
Cum 2011
Med
Max
Med
Max
Med
Max
United States
209
250
464
443
868
13
20
41
28
46
53
263
316
101
461
New England
5
12
31
14
46
—
1
4
—
1
—
7
21
—
18
Connecticut
—
4
20
—
25
—
0
2
—
—
—
0
12
—
—
Maine
2
2
8
9
5
—
0
1
—
—
—
0
2
—
1
Massachusetts
—
0
3
—
3
—
0
2
—
1
—
5
10
—
12
New Hampshire
—
1
8
—
6
—
0
1
—
—
—
0
3
—
—
Rhode Island
—
2
6
—
6
—
0
1
—
—
—
0
7
—
5
Vermont
3
1
6
5
1
—
0
2
—
—
—
0
2
—
—
Mid. Atlantic
27
15
48
49
60
—
1
9
1
—
9
30
53
17
69
New Jersey
1
0
6
7
—
—
0
1
1
—
—
4
13
—
5
New York (Upstate)
26
1
30
31
1
—
1
7
—
—
5
4
9
6
5
New York City
—
12
26
11
59
—
0
9
—
—
—
14
24
5
44
Pennsylvania
N
0
0
N
N
N
0
0
N
N
4
6
16
6
15
E.N. Central
33
61
123
94
188
3
3
10
6
9
3
30
48
4
58
Illinois
N
0
0
N
N
—
0
0
—
—
3
11
24
3
25
Indiana
—
14
36
—
39
—
1
4
—
1
—
3
8
—
7
Michigan
4
13
26
18
36
1
0
3
1
2
—
5
12
1
12
Ohio
29
27
43
70
86
2
2
7
5
3
—
8
17
—
13
Wisconsin
—
8
24
6
27
—
0
3
—
3
—
1
5
—
1
W.N. Central
4
2
28
9
9
—
0
2
—
1
—
6
13
—
16
Iowa
N
0
0
N
N
N
0
0
N
N
—
0
3
—
—
Kansas
N
0
0
N
N
N
0
0
N
N
—
0
4
—
—
Minnesota
—
0
0
—
—
—
0
0
—
—
—
2
8
—
9
Missouri
N
0
0
N
N
—
0
0
—
—
—
2
6
—
6
Nebraska
4
2
9
9
9
—
0
2
—
1
—
0
2
—
1
North Dakota
—
0
25
—
—
—
0
1
—
—
—
0
1
—
—
South Dakota
N
0
0
N
N
—
0
0
—
—
—
0
0
—
—
S. Atlantic
81
65
157
160
302
3
6
15
9
21
27
68
100
50
97
Delaware
—
1
5
1
7
—
0
0
—
—
1
0
4
1
1
District of Columbia
—
1
5
1
1
—
0
1
1
—
4
3
8
6
5
Florida
47
21
55
71
118
2
3
8
4
8
2
23
36
8
50
Georgia
16
20
40
47
84
1
2
5
4
8
10
14
31
14
9
Maryland
8
9
33
17
58
—
1
3
—
4
—
8
20
—
7
North Carolina
N
0
0
N
N
N
0
0
N
N
3
8
21
12
16
South Carolina
10
8
25
23
34
—
0
3
—
1
—
4
11
—
5
Virginia
N
0
0
N
N
—
0
0
—
—
7
4
12
9
4
West Virginia
—
0
48
—
—
—
0
4
—
—
—
0
1
—
—
E.S. Central
21
23
45
46
72
2
2
4
5
7
2
14
30
3
19
Alabama
N
0
0
N
N
N
0
0
N
N
—
4
11
—
9
Kentucky
2
4
12
9
15
—
0
3
—
3
2
2
8
2
—
Mississippi
N
0
0
N
N
—
0
0
—
—
—
3
14
—
—
Tennessee
19
19
37
37
57
2
1
4
5
4
—
5
11
1
10
W.S. Central
21
32
87
25
63
4
3
10
4
1
—
36
50
2
62
Arkansas
5
4
14
6
14
1
0
4
1
1
—
4
10
—
5
Louisiana
—
2
11
1
16
—
0
2
—
—
—
7
25
2
6
Oklahoma
N
0
0
N
N
—
0
0
—
—
—
1
6
—
2
Texas
16
25
76
18
33
3
2
9
3
—
—
23
37
—
49
Mountain
13
26
72
41
121
—
2
8
1
6
—
12
20
1
19
Arizona
13
11
45
27
62
—
1
5
—
2
—
4
10
—
10
Colorado
—
8
23
10
27
—
0
4
—
1
—
2
6
1
2
Idaho
N
0
0
N
N
—
0
0
—
—
—
0
4
—
—
Montana
N
0
0
N
N
N
0
0
N
N
—
0
1
—
2
Nevada
N
0
0
N
N
N
0
0
N
N
—
2
9
—
5
New Mexico
—
4
12
4
17
—
0
2
1
—
—
1
4
—
—
Utah
—
2
8
—
12
—
0
3
—
3
—
0
2
—
—
Wyoming
—
0
3
—
3
—
0
0
—
—
—
0
0
—
—
Pacific
4
3
11
5
7
1
0
2
2
—
12
55
74
24
103
Alaska
4
2
11
5
7
1
0
1
2
—
—
0
2
—
—
California
N
0
0
N
N
N
0
0
N
N
7
43
62
18
88
Hawaii
—
0
1
—
—
—
0
1
—
—
—
0
3
—
—
Oregon
N
0
0
N
N
N
0
0
N
N
1
4
14
1
2
Washington
N
0
0
N
N
N
0
0
N
N
4
5
11
5
13
Territories
American Samoa
N
0
0
N
N
—
0
0
—
—
—
0
0
—
—
C.N.M.I.
—
—
—
—
—
—
—
—
—
—
—
—
—
—
—
Guam
—
0
0
—
—
—
0
0
—
—
—
0
0
—
—
Puerto Rico
—
0
0
—
—
—
0
0
—
—
4
4
15
4
2
U.S. Virgin Islands
—
0
0
—
—
—
0
0
—
—
—
0
0
—
—
C.N.M.I.: Commonwealth of Northern Mariana Islands.
U: Unavailable. —: No reported cases. N: Not reportable. NN: Not Nationally Notifiable. Cum: Cumulative year-to-date counts. Med: Median. Max: Maximum.
† Includes drug resistant and susceptible cases of invasive Streptococcus pneumoniae disease among children <5 years and among all ages. Case definition: Isolation of S. pneumoniae from a normally sterile body site (e.g., blood or cerebrospinal fluid).
TABLE II. (Continued) Provisional cases of selected notifiable diseases, United States, weeks ending January 14, 2012, and January 15, 2011 (2nd week)*
Reporting area
Varicella (chickenpox)
West Nile virus disease†
Neuroinvasive
Nonneuroinvasive§
Current week
Previous 52 weeks
Cum 2012
Cum 2011
Current week
Previous 52 weeks
Cum 2012
Cum 2011
Current week
Previous 52 weeks
Cum 2012
Cum 2011
Med
Max
Med
Max
Med
Max
United States
130
253
330
247
539
—
0
60
—
—
—
0
31
—
—
New England
4
22
50
8
68
—
0
3
—
—
—
0
1
—
—
Connecticut
—
5
16
—
13
—
0
2
—
—
—
0
1
—
—
Maine
—
4
11
—
14
—
0
0
—
—
—
0
0
—
—
Massachusetts
—
9
18
—
21
—
0
2
—
—
—
0
1
—
—
New Hampshire
—
1
7
—
5
—
0
0
—
—
—
0
0
—
—
Rhode Island
—
0
6
—
1
—
0
1
—
—
—
0
0
—
—
Vermont
4
1
9
8
14
—
0
1
—
—
—
0
0
—
—
Mid. Atlantic
25
19
42
63
45
—
0
11
—
—
—
0
6
—
—
New Jersey
16
0
22
38
—
—
0
1
—
—
—
0
2
—
—
New York (Upstate)
N
0
0
N
N
—
0
5
—
—
—
0
4
—
—
New York City
—
0
0
—
—
—
0
4
—
—
—
0
1
—
—
Pennsylvania
9
19
39
25
45
—
0
2
—
—
—
0
1
—
—
E.N. Central
53
66
114
102
178
—
0
13
—
—
—
0
6
—
—
Illinois
2
17
38
18
29
—
0
6
—
—
—
0
5
—
—
Indiana
4
5
20
14
6
—
0
2
—
—
—
0
1
—
—
Michigan
13
18
44
17
60
—
0
7
—
—
—
0
1
—
—
Ohio
34
21
58
53
83
—
0
3
—
—
—
0
3
—
—
Wisconsin
—
0
1
—
—
—
0
1
—
—
—
0
1
—
—
W.N. Central
—
11
32
1
50
—
0
9
—
—
—
0
7
—
—
Iowa
N
0
0
N
N
—
0
2
—
—
—
0
2
—
—
Kansas
—
7
21
—
24
—
0
1
—
—
—
0
0
—
—
Minnesota
—
0
1
—
—
—
0
1
—
—
—
0
1
—
—
Missouri
—
3
14
—
25
—
0
2
—
—
—
0
2
—
—
Nebraska
—
0
2
—
—
—
0
4
—
—
—
0
3
—
—
North Dakota
—
0
7
—
—
—
0
1
—
—
—
0
1
—
—
South Dakota
—
1
6
1
1
—
0
0
—
—
—
0
1
—
—
S. Atlantic
20
35
66
34
46
—
0
10
—
—
—
0
5
—
—
Delaware
—
0
2
—
1
—
0
1
—
—
—
0
0
—
—
District of Columbia
—
0
2
—
1
—
0
3
—
—
—
0
3
—
—
Florida
20
17
42
28
21
—
0
5
—
—
—
0
2
—
—
Georgia
N
0
0
N
N
—
0
2
—
—
—
0
1
—
—
Maryland
N
0
0
N
N
—
0
5
—
—
—
0
3
—
—
North Carolina
N
0
0
N
N
—
0
1
—
—
—
0
0
—
—
South Carolina
—
0
9
—
—
—
0
0
—
—
—
0
0
—
—
Virginia
—
8
26
6
12
—
0
2
—
—
—
0
0
—
—
West Virginia
—
6
32
—
11
—
0
1
—
—
—
0
0
—
—
E.S. Central
5
5
15
8
16
—
0
11
—
—
—
0
5
—
—
Alabama
3
5
14
6
13
—
0
2
—
—
—
0
0
—
—
Kentucky
N
0
0
N
N
—
0
2
—
—
—
0
1
—
—
Mississippi
2
0
2
2
3
—
0
5
—
—
—
0
4
—
—
Tennessee
N
0
0
N
N
—
0
3
—
—
—
0
1
—
—
W.S. Central
15
50
136
16
35
—
0
4
—
—
—
0
3
—
—
Arkansas
—
5
20
1
2
—
0
1
—
—
—
0
0
—
—
Louisiana
—
1
6
—
2
—
0
1
—
—
—
0
2
—
—
Oklahoma
N
0
0
N
N
—
0
1
—
—
—
0
0
—
—
Texas
15
43
131
15
31
—
0
3
—
—
—
0
3
—
—
Mountain
8
17
65
15
88
—
0
11
—
—
—
0
5
—
—
Arizona
1
4
50
1
34
—
0
6
—
—
—
0
4
—
—
Colorado
6
4
31
13
9
—
0
2
—
—
—
0
2
—
—
Idaho
N
0
0
N
N
—
0
1
—
—
—
0
1
—
—
Montana
—
1
11
—
30
—
0
1
—
—
—
0
0
—
—
Nevada
N
0
0
N
N
—
0
4
—
—
—
0
2
—
—
New Mexico
—
1
4
—
3
—
0
1
—
—
—
0
0
—
—
Utah
—
3
26
—
12
—
0
1
—
—
—
0
1
—
—
Wyoming
1
0
1
1
—
—
0
1
—
—
—
0
1
—
—
Pacific
—
3
9
—
13
—
0
18
—
—
—
0
7
—
—
Alaska
—
1
4
—
6
—
0
0
—
—
—
0
0
—
—
California
—
0
4
—
4
—
0
18
—
—
—
0
7
—
—
Hawaii
—
1
4
—
3
—
0
0
—
—
—
0
0
—
—
Oregon
N
0
0
N
N
—
0
0
—
—
—
0
0
—
—
Washington
N
0
0
N
N
—
0
0
—
—
—
0
0
—
—
Territories
American Samoa
N
0
0
N
N
—
0
0
—
—
—
0
0
—
—
C.N.M.I.
—
—
—
—
—
—
—
—
—
—
—
—
—
—
—
Guam
—
2
4
—
—
—
0
0
—
—
—
0
0
—
—
Puerto Rico
—
3
10
—
8
—
0
0
—
—
—
0
0
—
—
U.S. Virgin Islands
—
0
0
—
—
—
0
0
—
—
—
0
0
—
—
C.N.M.I.: Commonwealth of Northern Mariana Islands.
U: Unavailable. —: No reported cases. N: Not reportable. NN: Not Nationally Notifiable. Cum: Cumulative year-to-date counts. Med: Median. Max: Maximum.
† Updated weekly from reports to the Division of Vector-Borne Infectious Diseases, National Center for Zoonotic, Vector-Borne, and Enteric Diseases (ArboNET Surveillance). Data for California serogroup, eastern equine, Powassan, St. Louis, and western equine diseases are available in Table I.
§ Not reportable in all states. Data from states where the condition is not reportable are excluded from this table, except starting in 2007 for the domestic arboviral diseases and influenza-associated pediatric mortality, and in 2003 for SARS-CoV. Reporting exceptions are available at http://www.cdc.gov/ncphi/disss/nndss/phs/infdis.htm.
TABLE III. Deaths in 122 U.S. cities,* week ending January 14, 2012 (2nd week)
Reporting area
All causes, by age (years)
P&I† Total
Reporting area (Continued)
All causes, by age (years)
P&I† Total
All Ages
=65
45–64
25–44
1–24
<1
All Ages
=65
45–64
25–44
1–24
<1
New England
596
427
122
24
12
11
52
S. Atlantic
1,051
656
280
65
31
19
76
Boston, MA
145
87
40
9
3
6
12
Atlanta, GA
195
114
58
16
4
3
16
Bridgeport, CT
38
31
4
1
2
—
5
Baltimore, MD
174
102
49
15
6
2
13
Cambridge, MA
14
11
3
—
—
—
2
Charlotte, NC
138
89
39
6
3
1
12
Fall River, MA
29
25
3
—
1
—
2
Jacksonville, FL
17
10
5
—
1
1
—
Hartford, CT
53
35
12
2
2
2
10
Miami, FL
51
36
8
4
2
1
4
Lowell, MA
27
22
4
1
—
—
2
Norfolk, VA
55
36
11
3
2
3
1
Lynn, MA
12
12
—
—
—
—
1
Richmond, VA
67
45
15
3
4
—
3
New Bedford, MA
32
26
5
—
1
—
2
Savannah, GA
72
44
22
6
—
—
5
New Haven, CT
25
17
6
1
—
1
2
St. Petersburg, FL
52
36
12
2
2
—
6
Providence, RI
75
54
17
2
—
2
—
Tampa, FL
90
57
24
6
1
2
4
Somerville, MA
4
3
1
—
—
—
—
Washington, D.C.
121
69
36
4
6
6
8
Springfield, MA
47
32
12
2
1
—
—
Wilmington, DE
19
18
1
—
—
—
4
Waterbury, CT
26
21
5
—
—
—
2
E.S. Central
1,017
672
262
47
22
14
81
Worcester, MA
69
51
10
6
2
—
12
Birmingham, AL
164
100
53
7
2
2
16
Mid. Atlantic
1,961
1,370
456
83
29
23
112
Chattanooga, TN
111
77
29
4
—
1
8
Albany, NY
45
39
5
1
—
—
4
Knoxville, TN
117
81
29
3
3
1
10
Allentown, PA
37
26
7
2
1
1
5
Lexington, KY
83
59
16
3
4
1
2
Buffalo, NY
97
64
26
6
—
1
2
Memphis, TN
230
140
63
17
4
6
17
Camden, NJ
23
10
7
4
1
1
2
Mobile, AL
87
63
19
2
2
1
6
Elizabeth, NJ
9
7
2
—
—
—
1
Montgomery, AL
43
31
7
3
—
2
8
Erie, PA
58
40
15
1
1
1
4
Nashville, TN
182
121
46
8
7
—
14
Jersey City, NJ
17
10
7
—
—
—
1
W.S. Central
1,358
886
285
112
48
26
75
New York City, NY
1,091
772
251
44
11
13
50
Austin, TX
91
54
28
5
3
1
2
Newark, NJ
66
30
27
3
3
3
2
Baton Rouge, LA
U
U
U
U
U
U
U
Paterson, NJ
23
14
6
2
—
1
—
Corpus Christi, TX
74
51
12
7
1
3
14
Philadelphia, PA
160
107
40
9
4
—
13
Dallas, TX
222
132
58
18
8
5
11
Pittsburgh, PA§
46
35
8
—
3
—
5
El Paso, TX
118
87
21
4
3
3
1
Reading, PA
46
38
6
—
1
1
3
Fort Worth, TX
U
U
U
U
U
U
U
Rochester, NY
101
70
19
8
4
—
5
Houston, TX
144
73
20
30
17
4
7
Schenectady, NY
18
14
4
—
—
—
2
Little Rock, AR
127
83
30
9
2
3
8
Scranton, PA
32
25
5
1
—
1
3
New Orleans, LA
U
U
U
U
U
U
U
Syracuse, NY
42
31
11
—
—
—
4
San Antonio, TX
327
226
64
25
7
5
13
Trenton, NJ
8
7
1
—
—
—
1
Shreveport, LA
70
48
16
1
3
2
2
Utica, NY
20
15
5
—
—
—
1
Tulsa, OK
185
132
36
13
4
—
17
Yonkers, NY
22
16
4
2
—
—
4
Mountain
1,223
817
299
60
28
19
81
E.N. Central
2,138
1,449
502
112
39
35
158
Albuquerque, NM
110
75
25
5
3
2
9
Akron, OH
37
25
8
2
—
2
4
Boise, ID
44
27
12
3
1
1
3
Canton, OH
33
28
3
1
1
—
5
Colorado Springs, CO
86
60
19
1
4
2
4
Chicago, IL
246
164
68
8
6
—
21
Denver, CO
83
47
24
10
1
1
4
Cincinnati, OH
108
68
22
8
7
3
9
Las Vegas, NV
311
227
64
13
5
2
26
Cleveland, OH
339
240
81
9
4
5
23
Ogden, UT
49
35
8
3
1
2
7
Columbus, OH
172
117
38
14
1
2
11
Phoenix, AZ
182
107
50
13
7
5
6
Dayton, OH
167
122
36
4
—
4
15
Pueblo, CO
43
32
10
1
—
—
3
Detroit, MI
191
106
59
16
7
3
3
Salt Lake City, UT
139
80
47
5
3
4
14
Evansville, IN
54
41
10
2
1
—
2
Tucson, AZ
176
127
40
6
3
—
5
Fort Wayne, IN
79
61
12
4
—
2
11
Pacific
1,901
1,325
418
93
36
28
213
Gary, IN
13
8
4
—
—
1
—
Berkeley, CA
13
11
2
—
—
—
1
Grand Rapids, MI
65
48
12
3
—
2
7
Fresno, CA
156
119
26
8
2
1
28
Indianapolis, IN
195
121
49
16
4
5
12
Glendale, CA
46
35
9
2
—
—
10
Lansing, MI
54
36
13
3
1
1
5
Honolulu, HI
83
57
18
4
2
2
18
Milwaukee, WI
90
60
22
6
1
1
9
Long Beach, CA
78
42
25
8
1
2
10
Peoria, IL
58
34
18
2
2
2
3
Los Angeles, CA
300
181
84
17
11
7
35
Rockford, IL
51
41
5
4
—
1
4
Pasadena, CA
25
20
4
1
—
—
3
South Bend, IN
75
52
15
5
2
1
7
Portland, OR
169
118
39
5
4
3
8
Toledo, OH
111
77
27
5
2
—
7
Sacramento, CA
249
179
54
11
3
2
27
Youngstown, OH
U
U
U
U
U
U
U
San Diego, CA
199
144
38
9
3
4
17
W.N. Central
975
631
235
58
28
20
74
San Francisco, CA
142
102
28
10
—
2
19
Des Moines, IA
208
153
34
13
3
5
13
San Jose, CA
240
174
52
7
3
4
21
Duluth, MN
45
37
6
2
—
—
5
Santa Cruz, CA
42
27
12
1
1
1
5
Kansas City, KS
23
13
6
4
—
—
1
Seattle, WA
U
U
U
U
U
U
U
Kansas City, MO
129
75
38
10
3
3
6
Spokane, WA
64
48
11
4
1
—
6
Lincoln, NE
48
35
11
1
1
—
2
Tacoma, WA
95
68
16
6
5
—
5
Minneapolis, MN
79
58
15
3
2
—
12
Total¶
12,220
8,233
2,859
654
273
195
922
Omaha, NE
121
78
27
8
6
2
14
St. Louis, MO
175
76
66
12
10
9
9
St. Paul, MN
56
42
10
2
1
1
3
Wichita, KS
91
64
22
3
2
—
9
U: Unavailable. —: No reported cases.
* Mortality data in this table are voluntarily reported from 122 cities in the United States, most of which have populations of >100,000. A death is reported by the place of its occurrence and by the week that the death certificate was filed. Fetal deaths are not included.
† Pneumonia and influenza.
§ Because of changes in reporting methods in this Pennsylvania city, these numbers are partial counts for the current week. Complete counts will be available in 4 to 6 weeks.