Persons using assistive technology might not be able to fully access information in this file. For assistance, please send e-mail to: mmwrq@cdc.gov. Type 508 Accommodation and the title of the report in the subject line of e-mail.
Notifiable Diseases and Mortality Tables
Table I Summary of provisional cases of selected notifiable diseases, United States, cumulative, week ending January 7, 2012 (1st Week)
Figure I Selected notifiable disease reports, United States, comparison of provisional 4-week totals ending January 7, 2012, with historical data
Table II Provisional cases of selected notifiable diseases, United States, weeks ending January 7, 2012 and January 8, 2011 (1st Week)
Table III Deaths in 122 U.S. cities, week ending January 7, 2012 (1st Week)
Table IV Provisional cases of selected notifiable disease, United States, 4th quarter ending December 31, 2011 (52nd week)
TABLE I. Provisional cases of infrequently reported notifiable diseases (<1,000 cases reported during the preceding year) — United States, week ending January 7, 2012 (1st week)*
TABLE I. (Continued) Provisional cases of infrequently reported notifiable diseases (<1,000 cases reported during the preceding year) — United States, week ending January 7, 2012 (1st week)*
—: No reported cases. N: Not reportable. NN: Not Nationally Notifiable. Cum: Cumulative year-to-date counts.
§ Not reportable in all states. Data from states where the condition is not reportable are excluded from this table except starting in 2007 for the arboviral diseases, STD data, TB data, and influenza-associated pediatric mortality, and in 2003 for SARS-CoV. Reporting exceptions are available at http://www.cdc.gov/osels/ph_surveillance/nndss/phs/infdis.htm.
¶ Includes both neuroinvasive and nonneuroinvasive. Updated weekly from reports to the Division of Vector-Borne Infectious Diseases, National Center for Zoonotic, Vector-Borne, and Enteric Diseases (ArboNET Surveillance). Data for West Nile virus are available in Table II.
** Data for H. influenzae (all ages, all serotypes) are available in Table II.
†† Updated weekly from reports to the Influenza Division, National Center for Immunization and Respiratory Diseases. Since October 2, 2011, no influenza-associated pediatric deaths occurring during the 2011-12 influenza season have been reported.
§§ No measles cases were reported for the current week.
¶¶ Data for meningococcal disease (all serogroups) are available in Table II.
*** CDC discontinued reporting of individual confirmed and probable cases of 2009 pandemic influenza A (H1N1) virus infections on July 24, 2009. During 2009, four cases of human infection with novel influenza A viruses, different from the 2009 pandemic influenza A (H1N1) strain, were reported to CDC. The four cases of novel influenza A virus infection reported to CDC during 2010, and the eight cases reported during 2011, were identified as swine influenza A (H3N2) virus and are unrelated to the 2009 pandemic influenza A (H1N1) virus. Total case counts are provided by the Influenza Division, National Center for Immunization and Respiratory Diseases (NCIRD).
††† No rubella cases were reported for the current week.
§§§ Updated weekly from reports to the Division of STD Prevention, National Center for HIV/AIDS, Viral Hepatitis, STD, and TB Prevention.
¶¶¶ There were no cases of viral hemorrhagic fever reported during the current week. See Table II for dengue hemorrhagic fever.
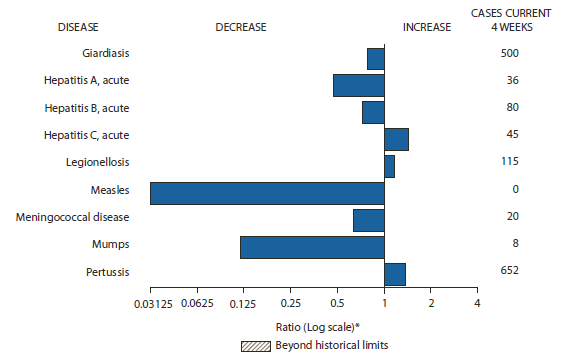
FIGURE I. Selected notifiable disease reports, United States, comparison of provisional 4-week totals January 7, 2012, with historical data
* No measles cases were reported for the current 4-week period yielding a ratio for week 1 of zero (0).
† Ratio of current 4-week total to mean of 15 4-week totals (from previous, comparable, and subsequent 4-week periods for the past 5 years). The point where the hatched area begins is based on the mean and two standard deviations of these 4-week totals.
Alternate Text: The figure above shows selected notifiable disease reports with comparison of provisional 4-week totals through January 7, 2012, with historical data. Reports of acute hepatitis C, legionellosis, and pertussis all increased. Reports of giardiasis, acute hepatitis A, acute hepatitis B, measles, meningococcal disease, and mumps all decreased.
TABLE II. Provisional cases of selected notifiable diseases, United States, weeks ending January 7, 2012, and January 8, 2011 (1st week)*
Reporting area
Chlamydia trachomatis infection
Coccidioidomycosis
Cryptosporidiosis
Current week
Previous 52 weeks
Cum 2012
Cum 2011
Current week
Previous 52 weeks
Cum 2012
Cum 2011
Current week
Previous 52 weeks
Cum 2012
Cum 2011
Med
Max
Med
Max
Med
Max
United States
6,839
26,636
30,779
6,839
24,829
73
385
585
73
439
35
129
394
35
99
New England
—
868
1,594
—
591
—
0
1
—
—
—
7
22
—
9
Connecticut
—
227
474
—
10
—
0
0
—
—
—
1
9
—
3
Maine
—
59
99
—
62
—
0
0
—
—
—
1
4
—
—
Massachusetts
—
427
860
—
409
—
0
0
—
—
—
3
8
—
5
New Hampshire
—
56
90
—
33
—
0
1
—
—
—
1
5
—
1
Rhode Island
—
79
170
—
48
—
0
0
—
—
—
0
1
—
—
Vermont
—
27
84
—
29
—
0
0
—
—
—
1
5
—
—
Mid. Atlantic
681
3,216
3,954
681
2,575
—
0
1
—
—
2
15
42
2
6
New Jersey
93
540
1,004
93
351
—
0
0
—
—
—
0
0
—
—
New York (Upstate)
171
715
1,058
171
278
—
0
0
—
—
—
4
16
—
—
New York City
—
1,094
1,315
—
1,190
—
0
0
—
—
—
1
6
—
1
Pennsylvania
417
984
1,236
417
756
—
0
1
—
—
2
9
26
2
5
E.N. Central
712
4,093
5,187
712
5,187
—
1
5
—
—
15
32
146
15
36
Illinois
19
1,129
1,343
19
1,237
—
0
0
—
—
—
3
26
—
6
Indiana
147
543
1,405
147
1,405
—
0
0
—
—
—
3
14
—
6
Michigan
300
956
1,429
300
1,048
—
0
3
—
—
1
6
14
1
6
Ohio
127
1,009
1,124
127
1,062
—
0
3
—
—
12
11
95
12
12
Wisconsin
119
468
553
119
435
—
0
0
—
—
2
8
64
2
6
W.N. Central
20
1,494
1,808
20
1,547
—
0
2
—
—
2
16
87
2
10
Iowa
10
212
253
10
238
—
0
0
—
—
—
6
19
—
2
Kansas
—
210
288
—
228
—
0
0
—
—
—
0
11
—
—
Minnesota
—
312
396
—
373
—
0
0
—
—
—
0
0
—
—
Missouri
—
539
759
—
501
—
0
0
—
—
1
5
63
1
2
Nebraska
—
119
215
—
92
—
0
2
—
—
1
2
12
1
4
North Dakota
—
39
64
—
22
—
0
0
—
—
—
0
12
—
—
South Dakota
10
63
93
10
93
—
0
0
—
—
—
2
13
—
2
S. Atlantic
3,688
5,381
7,387
3,688
5,251
—
0
2
—
—
11
21
41
11
22
Delaware
28
86
182
28
83
—
0
0
—
—
—
0
1
—
—
District of Columbia
130
109
190
130
119
—
0
0
—
—
—
0
1
—
—
Florida
618
1,500
1,697
618
1,399
—
0
0
—
—
4
8
17
4
7
Georgia
543
1,013
1,569
543
718
—
0
0
—
—
—
5
11
—
2
Maryland
—
468
790
—
254
—
0
2
—
—
6
1
6
6
—
North Carolina
1,509
997
1,688
1,509
1,369
—
0
0
—
—
—
0
25
—
—
South Carolina
—
530
1,337
—
328
—
0
0
—
—
1
2
8
1
8
Virginia
813
662
1,575
813
860
—
0
1
—
—
—
2
8
—
5
West Virginia
47
82
121
47
121
—
0
0
—
—
—
0
5
—
—
E.S. Central
292
1,881
2,804
292
1,387
—
0
0
—
—
2
7
25
2
2
Alabama
—
549
1,566
—
552
—
0
0
—
—
—
2
7
—
1
Kentucky
98
299
557
98
—
—
0
0
—
—
—
1
17
—
1
Mississippi
—
398
696
—
227
—
0
0
—
—
—
1
4
—
—
Tennessee
194
600
751
194
608
—
0
0
—
—
2
2
6
2
—
W.S. Central
131
3,372
4,327
131
2,812
—
0
1
—
—
—
8
43
—
—
Arkansas
—
309
440
—
335
—
0
0
—
—
—
0
2
—
—
Louisiana
113
377
1,071
113
262
—
0
1
—
—
—
0
9
—
—
Oklahoma
18
153
676
18
29
—
0
0
—
—
—
2
6
—
—
Texas
—
2,419
3,129
—
2,186
—
0
0
—
—
—
5
39
—
—
Mountain
432
1,753
2,344
432
1,347
39
305
459
39
321
1
10
30
1
8
Arizona
409
548
782
409
464
39
300
456
39
315
—
1
4
—
—
Colorado
—
421
847
—
275
—
0
0
—
—
—
3
12
—
1
Idaho
—
82
235
—
53
—
0
0
—
—
—
1
9
—
3
Montana
—
66
88
—
67
—
0
2
—
—
—
1
6
—
1
Nevada
—
205
380
—
203
—
2
5
—
4
1
0
2
1
1
New Mexico
—
199
481
—
141
—
0
4
—
—
—
3
9
—
1
Utah
23
132
190
23
114
—
0
4
—
2
—
1
5
—
1
Wyoming
—
34
67
—
30
—
0
2
—
—
—
0
5
—
—
Pacific
883
3,957
5,412
883
4,132
34
90
145
34
118
2
10
21
2
6
Alaska
71
110
157
71
129
—
0
0
—
—
—
0
3
—
—
California
283
2,983
4,482
283
3,217
34
89
145
34
118
2
6
15
2
2
Hawaii
—
114
141
—
102
—
0
0
—
—
—
0
1
—
—
Oregon
246
273
412
246
268
—
0
1
—
—
—
2
8
—
4
Washington
283
431
672
283
416
—
0
0
—
—
—
1
6
—
—
Territories
American Samoa
—
0
0
—
—
—
0
0
—
—
N
0
0
N
N
C.N.M.I.
—
—
—
—
—
—
—
—
—
—
—
—
—
—
—
Guam
—
14
44
—
—
—
0
0
—
—
—
0
0
—
—
Puerto Rico
—
108
349
—
113
—
0
0
—
—
N
0
0
N
N
U.S. Virgin Islands
—
17
27
—
—
—
0
0
—
—
—
0
0
—
—
C.N.M.I.: Commonwealth of Northern Mariana Islands.
U: Unavailable. —: No reported cases. N: Not reportable. NN: Not Nationally Notifiable. Cum: Cumulative year-to-date counts. Med: Median. Max: Maximum.
† Data for meningococcal disease, invasive caused by serogroups A, C, Y, and W-135; serogroup B; other serogroup; and unknown serogroup are available in Table I.
TABLE II. (Continued) Provisional cases of selected notifiable diseases, United States, weeks ending January 7, 2012, and January 8, 2011 (1st week)*
Reporting area
Rabies, animal
Salmonellosis
Shiga toxin-producing E. coli(STEC)†
Current week
Previous 52 weeks
Cum 2012
Cum 2011
Current week
Previous 52 weeks
Cum 2012
Cum 2011
Current week
Previous 52 weeks
Cum 2012
Cum 2011
Med
Max
Med
Max
Med
Max
United States
6
58
113
6
24
156
835
1,824
156
455
10
84
203
10
52
New England
3
4
16
3
2
3
37
107
3
22
—
3
13
—
1
Connecticut
—
2
10
—
1
—
8
30
—
3
—
1
4
—
1
Maine
3
1
6
3
1
2
2
8
2
—
—
0
3
—
—
Massachusetts
—
0
0
—
—
—
19
44
—
12
—
1
9
—
—
New Hampshire
—
0
3
—
—
—
3
8
—
3
—
0
3
—
—
Rhode Island
—
0
6
—
—
—
1
62
—
1
—
0
2
—
—
Vermont
—
0
2
—
—
1
1
8
1
3
—
0
3
—
—
Mid. Atlantic
1
15
35
1
13
10
71
171
10
35
—
8
30
—
3
New Jersey
—
0
0
—
—
—
0
3
—
—
—
0
0
—
—
New York (Upstate)
1
7
20
1
8
2
26
67
2
3
—
3
13
—
—
New York City
—
0
3
—
—
1
19
42
1
10
—
1
6
—
—
Pennsylvania
—
8
21
—
5
7
31
112
7
22
—
3
18
—
3
E.N. Central
—
2
17
—
1
9
84
162
9
67
—
14
51
—
9
Illinois
—
0
6
—
1
—
27
80
—
32
—
3
14
—
2
Indiana
—
0
7
—
—
—
7
24
—
—
—
1
10
—
4
Michigan
—
1
6
—
—
1
14
42
1
12
—
3
19
—
1
Ohio
—
1
5
—
—
8
21
46
8
18
—
3
10
—
1
Wisconsin
N
0
0
N
N
—
6
45
—
5
—
2
21
—
1
W.N. Central
—
1
7
—
—
6
40
103
6
27
2
11
40
2
3
Iowa
—
0
0
—
—
—
9
19
—
9
—
2
15
—
—
Kansas
—
0
4
—
—
—
8
27
—
3
—
2
8
—
—
Minnesota
—
0
0
—
—
—
0
0
—
—
—
0
0
—
—
Missouri
—
0
1
—
—
4
16
46
4
11
2
5
32
2
—
Nebraska
—
0
3
—
—
2
4
13
2
4
—
1
7
—
3
North Dakota
—
0
3
—
—
—
0
15
—
—
—
0
4
—
—
South Dakota
—
0
0
—
—
—
3
10
—
—
—
1
4
—
—
S. Atlantic
2
19
93
2
8
72
252
724
72
132
6
12
28
6
10
Delaware
—
0
0
—
—
2
3
11
2
2
—
0
2
—
—
District of Columbia
—
0
0
—
—
—
1
6
—
—
—
0
1
—
—
Florida
2
0
84
2
—
46
107
203
46
48
—
3
9
—
2
Georgia
—
0
0
—
—
8
40
128
8
27
—
2
8
—
3
Maryland
—
6
13
—
—
8
18
42
8
8
1
1
3
1
2
North Carolina
—
0
0
—
—
—
30
251
—
22
—
2
11
—
—
South Carolina
N
0
0
N
N
2
26
70
2
7
—
0
4
—
—
Virginia
—
11
27
—
8
6
20
52
6
18
5
3
9
5
3
West Virginia
—
0
30
—
—
—
0
18
—
—
—
0
1
—
—
E.S. Central
—
3
11
—
—
14
64
190
14
45
1
5
18
1
5
Alabama
—
2
7
—
—
7
20
70
7
20
1
0
15
1
2
Kentucky
—
0
2
—
—
—
11
30
—
5
—
1
5
—
—
Mississippi
—
0
1
—
—
6
22
66
6
8
—
0
4
—
—
Tennessee
—
1
6
—
—
1
16
52
1
12
—
1
11
—
3
W.S. Central
—
0
21
—
—
6
120
250
6
23
—
9
33
—
—
Arkansas
—
0
10
—
—
2
13
52
2
2
—
1
6
—
—
Louisiana
—
0
0
—
—
1
14
44
1
13
—
0
1
—
—
Oklahoma
—
0
21
—
—
1
12
31
1
1
—
1
10
—
—
Texas
—
0
0
—
—
2
81
156
2
7
—
6
33
—
—
Mountain
—
0
4
—
—
10
46
93
10
42
1
10
26
1
6
Arizona
N
0
0
N
N
5
15
34
5
11
—
1
7
—
1
Colorado
—
0
0
—
—
—
10
24
—
14
—
2
7
—
3
Idaho
—
0
1
—
—
—
3
8
—
3
1
2
8
1
2
Montana
N
0
0
N
N
3
2
10
3
—
—
0
5
—
—
Nevada
—
0
2
—
—
—
3
7
—
5
—
0
7
—
—
New Mexico
—
0
2
—
—
1
6
22
1
5
—
1
3
—
—
Utah
—
0
2
—
—
1
6
15
1
4
—
1
7
—
—
Wyoming
—
0
0
—
—
—
1
9
—
—
—
0
7
—
—
Pacific
—
4
13
—
—
26
91
175
26
62
—
15
34
—
15
Alaska
—
0
2
—
—
—
1
6
—
1
—
0
1
—
—
California
—
3
12
—
—
22
73
142
22
46
—
9
19
—
13
Hawaii
—
0
0
—
—
2
7
14
2
9
—
0
2
—
—
Oregon
—
0
1
—
—
2
5
12
2
6
—
1
11
—
2
Washington
—
0
0
—
—
—
9
30
—
—
—
2
13
—
—
Territories
American Samoa
N
0
0
N
N
—
0
0
—
—
—
0
0
—
—
C.N.M.I.
—
—
—
—
—
—
—
—
—
—
—
—
—
—
—
Guam
—
0
0
—
—
—
0
3
—
—
—
0
0
—
—
Puerto Rico
—
0
6
—
—
—
3
12
—
1
—
0
0
—
—
U.S. Virgin Islands
—
0
0
—
—
—
0
0
—
—
—
0
0
—
—
C.N.M.I.: Commonwealth of Northern Mariana Islands.
U: Unavailable. —: No reported cases. N: Not reportable. NN: Not Nationally Notifiable. Cum: Cumulative year-to-date counts. Med: Median. Max: Maximum.
† Illnesses with similar clinical presentation that result from Spotted fever group rickettsia infections are reported as Spotted fever rickettsioses. Rocky Mountain spotted fever (RMSF) caused by Rickettsia rickettsii, is the most common and well-known spotted fever.
TABLE II. (Continued) Provisional cases of selected notifiable diseases, United States, weeks ending January 7, 2012, and January 8, 2011 (1st week)*
Reporting area
Streptococcus pneumoniae,† invasive disease
Syphilis, primary and secondary
All ages
Age <5
Current week
Previous 52 weeks
Cum 2012
Cum 2011
Current week
Previous 52 weeks
Cum 2012
Cum 2011
Current week
Previous 52 weeks
Cum 2012
Cum 2011
Med
Max
Med
Max
Med
Max
United States
161
247
464
161
437
11
20
41
11
21
25
263
316
25
240
New England
6
12
31
6
25
—
1
4
—
—
—
7
21
—
13
Connecticut
—
5
20
—
15
—
0
2
—
—
—
0
12
—
—
Maine
4
2
8
4
1
—
0
1
—
—
—
0
2
—
1
Massachusetts
—
0
3
—
1
—
0
2
—
—
—
5
10
—
9
New Hampshire
—
1
8
—
4
—
0
1
—
—
—
0
3
—
—
Rhode Island
—
1
6
—
4
—
0
1
—
—
—
0
7
—
3
Vermont
2
1
6
2
—
—
0
2
—
—
—
0
2
—
—
Mid. Atlantic
14
15
47
14
34
—
1
9
—
—
3
30
53
3
41
New Jersey
2
0
6
2
—
—
0
0
—
—
—
4
13
—
3
New York (Upstate)
5
1
30
5
1
—
1
6
—
—
1
4
9
1
3
New York City
7
12
33
7
33
—
0
9
—
—
—
14
30
—
30
Pennsylvania
N
0
0
N
N
N
0
0
N
N
2
6
16
2
5
E.N. Central
53
61
123
53
100
3
3
10
3
3
—
30
47
—
27
Illinois
N
0
0
N
N
—
0
0
—
—
—
11
24
—
14
Indiana
—
14
36
—
23
—
1
4
—
1
—
3
8
—
3
Michigan
6
13
26
6
22
—
0
3
—
1
—
5
12
—
7
Ohio
41
27
44
41
44
3
2
7
3
1
—
8
17
—
3
Wisconsin
6
8
24
6
11
—
0
3
—
—
—
1
5
—
—
W.N. Central
5
2
28
5
4
—
0
2
—
1
—
6
13
—
9
Iowa
N
0
0
N
N
N
0
0
N
N
—
0
3
—
—
Kansas
N
0
0
N
N
N
0
0
N
N
—
0
4
—
—
Minnesota
—
0
0
—
—
—
0
0
—
—
—
2
8
—
6
Missouri
N
0
0
N
N
—
0
0
—
—
—
2
6
—
3
Nebraska
5
2
9
5
4
—
0
2
—
1
—
0
2
—
—
North Dakota
—
0
25
—
—
—
0
1
—
—
—
0
1
—
—
South Dakota
N
0
0
N
N
—
0
0
—
—
—
0
0
—
—
S. Atlantic
58
65
157
58
145
4
6
15
4
8
18
68
100
18
55
Delaware
1
1
5
1
3
—
0
0
—
—
—
0
4
—
—
District of Columbia
—
1
5
—
—
—
0
1
—
—
2
3
8
2
3
Florida
24
21
64
24
64
2
3
8
2
3
1
23
36
1
28
Georgia
14
19
44
14
44
2
2
5
2
3
4
14
31
4
4
Maryland
9
9
33
9
25
—
1
3
—
2
—
8
20
—
3
North Carolina
N
0
0
N
N
N
0
0
N
N
9
8
21
9
9
South Carolina
10
8
25
10
9
—
0
3
—
—
—
4
11
—
4
Virginia
N
0
0
N
N
—
0
0
—
—
2
4
12
2
4
West Virginia
—
0
48
—
—
—
0
4
—
—
—
0
1
—
—
E.S. Central
10
22
45
10
44
2
2
6
2
6
1
13
29
1
10
Alabama
N
0
0
N
N
N
0
0
N
N
—
4
11
—
4
Kentucky
—
4
12
—
11
—
0
3
—
3
—
2
8
—
—
Mississippi
N
0
0
N
N
—
0
0
—
—
—
3
14
—
—
Tennessee
10
18
37
10
33
2
1
4
2
3
1
5
11
1
6
W.S. Central
3
31
79
3
14
—
3
10
—
—
2
36
50
2
31
Arkansas
1
4
14
1
1
—
0
4
—
—
—
4
10
—
2
Louisiana
1
2
11
1
8
—
0
2
—
—
2
7
25
2
—
Oklahoma
N
0
0
N
N
—
0
0
—
—
—
1
6
—
—
Texas
1
24
75
1
5
—
2
9
—
—
—
23
37
—
29
Mountain
11
26
72
11
67
1
2
8
1
3
—
12
20
—
10
Arizona
10
11
45
10
33
—
1
5
—
1
—
4
10
—
4
Colorado
—
8
23
—
21
—
0
4
—
—
—
2
6
—
1
Idaho
N
0
0
N
N
—
0
0
—
—
—
0
4
—
—
Montana
N
0
0
N
N
N
0
0
N
N
—
0
1
—
1
Nevada
N
0
0
N
N
N
0
0
N
N
—
2
9
—
4
New Mexico
1
4
12
1
6
1
0
2
1
—
—
1
4
—
—
Utah
—
1
8
—
6
—
0
3
—
2
—
0
2
—
—
Wyoming
—
0
3
—
1
—
0
0
—
—
—
0
0
—
—
Pacific
1
3
11
1
4
1
0
2
1
—
1
53
74
1
44
Alaska
1
2
11
1
4
1
0
1
1
—
—
0
2
—
—
California
N
0
0
N
N
N
0
0
N
N
—
42
62
—
39
Hawaii
—
0
1
—
—
—
0
1
—
—
—
0
3
—
—
Oregon
N
0
0
N
N
N
0
0
N
N
—
4
14
—
1
Washington
N
0
0
N
N
N
0
0
N
N
1
5
11
1
4
Territories
American Samoa
N
0
0
N
N
—
0
0
—
—
—
0
0
—
—
C.N.M.I.
—
—
—
—
—
—
—
—
—
—
—
—
—
—
—
Guam
—
0
0
—
—
—
0
0
—
—
—
0
0
—
—
Puerto Rico
—
0
0
—
—
—
0
0
—
—
—
4
14
—
2
U.S. Virgin Islands
—
0
0
—
—
—
0
0
—
—
—
0
0
—
—
C.N.M.I.: Commonwealth of Northern Mariana Islands.
U: Unavailable. —: No reported cases. N: Not reportable. NN: Not Nationally Notifiable. Cum: Cumulative year-to-date counts. Med: Median. Max: Maximum.
† Includes drug resistant and susceptible cases of invasive Streptococcus pneumoniae disease among children <5 years and among all ages. Case definition: Isolation of S. pneumoniae from a normally sterile body site (e.g., blood or cerebrospinal fluid).
TABLE II. (Continued) Provisional cases of selected notifiable diseases, United States, weeks ending January 7, 2012, and January 8, 2011 (1st week)*
Reporting area
Varicella (chickenpox)
West Nile virus disease†
Neuroinvasive
Nonneuroinvasive§
Current week
Previous 52 weeks
Cum 2012
Cum 2011
Current week
Previous 52 weeks
Cum 2012
Cum 2011
Current week
Previous 52 weeks
Cum 2012
Cum 2011
Med
Max
Med
Max
Med
Max
United States
77
253
330
77
258
—
0
59
—
—
—
0
31
—
—
New England
4
23
50
4
39
—
0
3
—
—
—
0
1
—
—
Connecticut
—
5
16
—
7
—
0
2
—
—
—
0
1
—
—
Maine
—
4
11
—
9
—
0
0
—
—
—
0
0
—
—
Massachusetts
—
9
18
—
11
—
0
2
—
—
—
0
1
—
—
New Hampshire
—
1
7
—
4
—
0
0
—
—
—
0
0
—
—
Rhode Island
—
0
6
—
1
—
0
1
—
—
—
0
0
—
—
Vermont
4
1
9
4
7
—
0
1
—
—
—
0
0
—
—
Mid. Atlantic
21
19
42
21
22
—
0
11
—
—
—
0
6
—
—
New Jersey
6
0
22
6
—
—
0
1
—
—
—
0
2
—
—
New York (Upstate)
N
0
0
N
N
—
0
5
—
—
—
0
4
—
—
New York City
—
0
0
—
—
—
0
4
—
—
—
0
1
—
—
Pennsylvania
15
19
39
15
22
—
0
2
—
—
—
0
1
—
—
E.N. Central
34
66
110
34
68
—
0
13
—
—
—
0
6
—
—
Illinois
4
17
33
4
14
—
0
6
—
—
—
0
5
—
—
Indiana
9
5
20
9
6
—
0
2
—
—
—
0
1
—
—
Michigan
2
19
44
2
23
—
0
7
—
—
—
0
1
—
—
Ohio
19
21
58
19
25
—
0
3
—
—
—
0
3
—
—
Wisconsin
—
0
1
—
—
—
0
1
—
—
—
0
1
—
—
W.N. Central
1
12
34
1
34
—
0
9
—
—
—
0
7
—
—
Iowa
N
0
0
N
N
—
0
2
—
—
—
0
2
—
—
Kansas
—
7
21
—
11
—
0
1
—
—
—
0
0
—
—
Minnesota
—
0
1
—
—
—
0
1
—
—
—
0
1
—
—
Missouri
—
3
23
—
23
—
0
2
—
—
—
0
2
—
—
Nebraska
—
0
2
—
—
—
0
4
—
—
—
0
3
—
—
North Dakota
—
0
7
—
—
—
0
1
—
—
—
0
1
—
—
South Dakota
1
1
6
1
—
—
0
0
—
—
—
0
1
—
—
S. Atlantic
8
32
66
8
16
—
0
10
—
—
—
0
5
—
—
Delaware
—
0
2
—
—
—
0
1
—
—
—
0
0
—
—
District of Columbia
—
0
2
—
—
—
0
3
—
—
—
0
3
—
—
Florida
8
17
42
8
4
—
0
5
—
—
—
0
2
—
—
Georgia
N
0
0
N
N
—
0
2
—
—
—
0
1
—
—
Maryland
N
0
0
N
N
—
0
5
—
—
—
0
3
—
—
North Carolina
N
0
0
N
N
—
0
1
—
—
—
0
0
—
—
South Carolina
—
0
9
—
—
—
0
0
—
—
—
0
0
—
—
Virginia
—
8
26
—
5
—
0
2
—
—
—
0
0
—
—
West Virginia
—
6
32
—
7
—
0
1
—
—
—
0
0
—
—
E.S. Central
2
5
15
2
10
—
0
11
—
—
—
0
5
—
—
Alabama
2
5
14
2
9
—
0
2
—
—
—
0
0
—
—
Kentucky
N
0
0
N
N
—
0
2
—
—
—
0
1
—
—
Mississippi
—
0
2
—
1
—
0
5
—
—
—
0
4
—
—
Tennessee
N
0
0
N
N
—
0
3
—
—
—
0
1
—
—
W.S. Central
—
50
136
—
12
—
0
4
—
—
—
0
3
—
—
Arkansas
—
5
20
—
1
—
0
1
—
—
—
0
0
—
—
Louisiana
—
1
6
—
2
—
0
1
—
—
—
0
2
—
—
Oklahoma
N
0
0
N
N
—
0
1
—
—
—
0
0
—
—
Texas
—
43
131
—
9
—
0
3
—
—
—
0
3
—
—
Mountain
7
18
65
7
52
—
0
10
—
—
—
0
5
—
—
Arizona
—
4
50
—
13
—
0
6
—
—
—
0
4
—
—
Colorado
7
4
31
7
6
—
0
2
—
—
—
0
2
—
—
Idaho
N
0
0
N
N
—
0
1
—
—
—
0
1
—
—
Montana
—
2
28
—
28
—
0
1
—
—
—
0
0
—
—
Nevada
N
0
0
N
N
—
0
4
—
—
—
0
2
—
—
New Mexico
—
1
4
—
2
—
0
1
—
—
—
0
0
—
—
Utah
—
3
26
—
3
—
0
1
—
—
—
0
1
—
—
Wyoming
—
0
1
—
—
—
0
1
—
—
—
0
1
—
—
Pacific
—
3
9
—
5
—
0
18
—
—
—
0
7
—
—
Alaska
—
1
4
—
3
—
0
0
—
—
—
0
0
—
—
California
—
0
4
—
1
—
0
18
—
—
—
0
7
—
—
Hawaii
—
1
4
—
1
—
0
0
—
—
—
0
0
—
—
Oregon
N
0
0
N
N
—
0
0
—
—
—
0
0
—
—
Washington
N
0
0
N
N
—
0
0
—
—
—
0
0
—
—
Territories
American Samoa
N
0
0
N
N
—
0
0
—
—
—
0
0
—
—
C.N.M.I.
—
—
—
—
—
—
—
—
—
—
—
—
—
—
—
Guam
—
2
4
—
—
—
0
0
—
—
—
0
0
—
—
Puerto Rico
—
3
10
—
—
—
0
0
—
—
—
0
0
—
—
U.S. Virgin Islands
—
0
0
—
—
—
0
0
—
—
—
0
0
—
—
C.N.M.I.: Commonwealth of Northern Mariana Islands.
U: Unavailable. —: No reported cases. N: Not reportable. NN: Not Nationally Notifiable. Cum: Cumulative year-to-date counts. Med: Median. Max: Maximum.
† Updated weekly from reports to the Division of Vector-Borne Infectious Diseases, National Center for Zoonotic, Vector-Borne, and Enteric Diseases (ArboNET Surveillance). Data for California serogroup, eastern equine, Powassan, St. Louis, and western equine diseases are available in Table I.
§ Not reportable in all states. Data from states where the condition is not reportable are excluded from this table, except starting in 2007 for the domestic arboviral diseases and influenza-associated pediatric mortality, and in 2003 for SARS-CoV. Reporting exceptions are available at http://www.cdc.gov/ncphi/disss/nndss/phs/infdis.htm.
TABLE III. Deaths in 122 U.S. cities,* week ending January 7, 2012 (1st week)
Reporting area
All causes, by age (years)
P&I† Total
Reporting area (Continued)
All causes, by age (years)
P&I† Total
All Ages
=65
45–64
25–44
1–24
<1
All Ages
=65
45–64
25–44
1–24
<1
New England
501
374
98
18
5
6
46
S. Atlantic
1,040
674
253
60
20
22
68
Boston, MA
137
95
31
3
5
3
10
Atlanta, GA
140
81
40
12
4
3
10
Bridgeport, CT
28
21
5
1
—
1
4
Baltimore, MD
134
80
35
13
3
2
8
Cambridge, MA
16
15
—
1
—
—
2
Charlotte, NC
100
71
19
7
—
3
4
Fall River, MA
23
18
5
—
—
—
2
Jacksonville, FL
13
7
4
2
—
—
2
Hartford, CT
32
25
7
—
—
—
1
Miami, FL
94
60
25
4
3
2
4
Lowell, MA
25
21
4
—
—
—
—
Norfolk, VA
53
30
14
2
5
2
4
Lynn, MA
6
3
3
—
—
—
1
Richmond, VA
68
43
18
5
2
—
6
New Bedford, MA
34
24
5
4
—
1
3
Savannah, GA
66
49
12
3
—
2
6
New Haven, CT
19
12
7
—
—
—
4
St. Petersburg, FL
49
37
2
—
—
—
3
Providence, RI
64
51
9
3
—
1
3
Tampa, FL
199
141
45
9
1
3
14
Somerville, MA
—
—
—
—
—
—
—
Washington, D.C.
109
65
34
3
2
5
6
Springfield, MA
32
23
4
5
—
—
3
Wilmington, DE
15
10
5
—
—
—
1
Waterbury, CT
26
22
4
—
—
—
1
E.S. Central
798
537
200
42
8
11
76
Worcester, MA
59
44
14
1
—
—
12
Birmingham, AL
155
97
45
10
1
2
18
Mid. Atlantic
1,854
1,301
406
94
34
19
83
Chattanooga, TN
72
50
19
2
1
—
6
Albany, NY
54
37
11
4
1
1
1
Knoxville, TN
88
67
19
2
—
—
15
Allentown, PA
16
12
4
—
—
—
1
Lexington, KY
77
48
21
4
—
4
5
Buffalo, NY
90
65
20
4
—
1
9
Memphis, TN
151
99
38
9
2
3
20
Camden, NJ
26
9
12
2
2
1
3
Mobile, AL
79
57
14
5
2
1
2
Elizabeth, NJ
7
4
3
—
—
—
—
Montgomery, AL
41
31
9
1
—
—
5
Erie, PA
48
33
11
4
—
—
2
Nashville, TN
135
88
35
9
2
1
5
Jersey City, NJ
27
18
8
—
1
—
3
W.S. Central
1,224
818
260
86
40
20
80
New York City, NY
1,074
777
222
49
15
11
34
Austin, TX
89
57
20
8
3
1
11
Newark, NJ
26
8
14
1
3
—
—
Baton Rouge, LA
55
37
13
2
3
—
—
Paterson, NJ
21
10
9
2
—
—
—
Corpus Christi, TX
69
48
13
7
1
—
7
Philadelphia, PA
111
66
29
10
4
2
3
Dallas, TX
234
140
63
18
7
6
13
Pittsburgh, PA§
27
19
7
—
1
—
1
El Paso, TX
131
95
25
6
2
3
2
Reading, PA
29
24
2
3
—
—
5
Fort Worth, TX
U
U
U
U
U
U
U
Rochester, NY
75
46
20
5
1
3
5
Houston, TX
92
60
7
9
10
6
3
Schenectady, NY
24
20
3
1
—
—
2
Little Rock, AR
70
43
14
5
5
3
3
Scranton, PA
34
26
7
—
1
—
1
New Orleans, LA
U
U
U
U
U
U
U
Syracuse, NY
97
81
14
—
2
—
10
San Antonio, TX
303
209
64
22
8
—
30
Trenton, NJ
37
23
6
5
3
—
1
Shreveport, LA
69
52
13
2
1
1
3
Utica, NY
18
14
3
1
—
—
2
Tulsa, OK
112
77
28
7
—
—
8
Yonkers, NY
13
9
1
3
—
—
—
Mountain
1,132
800
229
59
26
16
67
E.N. Central
1,946
1,325
440
110
37
31
140
Albuquerque, NM
115
82
24
6
2
1
5
Akron, OH
50
37
12
—
—
1
5
Boise, ID
57
44
9
3
—
1
7
Canton, OH
40
31
7
1
—
1
6
Colorado Springs, CO
92
66
15
4
4
3
2
Chicago, IL
241
155
65
12
8
1
19
Denver, CO
82
51
26
3
2
—
9
Cincinnati, OH
80
53
18
5
2
2
6
Las Vegas, NV
269
188
63
12
5
1
15
Cleveland, OH
247
176
57
7
4
3
22
Ogden, UT
30
22
2
4
2
—
1
Columbus, OH
91
64
17
5
1
4
6
Phoenix, AZ
177
117
37
13
6
4
8
Dayton, OH
132
103
20
6
1
2
10
Pueblo, CO
23
19
3
1
—
—
—
Detroit, MI
241
135
70
27
5
4
6
Salt Lake City, UT
121
84
22
7
4
4
10
Evansville, IN
56
42
12
2
—
—
8
Tucson, AZ
166
127
28
6
1
2
10
Fort Wayne, IN
84
57
18
3
3
3
6
Pacific
1,710
1,269
326
68
22
25
167
Gary, IN
8
3
4
—
—
1
—
Berkeley, CA
U
U
U
U
U
U
U
Grand Rapids, MI
66
49
13
3
—
1
4
Fresno, CA
130
97
30
3
—
—
14
Indianapolis, IN
191
113
51
16
8
3
17
Glendale, CA
29
22
4
1
1
1
3
Lansing, MI
49
33
12
2
1
1
2
Honolulu, HI
70
58
6
6
—
—
3
Milwaukee, WI
83
58
17
4
1
3
3
Long Beach, CA
64
54
7
2
—
1
8
Peoria, IL
49
38
8
1
2
—
3
Los Angeles, CA
263
178
58
15
7
5
26
Rockford, IL
53
32
12
8
1
—
2
Pasadena, CA
35
26
7
2
—
—
5
South Bend, IN
32
27
4
1
—
—
6
Portland, OR
106
75
22
4
4
1
9
Toledo, OH
86
67
13
5
—
1
4
Sacramento, CA
224
174
37
7
1
5
30
Youngstown, OH
67
52
10
2
—
—
5
San Diego, CA
184
135
37
9
1
2
15
W.N. Central
603
402
142
29
14
15
54
San Francisco, CA
116
85
27
4
—
—
16
Des Moines, IA
—
—
—
—
—
—
—
San Jose, CA
189
152
25
6
—
6
18
Duluth, MN
45
36
6
2
1
—
4
Santa Cruz, CA
30
22
6
—
2
—
3
Kansas City, KS
12
6
3
2
1
—
1
Seattle, WA
110
73
25
5
5
2
6
Kansas City, MO
52
30
14
4
2
2
9
Spokane, WA
66
48
14
2
—
2
4
Lincoln, NE
46
37
8
—
—
1
3
Tacoma, WA
94
70
21
2
1
—
7
Minneapolis, MN
88
65
20
—
—
3
5
Total¶
10,808
7,500
2,354
566
206
165
781
Omaha, NE
102
77
21
1
2
1
9
St. Louis, MO
127
65
35
14
7
5
6
St. Paul, MN
61
38
19
1
1
2
9
Wichita, KS
70
48
16
5
—
1
8
U: Unavailable. —: No reported cases.
* Mortality data in this table are voluntarily reported from 122 cities in the United States, most of which have populations of >100,000. A death is reported by the place of its occurrence and by the week that the death certificate was filed. Fetal deaths are not included.
† Pneumonia and influenza.
§ Because of changes in reporting methods in this Pennsylvania city, these numbers are partial counts for the current week. Complete counts will be available in 4 to 6 weeks.
¶ Total includes unknown ages.
TABLE IV. Provisional cases of selected notifiable disease, United States, 4th quarter ending December 31, 2011 (52nd week)
Reporting area
Tuberculosis*
Current quarter
Previous 4 quarters
Cum 2012
Cum 2011
Min
Max
United States
1,973
1,973
2,571
8,860
11,025
New England
64
60
81
281
352
Connecticut
—
0
24
40
80
Maine
1
1
3
8
8
Massachusetts
52
41
52
191
223
New Hampshire
1
1
5
10
10
Rhode Island
5
5
8
24
26
Vermont
5
0
5
8
5
Mid. Atlantic
333
305
370
1,357
1,536
New Jersey
89
47
94
320
405
New York (Upstate)
63
43
63
200
243
New York City
154
151
168
625
647
Pennsylvania
27
27
63
212
241
E.N. Central
138
138
205
726
873
Illinois
52
52
97
324
367
Indiana
28
17
28
100
90
Michigan
15
15
39
113
171
Ohio
26
26
35
120
190
Wisconsin
17
10
23
69
55
W.N. Central
44
44
68
215
320
Iowa
—
0
9
21
47
Kansas
—
0
12
19
46
Minnesota
42
19
42
129
135
Missouri
2
2
7
21
38
Nebraska
—
0
6
15
27
North Dakota
—
0
0
—
12
South Dakota
—
0
5
10
15
S. Atlantic
405
405
522
1,828
2,261
Delaware
6
4
6
20
21
District of Columbia
13
11
17
53
43
Florida
126
126
191
663
834
Georgia
77
77
95
338
412
Maryland
62
49
62
230
220
North Carolina
10
10
76
180
295
South Carolina
44
16
44
124
153
Virginia
64
21
66
208
268
West Virginia
3
2
4
12
15
E.S. Central
89
89
135
434
545
Alabama
41
30
46
161
146
Kentucky
11
4
28
48
90
Mississippi
5
5
23
70
116
Tennessee
32
32
44
155
193
W.S. Central
166
166
347
1,083
1,747
Arkansas
29
11
29
82
78
Louisiana
71
13
71
157
200
Oklahoma
10
10
27
74
84
Texas
56
56
269
770
1,385
Mountain
97
54
174
433
565
Arizona
52
6
88
194
282
Colorado
20
10
20
68
71
Idaho
5
1
5
11
15
Montana
—
0
4
6
6
Nevada
4
4
39
75
114
New Mexico
13
9
13
45
50
Utah
3
3
12
31
20
Wyoming
—
0
2
3
7
Pacific
637
553
679
2,503
2,826
Alaska
16
11
16
55
56
California
528
446
553
2,065
2,327
Hawaii
34
25
34
117
115
Oregon
14
13
25
69
87
Washington
45
45
59
197
241
Territories
American Samoa
—
0
1
1
3
C.N.M.I.
—
0
10
17
32
Guam
—
0
0
—
101
Puerto Rico
8
8
13
44
80
U.S. Virgin Islands
—
0
0
—
—
C.N.M.I.: Commonwealth of Northern Mariana Islands.
U: Unavailable. —: No reported cases. N: Not reportable. NN: Not Nationally Notifiable. Cum: Cumulative year-to-date counts. Med: Median. Max: Maximum.