Persons using assistive technology might not be able to fully access information in this file. For assistance, please send e-mail to: mmwrq@cdc.gov. Type 508 Accommodation and the title of the report in the subject line of e-mail.
Notifiable Diseases and Mortality Tables
Table I Summary of provisional cases of selected notifiable diseases, United States, cumulative, week ending January 28, 2012 (4th Week)
Figure I Selected notifiable disease reports, United States, comparison of provisional 4-week totals ending January 28, 2012, with historical data
Table II Provisional cases of selected notifiable diseases, United States, weeks ending January 28, 2012 and January 29, 2011 (4th Week)
Table III Deaths in 122 U.S. cities, week ending January 28, 2012 (4th Week)
TABLE I. Provisional cases of infrequently reported notifiable diseases (<1,000 cases reported during the preceding year) — United States, week ending January 28, 2012 (4th week)*
TABLE I. (Continued) Provisional cases of infrequently reported notifiable diseases (<1,000 cases reported during the preceding year) — United States, week ending January 28, 2012 (4th week)*
—: No reported cases. N: Not reportable. NN: Not Nationally Notifiable. Cum: Cumulative year-to-date counts.
§ Not reportable in all states. Data from states where the condition is not reportable are excluded from this table except starting in 2007 for the arboviral diseases, STD data, TB data, and influenza-associated pediatric mortality, and in 2003 for SARS-CoV. Reporting exceptions are available at http://www.cdc.gov/osels/ph_surveillance/nndss/phs/infdis.htm.
¶ Includes both neuroinvasive and nonneuroinvasive. Updated weekly from reports to the Division of Vector-Borne Infectious Diseases, National Center for Zoonotic, Vector-Borne, and Enteric Diseases (ArboNET Surveillance). Data for West Nile virus are available in Table II.
** Data for H. influenzae (all ages, all serotypes) are available in Table II.
†† Updated weekly from reports to the Influenza Division, National Center for Immunization and Respiratory Diseases. Since October 2, 2011, one influenza-associated pediatric death occurring during the 2011-12 influenza season has been reported.
§§ The one measles case reported for the current week was imported.
¶¶ Data for meningococcal disease (all serogroups) are available in Table II.
*** CDC discontinued reporting of individual confirmed and probable cases of 2009 pandemic influenza A (H1N1) virus infections on July 24, 2009. During 2009, four cases of human infection with novel influenza A viruses, different from the 2009 pandemic influenza A (H1N1) strain, were reported to CDC. The four cases of novel influenza A virus infection reported to CDC during 2010, and the eight cases reported during 2011, were identified as swine influenza A (H3N2) virus and are unrelated to the 2009 pandemic influenza A (H1N1) virus. Total case counts are provided by the Influenza Division, National Center for Immunization and Respiratory Diseases (NCIRD).
††† No rubella cases were reported for the current week.
§§§ Updated weekly from reports to the Division of STD Prevention, National Center for HIV/AIDS, Viral Hepatitis, STD, and TB Prevention.
¶¶¶ There were no cases of viral hemorrhagic fever reported during the current week. See Table II for dengue hemorrhagic fever.
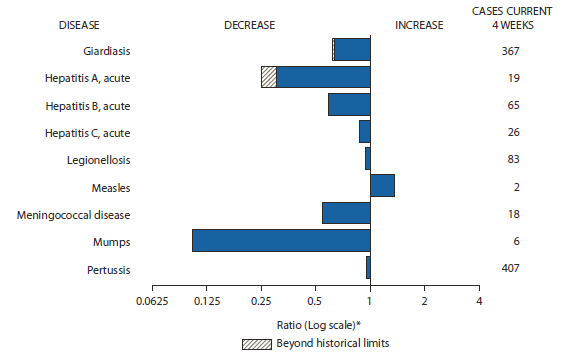
FIGURE I. Selected notifiable disease reports, United States, comparison of provisional 4-week totals January 28, 2012, with historical data
* Ratio of current 4-week total to mean of 15 4-week totals (from previous, comparable, and subsequent 4-week periods for the past 5 years). The point where the hatched area begins is based on the mean and two standard deviations of these 4-week totals.
Alternate Text: The figure above shows selected notifiable disease reports for the United States with provisional 4-week totals through January 28, 2012, with historical data. Reports of measles increased. Reports of giardiasis, acute hepatitis A, acute hepatitis B, acute hepatitis C, legionellosis, meningococcal disease, mumps, and pertussis all decreased, with giardiasis and acute hepatitis A both decreasing beyond historical limits.
TABLE II. Provisional cases of selected notifiable diseases, United States, weeks ending January 28, 2012, and January 29, 2011 (4th week)*
Reporting area
Chlamydia trachomatis infection
Coccidioidomycosis
Cryptosporidiosis
Current week
Previous 52 weeks
Cum 2012
Cum 2011
Current week
Previous 52 weeks
Cum 2012
Cum 2011
Current week
Previous 52 weeks
Cum 2012
Cum 2011
Med
Max
Med
Max
Med
Max
United States
11,755
26,745
30,793
61,475
99,619
89
388
587
542
1,873
46
131
397
250
355
New England
654
891
1,594
1,572
2,463
—
0
1
—
—
—
6
22
7
22
Connecticut
—
240
617
—
71
—
0
0
—
—
—
1
9
2
6
Maine
88
58
99
211
234
—
0
0
—
—
—
1
4
1
4
Massachusetts
566
418
860
1,135
1,596
—
0
0
—
—
—
2
8
—
9
New Hampshire
—
59
90
7
231
—
0
1
—
—
—
1
5
2
1
Rhode Island
—
80
170
219
225
—
0
0
—
—
—
0
1
—
—
Vermont
—
26
84
—
106
—
0
0
—
—
—
1
5
2
2
Mid. Atlantic
2,058
3,231
3,954
9,990
11,925
—
0
1
—
—
2
15
43
23
39
New Jersey
158
543
1,004
1,658
1,662
—
0
0
—
—
—
0
1
1
—
New York (Upstate)
680
715
1,654
1,909
2,044
—
0
0
—
—
—
4
16
4
6
New York City
271
1,067
1,315
2,583
4,385
—
0
0
—
—
—
1
6
3
5
Pennsylvania
949
1,007
1,598
3,840
3,834
—
0
1
—
—
2
9
27
15
28
E.N. Central
1,149
4,105
4,574
8,435
18,628
1
1
5
3
3
14
32
147
69
98
Illinois
32
1,132
1,365
1,378
4,999
—
0
0
—
—
—
3
26
1
11
Indiana
225
549
717
1,189
2,898
—
0
0
—
—
—
3
14
—
17
Michigan
553
922
1,229
2,697
4,434
—
0
3
—
—
—
6
14
8
22
Ohio
142
993
1,112
1,958
4,293
1
0
3
3
3
14
11
95
48
33
Wisconsin
197
463
539
1,213
2,004
—
0
0
—
—
—
8
65
12
15
W.N. Central
38
1,509
1,821
1,290
5,938
—
0
2
—
—
1
16
87
18
41
Iowa
12
211
378
726
929
—
0
0
—
—
—
6
19
6
11
Kansas
—
209
288
78
806
—
0
0
—
—
—
0
11
1
—
Minnesota
—
316
401
—
1,368
—
0
0
—
—
—
0
0
—
—
Missouri
—
534
759
—
2,061
—
0
0
—
—
1
5
63
7
10
Nebraska
—
127
215
272
312
—
0
2
—
—
—
2
12
2
15
North Dakota
—
44
64
5
146
—
0
0
—
—
—
0
12
—
—
South Dakota
26
62
89
209
316
—
0
0
—
—
—
2
13
2
5
S. Atlantic
2,995
5,407
7,461
16,422
20,007
—
0
2
—
—
16
21
57
60
69
Delaware
68
86
182
245
262
—
0
0
—
—
—
0
1
1
1
District of Columbia
190
110
216
487
420
—
0
0
—
—
—
0
1
—
1
Florida
1,071
1,516
1,700
4,985
5,717
—
0
0
—
—
6
8
17
29
31
Georgia
645
1,022
1,569
3,010
3,507
—
0
0
—
—
—
5
11
5
14
Maryland
197
479
790
631
1,383
—
0
2
—
—
3
1
7
12
4
North Carolina
—
1,000
1,688
4,011
3,336
—
0
0
—
—
—
0
44
—
—
South Carolina
—
531
1,344
—
1,930
—
0
0
—
—
2
2
6
7
11
Virginia
688
659
1,707
2,743
3,080
—
0
1
—
—
4
2
8
5
7
West Virginia
136
81
120
310
372
—
0
0
—
—
1
0
5
1
—
E.S. Central
1,171
1,900
2,804
3,617
6,072
—
0
0
—
—
—
7
25
13
10
Alabama
468
540
1,566
893
2,151
—
0
0
—
—
—
2
7
5
6
Kentucky
331
299
557
891
421
—
0
0
—
—
—
2
17
1
3
Mississippi
—
398
696
—
1,216
—
0
0
—
—
—
1
4
1
—
Tennessee
372
601
751
1,833
2,284
—
0
0
—
—
—
2
6
6
1
W.S. Central
1,919
3,353
4,327
8,554
12,778
—
0
1
—
—
5
8
44
15
10
Arkansas
—
309
440
—
1,176
—
0
0
—
—
—
0
2
1
—
Louisiana
242
371
1,071
1,098
1,555
—
0
1
—
—
1
1
9
4
—
Oklahoma
94
130
675
349
658
—
0
0
—
—
1
2
6
2
2
Texas
1,583
2,414
3,124
7,107
9,389
—
0
0
—
—
3
5
40
8
8
Mountain
368
1,775
2,395
3,713
6,058
65
306
459
438
1,425
6
10
29
21
40
Arizona
287
552
782
1,937
2,025
62
303
456
432
1,405
—
1
4
—
3
Colorado
—
420
847
891
1,284
—
0
0
—
—
—
2
11
—
10
Idaho
2
81
238
63
293
—
0
0
—
—
4
1
9
10
5
Montana
—
66
88
188
263
—
0
2
—
—
2
1
6
5
3
Nevada
46
203
380
139
800
3
2
5
6
8
—
0
2
2
1
New Mexico
—
202
482
—
739
—
1
4
—
7
—
2
9
4
12
Utah
14
133
190
407
506
—
0
4
—
3
—
1
5
—
5
Wyoming
19
33
67
88
148
—
0
2
—
2
—
0
5
—
1
Pacific
1,403
4,001
5,426
7,882
15,750
23
89
148
101
445
2
11
21
24
26
Alaska
53
110
157
394
477
—
0
0
—
—
—
0
3
—
—
California
699
3,022
4,497
5,254
12,048
23
89
148
101
444
2
6
16
21
12
Hawaii
—
114
142
—
447
—
0
0
—
—
—
0
1
—
—
Oregon
300
273
412
1,095
1,026
—
0
1
—
1
—
2
8
3
13
Washington
351
441
611
1,139
1,752
—
0
0
—
—
—
1
6
—
1
Territories
American Samoa
—
0
0
—
—
—
0
0
—
—
N
0
0
N
N
C.N.M.I.
—
—
—
—
—
—
—
—
—
—
—
—
—
—
—
Guam
—
15
44
—
13
—
0
0
—
—
—
0
0
—
—
Puerto Rico
239
99
349
290
460
—
0
0
—
—
N
0
0
N
N
U.S. Virgin Islands
—
16
27
—
54
—
0
0
—
—
—
0
0
—
—
C.N.M.I.: Commonwealth of Northern Mariana Islands.
U: Unavailable. —: No reported cases. N: Not reportable. NN: Not Nationally Notifiable. Cum: Cumulative year-to-date counts. Med: Median. Max: Maximum.
TABLE II. (Continued) Provisional cases of selected notifiable diseases, United States, weeks ending January 28, 2012, and January 29, 2011 (4th week)*
Reporting area
Dengue Virus Infection
Dengue Fever†
Dengue Hemorrhagic Fever§
Current week
Previous 52 weeks
Cum 2012
Cum 2011
Current week
Previous 52 weeks
Cum 2012
Cum 2011
Med
Max
Med
Max
United States
—
2
16
—
19
—
0
1
—
—
New England
—
0
1
—
—
—
0
0
—
—
Connecticut
—
0
0
—
—
—
0
0
—
—
Maine
—
0
0
—
—
—
0
0
—
—
Massachusetts
—
0
0
—
—
—
0
0
—
—
New Hampshire
—
0
0
—
—
—
0
0
—
—
Rhode Island
—
0
0
—
—
—
0
0
—
—
Vermont
—
0
1
—
—
—
0
0
—
—
Mid. Atlantic
—
1
6
—
6
—
0
0
—
—
New Jersey
—
0
0
—
—
—
0
0
—
—
New York (Upstate)
—
0
0
—
—
—
0
0
—
—
New York City
—
0
4
—
3
—
0
0
—
—
Pennsylvania
—
0
2
—
3
—
0
0
—
—
E.N. Central
—
0
2
—
3
—
0
1
—
—
Illinois
—
0
1
—
—
—
0
1
—
—
Indiana
—
0
1
—
1
—
0
0
—
—
Michigan
—
0
1
—
—
—
0
0
—
—
Ohio
—
0
1
—
—
—
0
0
—
—
Wisconsin
—
0
1
—
2
—
0
0
—
—
W.N. Central
—
0
2
—
—
—
0
0
—
—
Iowa
—
0
1
—
—
—
0
0
—
—
Kansas
—
0
1
—
—
—
0
0
—
—
Minnesota
—
0
1
—
—
—
0
0
—
—
Missouri
—
0
1
—
—
—
0
0
—
—
Nebraska
—
0
0
—
—
—
0
0
—
—
North Dakota
—
0
1
—
—
—
0
0
—
—
South Dakota
—
0
0
—
—
—
0
0
—
—
S. Atlantic
—
1
8
—
5
—
0
1
—
—
Delaware
—
0
2
—
—
—
0
0
—
—
District of Columbia
—
0
0
—
—
—
0
0
—
—
Florida
—
1
7
—
3
—
0
0
—
—
Georgia
—
0
1
—
—
—
0
0
—
—
Maryland
—
0
2
—
—
—
0
0
—
—
North Carolina
—
0
1
—
1
—
0
0
—
—
South Carolina
—
0
1
—
—
—
0
0
—
—
Virginia
—
0
1
—
1
—
0
1
—
—
West Virginia
—
0
0
—
—
—
0
0
—
—
E.S. Central
—
0
3
—
—
—
0
0
—
—
Alabama
—
0
1
—
—
—
0
0
—
—
Kentucky
—
0
1
—
—
—
0
0
—
—
Mississippi
—
0
0
—
—
—
0
0
—
—
Tennessee
—
0
2
—
—
—
0
0
—
—
W.S. Central
—
0
2
—
—
—
0
0
—
—
Arkansas
—
0
0
—
—
—
0
0
—
—
Louisiana
—
0
1
—
—
—
0
0
—
—
Oklahoma
—
0
0
—
—
—
0
0
—
—
Texas
—
0
1
—
—
—
0
0
—
—
Mountain
—
0
1
—
1
—
0
0
—
—
Arizona
—
0
1
—
1
—
0
0
—
—
Colorado
—
0
0
—
—
—
0
0
—
—
Idaho
—
0
0
—
—
—
0
0
—
—
Montana
—
0
0
—
—
—
0
0
—
—
Nevada
—
0
1
—
—
—
0
0
—
—
New Mexico
—
0
1
—
—
—
0
0
—
—
Utah
—
0
1
—
—
—
0
0
—
—
Wyoming
—
0
0
—
—
—
0
0
—
—
Pacific
—
0
4
—
4
—
0
0
—
—
Alaska
—
0
0
—
—
—
0
0
—
—
California
—
0
2
—
3
—
0
0
—
—
Hawaii
—
0
4
—
—
—
0
0
—
—
Oregon
—
0
0
—
—
—
0
0
—
—
Washington
—
0
1
—
1
—
0
0
—
—
Territories
American Samoa
—
0
0
—
—
—
0
0
—
—
C.N.M.I.
—
—
—
—
—
—
—
—
—
—
Guam
—
0
0
—
—
—
0
0
—
—
Puerto Rico
—
16
83
—
89
—
0
3
—
1
U.S. Virgin Islands
—
0
0
—
—
—
0
0
—
—
C.N.M.I.: Commonwealth of Northern Mariana Islands.
U: Unavailable. —: No reported cases. N: Not reportable. NN: Not Nationally Notifiable. Cum: Cumulative year-to-date counts. Med: Median. Max: Maximum.
† Dengue Fever includes cases that meet criteria for Dengue Fever with hemorrhage, other clinical and unknown case classifications.
§ DHF includes cases that meet criteria for dengue shock syndrome (DSS), a more severe form of DHF.
TABLE II. (Continued) Provisional cases of selected notifiable diseases, United States, weeks ending January 28, 2012, and January 29, 2011 (4th week)*
Reporting area
Ehrlichiosis/Anaplasmosis†
Ehrlichia chaffeensis
Anaplasma phagocytophilum
Undetermined
Current week
Previous 52 weeks
Cum 2012
Cum 2011
Current week
Previous 52 weeks
Cum 2012
Cum 2011
Current week
Previous 52 weeks
Cum 2012
Cum 2011
Med
Max
Med
Max
Med
Max
United States
—
9
93
2
8
—
16
57
4
7
—
2
9
2
1
New England
—
0
1
—
—
—
3
28
1
3
—
0
1
—
—
Connecticut
—
0
0
—
—
—
0
0
—
—
—
0
0
—
—
Maine
—
0
1
—
—
—
0
3
1
1
—
0
0
—
—
Massachusetts
—
0
0
—
—
—
1
18
—
—
—
0
0
—
—
New Hampshire
—
0
1
—
—
—
0
4
—
—
—
0
1
—
—
Rhode Island
—
0
1
—
—
—
0
15
—
2
—
0
1
—
—
Vermont
—
0
0
—
—
—
0
1
—
—
—
0
0
—
—
Mid. Atlantic
—
1
5
—
1
—
6
33
2
2
—
0
2
—
—
New Jersey
—
0
0
—
—
—
0
0
—
—
—
0
0
—
—
New York (Upstate)
—
0
4
—
—
—
3
33
1
1
—
0
2
—
—
New York City
—
0
2
—
1
—
1
5
1
1
—
0
0
—
—
Pennsylvania
—
0
0
—
—
—
0
1
—
—
—
0
0
—
—
E.N. Central
—
0
5
—
1
—
0
2
—
—
—
0
6
—
1
Illinois
—
0
4
—
—
—
0
2
—
—
—
0
1
—
—
Indiana
—
0
0
—
—
—
0
0
—
—
—
0
4
—
1
Michigan
—
0
2
—
—
—
0
0
—
—
—
0
2
—
—
Ohio
—
0
1
—
1
—
0
1
—
—
—
0
1
—
—
Wisconsin
—
0
0
—
—
—
0
1
—
—
—
0
1
—
—
W.N. Central
—
1
19
1
—
—
0
8
—
—
—
0
7
—
—
Iowa
N
0
0
N
N
N
0
0
N
N
N
0
0
N
N
Kansas
—
0
2
—
—
—
0
1
—
—
—
0
1
—
—
Minnesota
—
0
0
—
—
—
0
1
—
—
—
0
0
—
—
Missouri
—
1
19
1
—
—
0
7
—
—
—
0
7
—
—
Nebraska
—
0
1
—
—
—
0
1
—
—
—
0
0
—
—
North Dakota
N
0
0
N
N
N
0
0
N
N
N
0
0
N
N
South Dakota
—
0
1
—
—
—
0
1
—
—
—
0
0
—
—
S. Atlantic
—
3
33
1
6
—
1
8
1
2
—
0
2
2
—
Delaware
—
0
2
—
1
—
0
1
—
—
—
0
0
—
—
District of Columbia
N
0
0
N
N
N
0
0
N
N
N
0
0
N
N
Florida
—
0
3
—
1
—
0
3
—
—
—
0
0
—
—
Georgia
—
0
3
1
1
—
0
2
1
—
—
0
1
1
—
Maryland
—
0
3
—
1
—
0
2
—
—
—
0
1
1
—
North Carolina
—
0
17
—
2
—
0
6
—
2
—
0
0
—
—
South Carolina
—
0
1
—
—
—
0
0
—
—
—
0
1
—
—
Virginia
—
1
13
—
—
—
0
3
—
—
—
0
1
—
—
West Virginia
—
0
1
—
—
—
0
0
—
—
—
0
1
—
—
E.S. Central
—
1
8
—
—
—
0
2
—
—
—
0
3
—
—
Alabama
—
0
2
—
—
—
0
1
—
—
N
0
0
N
N
Kentucky
—
0
3
—
—
—
0
0
—
—
—
0
0
—
—
Mississippi
—
0
1
—
—
—
0
1
—
—
—
0
0
—
—
Tennessee
—
0
5
—
—
—
0
1
—
—
—
0
3
—
—
W.S. Central
—
0
30
—
—
—
0
3
—
—
—
0
0
—
—
Arkansas
—
0
13
—
—
—
0
3
—
—
—
0
0
—
—
Louisiana
—
0
0
—
—
—
0
0
—
—
—
0
0
—
—
Oklahoma
—
0
25
—
—
—
0
1
—
—
—
0
0
—
—
Texas
—
0
1
—
—
—
0
1
—
—
—
0
0
—
—
Mountain
—
0
0
—
—
—
0
0
—
—
—
0
1
—
—
Arizona
—
0
0
—
—
—
0
0
—
—
—
0
1
—
—
Colorado
N
0
0
N
N
N
0
0
N
N
N
0
0
N
N
Idaho
N
0
0
N
N
N
0
0
N
N
N
0
0
N
N
Montana
N
0
0
N
N
N
0
0
N
N
N
0
0
N
N
Nevada
N
0
0
N
N
N
0
0
N
N
N
0
0
N
N
New Mexico
N
0
0
N
N
N
0
0
N
N
N
0
0
N
N
Utah
—
0
0
—
—
—
0
0
—
—
—
0
1
—
—
Wyoming
—
0
0
—
—
—
0
0
—
—
—
0
0
—
—
Pacific
—
0
0
—
—
—
0
1
—
—
—
0
2
—
—
Alaska
N
0
0
N
N
N
0
0
N
N
N
0
0
N
N
California
—
0
0
—
—
—
0
0
—
—
—
0
2
—
—
Hawaii
N
0
0
N
N
N
0
0
N
N
N
0
0
N
N
Oregon
—
0
0
—
—
—
0
1
—
—
—
0
0
—
—
Washington
—
0
0
—
—
—
0
0
—
—
—
0
0
—
—
Territories
American Samoa
N
0
0
N
N
N
0
0
N
N
N
0
0
N
N
C.N.M.I.
—
—
—
—
—
—
—
—
—
—
—
—
—
—
—
Guam
N
0
0
N
N
N
0
0
N
N
N
0
0
N
N
Puerto Rico
N
0
0
N
N
N
0
0
N
N
N
0
0
N
N
U.S. Virgin Islands
—
0
0
—
—
—
0
0
—
—
—
0
0
—
—
C.N.M.I.: Commonwealth of Northern Mariana Islands.
U: Unavailable. —: No reported cases. N: Not reportable. NN: Not Nationally Notifiable. Cum: Cumulative year-to-date counts. Med: Median. Max: Maximum.
† Cumulative total E. ewingii cases reported for year 2011 = 14, and 0 case reports for 2012.
TABLE II. (Continued) Provisional cases of selected notifiable diseases, United States, weeks ending January 28, 2012, and January 29, 2011 (4th week)*
Reporting area
Giardiasis
Gonorrhea
Haemophilus influenzae, invasive† All ages, all serotypes
Current week
Previous 52 weeks
Cum 2012
Cum 2011
Current week
Previous 52 weeks
Cum 2012
Cum 2011
Current week
Previous 52 weeks
Cum 2012
Cum 2011
Med
Max
Med
Max
Med
Max
United States
99
278
450
566
930
2,808
5,982
6,724
15,337
23,586
20
64
96
196
297
New England
4
27
64
17
92
64
108
178
189
281
—
4
9
6
19
Connecticut
—
4
10
4
15
—
45
101
—
94
—
1
4
3
5
Maine
3
3
10
6
6
10
5
18
27
9
—
0
2
2
4
Massachusetts
—
12
29
—
55
52
46
80
130
167
—
2
4
—
8
New Hampshire
1
2
8
3
6
2
2
7
2
6
—
0
2
1
1
Rhode Island
—
0
10
2
5
—
7
35
30
3
—
0
2
—
—
Vermont
—
3
19
2
5
—
0
6
—
2
—
0
2
—
1
Mid. Atlantic
10
54
90
77
171
507
744
916
2,493
2,733
4
15
28
60
57
New Jersey
—
0
0
—
—
47
150
232
478
515
—
2
6
—
11
New York (Upstate)
—
22
50
22
39
131
115
301
351
314
3
3
14
11
8
New York City
3
16
29
30
69
77
241
315
606
952
—
4
10
17
8
Pennsylvania
7
15
30
25
63
252
263
492
1,058
952
1
5
14
32
30
E.N. Central
16
47
84
103
186
336
1,047
1,264
2,331
5,111
2
11
22
23
52
Illinois
—
10
19
1
37
15
289
386
359
1,284
—
3
11
1
11
Indiana
—
6
13
2
22
60
131
169
315
817
—
2
6
1
7
Michigan
2
10
21
26
41
161
236
371
789
1,276
—
1
4
3
8
Ohio
13
16
31
54
55
47
310
398
581
1,351
2
4
7
17
17
Wisconsin
1
8
19
20
31
53
89
118
287
383
—
1
4
1
9
W.N. Central
15
20
52
64
80
2
312
378
256
1,145
—
2
10
4
10
Iowa
3
4
15
20
22
1
36
94
153
152
—
0
1
—
—
Kansas
—
2
9
2
8
—
42
65
22
158
—
0
2
1
—
Minnesota
—
0
0
—
—
—
44
61
—
146
—
0
0
—
—
Missouri
7
8
23
25
28
—
150
204
—
554
—
1
5
1
6
Nebraska
5
3
11
15
14
—
28
52
63
71
—
0
2
2
4
North Dakota
—
0
12
—
—
—
4
9
—
20
—
0
6
—
—
South Dakota
—
1
8
2
8
1
11
20
18
44
—
0
1
—
—
S. Atlantic
32
53
103
149
161
742
1,491
1,949
4,507
5,546
10
14
31
58
70
Delaware
—
0
3
—
1
12
15
35
50
65
—
0
2
—
—
District of Columbia
—
1
5
—
3
71
38
105
202
158
—
0
1
—
—
Florida
15
23
69
61
103
267
376
474
1,300
1,538
4
4
12
15
26
Georgia
7
10
51
51
20
198
311
461
913
1,119
2
2
6
10
16
Maryland
4
7
14
20
13
55
118
176
194
377
3
2
6
11
6
North Carolina
N
0
0
N
N
—
334
548
1,208
1,131
1
1
7
6
4
South Carolina
3
2
8
10
6
—
156
421
—
580
—
1
5
9
4
Virginia
3
5
12
7
15
130
121
353
601
496
—
2
8
4
14
West Virginia
—
0
8
—
—
9
14
29
39
82
—
0
5
3
—
E.S. Central
1
3
9
8
7
375
516
789
1,016
1,735
1
3
12
12
20
Alabama
1
3
9
8
7
164
165
408
272
707
—
1
3
—
7
Kentucky
N
0
0
N
N
84
76
151
247
102
—
1
4
4
3
Mississippi
N
0
0
N
N
—
103
191
—
345
1
0
3
3
2
Tennessee
N
0
0
N
N
127
146
222
497
581
—
2
8
5
8
W.S. Central
4
5
15
17
15
484
878
1,176
2,301
3,432
2
2
10
11
17
Arkansas
4
3
8
7
3
—
87
138
—
363
1
0
3
2
1
Louisiana
—
2
10
10
12
75
128
255
311
434
1
1
4
4
8
Oklahoma
—
0
0
—
—
25
33
196
87
237
—
1
9
5
8
Texas
N
0
0
N
N
384
590
834
1,903
2,398
—
0
1
—
—
Mountain
4
22
41
26
77
45
202
324
494
818
1
5
10
12
31
Arizona
2
2
6
4
7
41
87
130
365
298
1
1
6
5
12
Colorado
—
7
23
10
22
—
39
89
95
189
—
1
4
—
9
Idaho
1
3
9
4
16
1
3
13
3
10
—
0
2
—
2
Montana
—
2
5
2
2
—
1
4
2
9
—
0
1
1
1
Nevada
1
1
7
4
4
1
38
103
14
154
—
0
2
2
2
New Mexico
—
1
6
1
8
—
34
73
—
136
—
1
3
3
5
Utah
—
2
9
1
17
2
5
10
13
16
—
0
3
1
—
Wyoming
—
0
5
—
1
—
0
3
2
6
—
0
1
—
—
Pacific
13
47
126
105
141
253
630
756
1,750
2,785
—
3
9
10
21
Alaska
—
2
7
4
6
7
19
31
53
82
—
0
3
—
3
California
11
33
51
85
100
184
519
609
1,470
2,316
—
1
5
3
6
Hawaii
1
0
3
1
—
—
13
24
—
55
—
0
3
2
3
Oregon
1
6
20
14
30
17
26
60
76
105
—
1
6
5
9
Washington
—
6
95
1
5
45
50
79
151
227
—
0
1
—
—
Territories
American Samoa
—
0
0
—
—
—
0
0
—
—
—
0
0
—
—
C.N.M.I.
—
—
—
—
—
—
—
—
—
—
—
—
—
—
—
Guam
—
0
0
—
—
—
0
5
—
—
—
0
0
—
—
Puerto Rico
—
0
4
—
4
8
6
14
10
21
—
0
0
—
—
U.S. Virgin Islands
—
0
0
—
—
—
2
10
—
14
—
0
0
—
—
C.N.M.I.: Commonwealth of Northern Mariana Islands.
U: Unavailable. —: No reported cases. N: Not reportable. NN: Not Nationally Notifiable. Cum: Cumulative year-to-date counts. Med: Median. Max: Maximum.
† Data for H. influenzae (age <5 yrs for serotype b, nonserotype b, and unknown serotype) are available in Table I.
TABLE II. (Continued) Provisional cases of selected notifiable diseases, United States, weeks ending January 28, 2012, and January 29, 2011 (4th week)*
Reporting area
Hepatitis (viral, acute), by type
A
B
C
Current week
Previous 52 weeks
Cum 2012
Cum 2011
Current week
Previous 52 weeks
Cum 2012
Cum 2011
Current week
Previous 52 weeks
Cum 2012
Cum 2011
Med
Max
Med
Max
Med
Max
United States
7
21
39
34
94
17
47
96
114
193
5
19
37
43
68
New England
—
1
5
1
6
—
1
8
—
8
—
1
5
—
6
Connecticut
—
0
3
1
2
—
0
4
—
—
—
0
5
—
6
Maine
—
0
2
—
—
—
0
2
—
—
—
0
3
—
—
Massachusetts
—
0
3
—
2
—
0
6
—
7
—
0
2
—
—
New Hampshire
—
0
0
—
—
—
0
1
—
1
N
0
0
N
N
Rhode Island
—
0
1
—
1
U
0
0
U
U
U
0
0
U
U
Vermont
—
0
2
—
1
—
0
0
—
—
—
0
1
—
—
Mid. Atlantic
2
3
7
4
16
1
5
8
7
17
1
1
5
5
5
New Jersey
—
0
0
—
—
—
0
1
2
—
—
0
1
1
—
New York (Upstate)
2
1
4
2
2
1
1
4
1
5
—
1
4
—
4
New York City
—
1
4
—
8
—
1
5
2
4
—
0
1
—
—
Pennsylvania
—
1
4
2
6
—
2
4
2
8
1
1
3
4
1
E.N. Central
—
4
8
3
20
1
6
37
11
43
—
2
8
1
18
Illinois
—
1
4
—
4
—
1
6
—
7
—
0
2
—
1
Indiana
—
0
3
—
4
—
1
4
2
4
—
0
5
—
12
Michigan
—
1
6
3
4
—
1
6
3
10
—
1
4
1
4
Ohio
—
1
3
—
6
1
1
30
6
19
—
0
1
—
—
Wisconsin
—
0
1
—
2
—
0
3
—
3
—
0
1
—
1
W.N. Central
—
1
7
1
4
—
2
9
4
14
—
0
4
1
—
Iowa
—
0
1
—
1
—
0
1
—
—
—
0
0
—
—
Kansas
—
0
1
—
—
—
0
2
—
3
—
0
1
1
—
Minnesota
—
0
7
—
—
—
0
7
—
—
—
0
2
—
—
Missouri
—
0
1
1
1
—
1
5
3
7
—
0
0
—
—
Nebraska
—
0
1
—
—
—
0
2
1
3
—
0
1
—
—
North Dakota
—
0
0
—
—
—
0
0
—
—
—
0
0
—
—
South Dakota
—
0
2
—
2
—
0
0
—
1
—
0
0
—
—
S. Atlantic
2
4
11
5
17
8
12
57
36
41
2
5
13
15
14
Delaware
—
0
1
—
1
—
0
2
—
—
U
0
0
U
U
District of Columbia
—
0
0
—
—
—
0
0
—
—
—
0
0
—
—
Florida
1
1
8
3
4
2
4
7
11
17
2
1
3
4
5
Georgia
—
1
5
—
5
1
2
7
5
7
—
1
3
—
3
Maryland
—
0
4
—
3
3
1
4
10
4
—
0
3
1
2
North Carolina
1
0
3
1
1
1
2
9
4
5
—
1
7
3
2
South Carolina
—
0
2
—
1
1
1
3
1
4
—
0
1
—
—
Virginia
—
0
3
—
2
—
1
4
5
4
—
0
3
—
2
West Virginia
—
0
2
1
—
—
0
43
—
—
—
0
7
7
—
E.S. Central
—
1
6
1
2
3
10
15
36
27
2
5
10
15
8
Alabama
—
0
2
—
—
—
2
6
6
4
—
0
3
1
—
Kentucky
—
0
2
—
2
1
3
8
14
11
2
2
8
9
5
Mississippi
—
0
1
—
—
—
1
4
2
2
U
0
0
U
U
Tennessee
—
0
5
1
—
2
4
8
14
10
—
1
5
5
3
W.S. Central
3
3
7
8
3
1
6
14
8
14
—
1
5
2
9
Arkansas
—
0
2
—
—
—
1
4
—
2
—
0
0
—
—
Louisiana
—
0
2
—
1
—
0
4
—
7
—
0
1
—
4
Oklahoma
—
0
2
—
—
1
1
9
1
1
—
1
4
—
3
Texas
3
3
7
8
2
—
3
9
7
4
—
0
3
2
2
Mountain
—
1
5
6
8
3
1
4
9
12
—
1
5
2
4
Arizona
—
0
2
2
3
—
0
3
2
1
U
0
0
U
U
Colorado
—
0
2
2
3
—
0
2
—
2
—
0
2
—
2
Idaho
—
0
1
1
—
—
0
1
—
1
—
0
2
—
2
Montana
—
0
1
—
1
—
0
0
—
—
—
0
1
—
—
Nevada
—
0
3
1
—
3
0
3
7
6
—
0
2
2
—
New Mexico
—
0
1
—
1
—
0
2
—
—
—
0
2
—
—
Utah
—
0
1
—
—
—
0
1
—
2
—
0
2
—
—
Wyoming
—
0
1
—
—
—
0
0
—
—
—
0
1
—
—
Pacific
—
3
11
5
18
—
3
8
3
17
—
1
8
2
4
Alaska
—
0
1
—
—
—
0
1
—
—
U
0
0
U
U
California
—
3
7
5
15
—
2
7
1
14
—
1
4
2
1
Hawaii
—
0
2
—
1
—
0
1
1
1
U
0
0
U
U
Oregon
—
0
2
—
1
—
0
4
1
2
—
0
2
—
2
Washington
—
0
4
—
1
—
0
3
—
—
—
0
4
—
1
Territories
American Samoa
—
0
0
—
—
—
0
0
—
—
—
0
0
—
—
C.N.M.I.
—
—
—
—
—
—
—
—
—
—
—
—
—
—
—
Guam
—
0
5
—
1
—
2
8
—
2
—
0
3
—
1
Puerto Rico
—
0
1
—
—
—
0
2
—
—
N
0
0
N
N
U.S. Virgin Islands
—
0
0
—
—
—
0
0
—
—
—
0
0
—
—
C.N.M.I.: Commonwealth of Northern Mariana Islands.
U: Unavailable. —: No reported cases. N: Not reportable. NN: Not Nationally Notifiable. Cum: Cumulative year-to-date counts. Med: Median. Max: Maximum.
TABLE II. (Continued) Provisional cases of selected notifiable diseases, United States, weeks ending January 28, 2012, and January 29, 2011 (4th week)*
Reporting area
Legionellosis
Lyme disease
Malaria
Current week
Previous 52 weeks
Cum 2012
Cum 2011
Current week
Previous 52 weeks
Cum 2012
Cum 2011
Current week
Previous 52 weeks
Cum 2012
Cum 2011
Med
Max
Med
Max
Med
Max
United States
19
67
166
113
133
119
391
1,578
736
648
12
24
48
58
104
New England
—
4
40
3
11
1
81
503
25
202
—
1
7
1
7
Connecticut
—
1
11
2
1
—
36
234
—
88
—
0
2
—
1
Maine
—
0
3
—
—
—
13
67
10
8
—
0
2
—
—
Massachusetts
—
3
24
—
7
—
18
106
—
69
—
0
6
—
5
New Hampshire
—
0
3
—
1
—
10
90
3
29
—
0
1
—
—
Rhode Island
—
0
9
1
1
—
1
31
—
1
—
0
2
—
—
Vermont
—
0
2
—
1
1
6
70
12
7
—
0
1
1
1
Mid. Atlantic
2
16
76
20
33
95
193
751
596
268
—
6
13
6
29
New Jersey
—
0
0
—
—
58
1
145
390
—
—
0
0
—
—
New York (Upstate)
—
6
27
8
9
14
56
212
28
21
—
1
4
1
3
New York City
1
3
14
4
12
—
1
14
—
5
—
4
11
4
21
Pennsylvania
1
5
41
8
12
23
109
526
178
242
—
1
5
1
5
E.N. Central
2
13
51
24
27
2
18
259
9
52
—
3
10
4
12
Illinois
—
2
11
—
3
—
1
20
—
3
—
1
5
—
5
Indiana
—
2
8
3
4
—
1
12
—
—
—
0
2
—
1
Michigan
—
2
15
—
7
1
1
12
5
—
—
0
4
1
—
Ohio
2
7
34
21
13
1
1
6
4
2
—
1
4
2
5
Wisconsin
—
0
1
—
—
—
15
218
—
47
—
0
2
1
1
W.N. Central
1
1
8
3
2
—
1
16
2
2
1
1
5
3
1
Iowa
—
0
2
—
—
—
0
13
1
1
—
0
3
1
—
Kansas
—
0
2
—
—
—
0
2
—
—
—
0
2
—
—
Minnesota
—
0
0
—
—
—
0
0
—
—
—
0
0
—
—
Missouri
1
1
5
3
2
—
0
2
—
1
1
0
2
2
1
Nebraska
—
0
2
—
—
—
0
2
1
—
—
0
1
—
—
North Dakota
—
0
1
—
—
—
0
9
—
—
—
0
0
—
—
South Dakota
—
0
1
—
—
—
0
2
—
—
—
0
1
—
—
S. Atlantic
11
11
30
38
16
21
61
181
90
119
5
8
25
28
34
Delaware
—
0
4
2
—
2
13
48
18
37
—
0
3
—
—
District of Columbia
—
0
3
—
—
—
0
3
1
2
—
0
1
—
2
Florida
8
4
13
21
7
6
3
8
14
3
2
2
6
13
7
Georgia
—
1
4
3
2
—
0
5
3
1
—
1
6
3
6
Maryland
1
2
15
3
3
6
21
116
29
42
2
2
15
7
7
North Carolina
—
1
7
4
1
—
0
12
—
5
—
0
7
—
4
South Carolina
—
0
5
1
—
1
0
6
1
1
1
0
1
2
—
Virginia
2
1
7
4
3
6
15
75
18
28
—
1
8
3
8
West Virginia
—
0
5
—
—
—
0
13
6
—
—
0
1
—
—
E.S. Central
—
2
11
2
5
—
1
5
1
—
—
1
4
—
2
Alabama
—
0
2
—
1
—
0
2
—
—
—
0
3
—
1
Kentucky
—
1
4
—
1
—
0
1
1
—
—
0
2
—
—
Mississippi
—
0
3
—
1
—
0
1
—
—
—
0
1
—
—
Tennessee
—
1
8
2
2
—
0
4
—
—
—
0
3
—
1
W.S. Central
—
3
8
2
4
—
1
3
—
1
3
1
4
3
2
Arkansas
—
0
2
—
—
—
0
0
—
—
—
0
1
—
—
Louisiana
—
0
3
—
1
—
0
1
—
—
—
0
1
—
—
Oklahoma
—
0
3
—
—
—
0
0
—
—
3
0
1
3
—
Texas
—
2
7
2
3
—
1
3
—
1
—
0
4
—
2
Mountain
—
2
9
5
5
—
0
5
2
1
—
1
5
1
8
Arizona
—
1
4
2
2
—
0
4
1
—
—
0
4
—
2
Colorado
—
0
4
—
2
—
0
1
—
—
—
0
3
—
3
Idaho
—
0
1
1
—
—
0
2
1
—
—
0
1
—
—
Montana
—
0
1
—
—
—
0
3
—
—
—
0
1
—
—
Nevada
—
0
2
1
1
—
0
1
—
—
—
0
2
1
2
New Mexico
—
0
2
—
—
—
0
2
—
1
—
0
1
—
1
Utah
—
0
2
1
—
—
0
1
—
—
—
0
1
—
—
Wyoming
—
0
2
—
—
—
0
1
—
—
—
0
0
—
—
Pacific
3
5
12
16
30
—
2
8
11
3
3
3
11
12
9
Alaska
—
0
0
—
—
—
0
3
—
—
—
0
2
1
—
California
3
5
11
12
29
—
1
7
11
2
3
2
8
10
5
Hawaii
—
0
2
—
—
N
0
0
N
N
—
0
1
—
—
Oregon
—
0
3
4
1
—
0
2
—
1
—
0
4
1
3
Washington
—
0
3
—
—
—
0
6
—
—
—
0
2
—
1
Territories
American Samoa
N
0
0
N
N
N
0
0
N
N
—
0
1
—
—
C.N.M.I.
—
—
—
—
—
—
—
—
—
—
—
—
—
—
—
Guam
—
0
0
—
—
—
0
0
—
—
—
0
0
—
—
Puerto Rico
—
0
0
—
—
N
0
0
N
N
—
0
0
—
—
U.S. Virgin Islands
—
0
0
—
—
—
0
0
—
—
—
0
0
—
—
C.N.M.I.: Commonwealth of Northern Mariana Islands.
U: Unavailable. —: No reported cases. N: Not reportable. NN: Not Nationally Notifiable. Cum: Cumulative year-to-date counts. Med: Median. Max: Maximum.
TABLE II. (Continued) Provisional cases of selected notifiable diseases, United States, weeks ending January 28, 2012, and January 29, 2011 (4th week)*
Reporting area
Meningococcal disease, invasive† All serogroups
Mumps
Pertussis
Current week
Previous 52 weeks
Cum 2012
Cum 2011
Current week
Previous 52 weeks
Cum 2012
Cum 2011
Current week
Previous 52 weeks
Cum 2012
Cum 2011
Med
Max
Med
Max
Med
Max
United States
6
12
30
34
62
1
7
19
9
23
130
309
525
710
1,389
New England
—
0
3
—
2
—
0
2
—
1
8
14
32
38
34
Connecticut
—
0
1
—
1
—
0
0
—
—
—
1
5
2
6
Maine
—
0
1
—
—
—
0
2
—
—
4
3
19
13
4
Massachusetts
—
0
2
—
1
—
0
1
—
1
—
4
10
—
16
New Hampshire
—
0
1
—
—
—
0
0
—
—
—
2
13
2
4
Rhode Island
—
0
1
—
—
—
0
2
—
—
—
0
4
1
4
Vermont
—
0
3
—
—
—
0
1
—
—
4
1
16
20
—
Mid. Atlantic
2
1
4
5
8
—
1
7
—
3
58
38
148
198
128
New Jersey
—
0
0
—
—
—
0
2
—
3
—
3
10
—
10
New York (Upstate)
1
0
4
1
—
—
0
3
—
—
43
13
123
107
38
New York City
—
0
2
2
6
—
0
6
—
—
—
3
42
11
—
Pennsylvania
1
0
2
2
2
—
0
1
—
—
15
13
38
80
80
E.N. Central
1
2
6
4
9
—
2
12
1
9
22
66
210
158
354
Illinois
—
0
3
—
1
—
1
10
—
3
—
18
121
18
70
Indiana
—
0
2
—
2
—
0
2
—
—
—
4
21
1
32
Michigan
—
0
1
—
2
—
0
2
—
1
1
10
38
9
84
Ohio
1
0
2
4
2
—
0
2
1
5
19
13
37
62
125
Wisconsin
—
0
1
—
2
—
0
1
—
—
2
12
53
68
43
W.N. Central
—
1
3
2
6
—
0
3
1
3
8
21
119
64
77
Iowa
—
0
1
—
1
—
0
2
—
—
—
4
9
4
20
Kansas
—
0
1
—
1
—
0
1
—
1
1
2
10
5
6
Minnesota
—
0
0
—
—
—
0
1
—
—
—
0
110
—
—
Missouri
—
0
3
2
2
—
0
3
1
1
7
7
27
54
41
Nebraska
—
0
2
—
2
—
0
1
—
1
—
1
5
1
9
North Dakota
—
0
1
—
—
—
0
3
—
—
—
0
10
—
—
South Dakota
—
0
1
—
—
—
0
0
—
—
—
0
7
—
1
S. Atlantic
1
2
8
5
5
—
1
4
2
—
15
26
67
71
145
Delaware
—
0
1
—
—
—
0
0
—
—
—
0
5
3
3
District of Columbia
—
0
1
—
—
—
0
1
—
—
—
0
2
1
1
Florida
1
1
5
3
2
—
0
2
1
—
8
6
17
26
20
Georgia
—
0
1
—
—
—
0
2
—
—
—
3
8
9
23
Maryland
—
0
2
2
—
—
0
1
1
—
4
2
8
12
14
North Carolina
—
0
3
—
2
—
0
2
—
—
—
3
35
4
24
South Carolina
—
0
1
—
1
—
0
1
—
—
1
2
9
1
22
Virginia
—
0
2
—
—
—
0
4
—
—
1
6
25
10
38
West Virginia
—
0
3
—
—
—
0
1
—
—
1
0
15
5
—
E.S. Central
—
0
3
—
4
—
0
1
—
2
10
9
15
43
57
Alabama
—
0
2
—
3
—
0
1
—
1
—
2
11
1
10
Kentucky
—
0
2
—
—
—
0
0
—
—
4
3
9
25
30
Mississippi
—
0
1
—
1
—
0
1
—
1
—
0
4
2
3
Tennessee
—
0
2
—
—
—
0
1
—
—
6
2
7
15
14
W.S. Central
—
1
5
1
4
1
1
12
1
3
4
19
66
16
33
Arkansas
—
0
2
—
1
—
0
2
—
—
—
1
5
—
2
Louisiana
—
0
2
1
2
—
0
0
—
—
—
0
3
—
4
Oklahoma
—
0
2
—
—
—
0
2
—
—
—
0
11
—
—
Texas
—
0
2
—
1
1
1
12
1
3
4
18
64
16
27
Mountain
—
1
4
—
5
—
0
2
1
1
3
39
82
98
185
Arizona
—
0
1
—
2
—
0
0
—
—
1
12
30
56
73
Colorado
—
0
1
—
1
—
0
1
1
—
—
7
25
17
45
Idaho
—
0
1
—
1
—
0
2
—
—
1
3
12
10
11
Montana
—
0
2
—
—
—
0
0
—
—
—
1
32
8
11
Nevada
—
0
1
—
—
—
0
0
—
—
1
0
4
4
3
New Mexico
—
0
1
—
—
—
0
1
—
1
—
3
24
3
4
Utah
—
0
2
—
1
—
0
0
—
—
—
6
15
—
37
Wyoming
—
0
0
—
—
—
0
1
—
—
—
0
1
—
1
Pacific
2
3
10
17
19
—
0
11
3
1
2
60
127
24
376
Alaska
—
0
1
—
—
—
0
1
—
—
1
0
4
5
8
California
1
2
9
14
14
—
0
11
3
—
1
36
78
9
347
Hawaii
—
0
1
—
1
—
0
1
—
—
—
1
9
7
3
Oregon
1
0
3
3
3
—
0
1
—
1
—
5
23
3
18
Washington
—
0
2
—
1
—
0
1
—
—
—
11
88
—
—
Territories
American Samoa
—
0
0
—
—
—
0
0
—
—
—
0
0
—
—
C.N.M.I.
—
—
—
—
—
—
—
—
—
—
—
—
—
—
—
Guam
—
0
0
—
—
—
1
3
—
—
—
2
14
—
—
Puerto Rico
—
0
0
—
—
—
0
1
—
—
—
0
1
—
1
U.S. Virgin Islands
—
0
0
—
—
—
0
0
—
—
—
0
0
—
—
C.N.M.I.: Commonwealth of Northern Mariana Islands.
U: Unavailable. —: No reported cases. N: Not reportable. NN: Not Nationally Notifiable. Cum: Cumulative year-to-date counts. Med: Median. Max: Maximum.
† Data for meningococcal disease, invasive caused by serogroups A, C, Y, and W-135; serogroup B; other serogroup; and unknown serogroup are available in Table I.
TABLE II. (Continued) Provisional cases of selected notifiable diseases, United States, weeks ending January 28, 2012, and January 29, 2011 (4th week)*
Reporting area
Rabies, animal
Salmonellosis
Shiga toxin-producing E. coli(STEC)†
Current week
Previous 52 weeks
Cum 2012
Cum 2011
Current week
Previous 52 weeks
Cum 2012
Cum 2011
Current week
Previous 52 weeks
Cum 2012
Cum 2011
Med
Max
Med
Max
Med
Max
United States
16
57
99
82
235
221
867
1,855
1,257
1,916
14
86
206
112
153
New England
—
5
16
19
8
—
36
107
23
87
—
3
13
1
6
Connecticut
—
2
10
5
2
—
8
30
8
26
—
1
4
1
2
Maine
—
1
6
9
1
—
2
8
5
4
—
0
3
—
—
Massachusetts
—
0
0
—
—
—
19
44
—
43
—
1
9
—
2
New Hampshire
—
0
3
2
1
—
3
8
4
10
—
0
3
—
2
Rhode Island
—
0
6
2
—
—
1
62
—
—
—
0
2
—
—
Vermont
—
0
2
1
4
—
1
8
6
4
—
0
3
—
—
Mid. Atlantic
2
16
35
11
52
7
72
172
102
165
1
9
28
15
17
New Jersey
—
0
0
—
—
—
0
3
—
—
—
0
0
—
—
New York (Upstate)
2
7
20
11
19
—
26
67
18
30
—
3
13
1
8
New York City
—
0
3
—
—
1
19
42
35
54
—
2
6
5
1
Pennsylvania
—
8
21
—
33
6
31
113
49
81
1
3
16
9
8
E.N. Central
1
2
17
2
4
10
88
184
93
243
2
15
51
16
39
Illinois
—
0
6
—
3
—
27
80
12
95
—
4
14
1
8
Indiana
—
0
7
—
—
—
8
27
4
22
—
1
10
—
8
Michigan
—
1
6
1
1
2
14
42
21
42
1
3
19
11
11
Ohio
1
1
5
1
—
8
20
46
50
56
1
3
10
4
4
Wisconsin
N
0
0
N
N
—
12
46
6
28
—
3
21
—
8
W.N. Central
1
1
7
5
1
13
40
103
71
91
2
11
40
19
11
Iowa
—
0
0
—
—
1
8
19
7
23
—
2
15
2
3
Kansas
—
1
4
4
1
4
8
27
23
16
—
2
8
3
2
Minnesota
—
0
0
—
—
—
0
0
—
—
—
0
0
—
—
Missouri
1
0
1
1
—
7
16
46
33
40
2
5
32
9
2
Nebraska
—
0
3
—
—
1
4
13
6
7
—
1
7
2
4
North Dakota
—
0
3
—
—
—
0
15
—
—
—
0
4
—
—
South Dakota
—
0
0
—
—
—
3
10
2
5
—
1
4
3
—
S. Atlantic
7
18
53
17
158
121
271
729
534
563
5
13
28
34
33
Delaware
—
0
0
—
—
1
3
12
6
9
—
0
2
1
—
District of Columbia
—
0
0
—
—
—
1
6
—
1
—
0
1
—
1
Florida
6
0
32
8
116
81
107
203
266
222
4
3
9
14
5
Georgia
—
0
0
—
—
6
40
132
51
92
—
2
8
3
6
Maryland
—
6
13
4
3
13
18
43
51
49
1
1
3
3
5
North Carolina
—
0
0
—
—
—
30
251
73
79
—
2
11
3
6
South Carolina
N
0
0
N
N
5
26
71
40
49
—
0
4
1
—
Virginia
—
11
27
—
39
9
19
53
39
62
—
3
9
9
10
West Virginia
1
0
30
5
—
6
0
18
8
—
—
0
2
—
—
E.S. Central
1
3
11
7
8
11
64
190
107
159
3
4
18
11
11
Alabama
1
2
7
6
4
3
20
70
30
55
—
0
15
2
2
Kentucky
—
0
2
1
1
1
11
30
17
21
2
1
5
3
2
Mississippi
—
0
1
—
—
2
22
66
32
33
—
0
4
3
1
Tennessee
—
1
4
—
3
5
15
51
28
50
1
1
11
3
6
W.S. Central
3
1
21
15
—
24
125
250
72
165
—
10
45
4
5
Arkansas
—
0
10
—
—
10
13
52
22
27
—
1
6
3
1
Louisiana
—
0
0
—
—
4
14
44
28
43
—
0
1
—
—
Oklahoma
—
0
21
4
—
6
12
31
11
14
—
1
10
1
2
Texas
3
0
4
11
—
4
88
157
11
81
—
7
45
—
2
Mountain
—
1
4
5
—
13
45
93
79
168
1
11
27
8
15
Arizona
N
0
0
N
N
9
15
35
40
55
—
1
7
1
2
Colorado
—
0
0
—
—
—
9
23
11
38
—
3
9
1
7
Idaho
—
0
1
—
—
2
3
8
3
14
1
1
8
2
4
Montana
N
0
0
N
N
1
2
10
5
3
—
1
4
—
—
Nevada
—
0
2
—
—
1
3
7
4
14
—
1
7
—
1
New Mexico
—
0
3
5
—
—
5
22
5
24
—
1
3
2
1
Utah
—
0
2
—
—
—
6
15
10
19
—
1
7
2
—
Wyoming
—
0
0
—
—
—
1
9
1
1
—
0
7
—
—
Pacific
1
4
13
1
4
22
92
174
176
275
—
10
29
4
16
Alaska
1
0
2
1
2
—
1
6
7
7
—
0
1
—
—
California
—
3
12
—
—
21
73
142
148
212
—
4
14
2
11
Hawaii
—
0
0
—
—
1
6
14
8
29
—
0
2
—
—
Oregon
—
0
2
—
2
—
6
12
12
24
—
1
11
2
4
Washington
—
0
0
—
—
—
9
29
1
3
—
2
13
—
1
Territories
American Samoa
N
0
0
N
N
—
0
0
—
—
—
0
0
—
—
C.N.M.I.
—
—
—
—
—
—
—
—
—
—
—
—
—
—
—
Guam
—
0
0
—
—
—
0
2
—
3
—
0
0
—
—
Puerto Rico
—
0
6
—
2
—
3
12
—
12
—
0
0
—
—
U.S. Virgin Islands
—
0
0
—
—
—
0
0
—
—
—
0
0
—
—
C.N.M.I.: Commonwealth of Northern Mariana Islands.
U: Unavailable. —: No reported cases. N: Not reportable. NN: Not Nationally Notifiable. Cum: Cumulative year-to-date counts. Med: Median. Max: Maximum.
† Includes E. coli O157:H7; Shiga toxin-positive, serogroup non-O157; and Shiga toxin-positive, not serogrouped.
TABLE II. (Continued) Provisional cases of selected notifiable diseases, United States, weeks ending January 28, 2012, and January 29, 2011 (4th week)*
Spotted Fever Rickettsiosis (including RMSF)†
Reporting area
Shigellosis
Confirmed
Probable
Current week
Previous 52 weeks
Cum 2012
Cum 2011
Current week
Previous 52 weeks
Cum 2012
Cum 2011
Current week
Previous 52 weeks
Cum 2012
Cum 2011
Med
Max
Med
Max
Med
Max
United States
116
245
348
561
636
—
3
15
4
7
—
30
140
17
18
New England
—
4
21
2
13
—
0
1
—
—
—
0
1
—
—
Connecticut
—
1
4
2
2
—
0
0
—
—
—
0
0
—
—
Maine
—
0
8
—
1
—
0
0
—
—
—
0
1
—
—
Massachusetts
—
3
20
—
9
—
0
0
—
—
—
0
1
—
—
New Hampshire
—
0
1
—
—
—
0
1
—
—
—
0
1
—
—
Rhode Island
—
0
3
—
—
—
0
0
—
—
—
0
1
—
—
Vermont
—
0
1
—
1
—
0
0
—
—
—
0
0
—
—
Mid. Atlantic
1
16
54
83
37
—
0
2
1
—
—
1
6
1
2
New Jersey
—
0
23
43
—
—
0
0
—
—
—
0
0
—
—
New York (Upstate)
—
5
34
6
10
—
0
1
—
—
—
0
2
—
—
New York City
1
7
28
29
18
—
0
0
—
—
—
0
3
—
2
Pennsylvania
—
2
13
5
9
—
0
2
1
—
—
0
3
1
—
E.N. Central
19
14
40
100
62
—
0
2
1
—
—
2
10
—
2
Illinois
—
4
16
—
24
—
0
1
—
—
—
1
4
—
1
Indiana
—
0
4
—
6
—
0
1
1
—
—
0
4
—
—
Michigan
1
3
11
15
11
—
0
1
—
—
—
0
1
—
—
Ohio
18
5
27
85
21
—
0
2
—
—
—
0
2
—
1
Wisconsin
—
0
0
—
—
—
0
0
—
—
—
0
0
—
—
W.N. Central
4
5
18
24
49
—
0
4
—
—
—
4
29
2
2
Iowa
—
0
3
—
2
—
0
0
—
—
—
0
2
—
—
Kansas
1
1
5
12
12
—
0
0
—
—
—
0
0
—
—
Minnesota
—
0
0
—
—
—
0
0
—
—
—
0
0
—
—
Missouri
3
3
14
11
33
—
0
3
—
—
—
4
29
2
2
Nebraska
—
0
2
1
1
—
0
3
—
—
—
0
1
—
—
North Dakota
—
0
0
—
—
—
0
1
—
—
—
0
0
—
—
South Dakota
—
0
2
—
1
—
0
1
—
—
—
0
0
—
—
S. Atlantic
28
74
134
120
206
—
1
8
—
3
—
6
57
10
6
Delaware
—
0
2
—
—
—
0
1
—
—
—
0
4
1
—
District of Columbia
—
0
5
—
3
—
0
1
—
—
—
0
1
—
—
Florida
24
50
98
90
135
—
0
1
—
1
—
0
2
3
—
Georgia
1
12
24
16
33
—
1
7
—
—
—
0
0
—
—
Maryland
2
2
7
6
5
—
0
1
—
1
—
0
2
—
—
North Carolina
—
3
19
4
18
—
0
4
—
1
—
0
49
3
4
South Carolina
—
1
54
2
6
—
0
2
—
—
—
0
2
—
1
Virginia
1
2
7
2
6
—
0
1
—
—
—
3
14
3
1
West Virginia
—
0
2
—
—
—
0
0
—
—
—
0
1
—
—
E.S. Central
30
18
51
88
41
—
0
2
—
—
—
4
25
2
2
Alabama
9
5
21
28
19
—
0
1
—
—
—
1
8
1
1
Kentucky
18
4
22
48
2
—
0
1
—
—
—
0
2
—
—
Mississippi
—
4
24
6
6
—
0
0
—
—
—
0
2
—
—
Tennessee
3
4
11
6
14
—
0
2
—
—
—
4
20
1
1
W.S. Central
23
54
119
80
83
—
0
3
—
—
—
2
51
1
—
Arkansas
2
2
7
3
3
—
0
3
—
—
—
1
51
—
—
Louisiana
—
4
21
9
14
—
0
0
—
—
—
0
2
1
—
Oklahoma
6
3
28
20
5
—
0
1
—
—
—
0
25
—
—
Texas
15
43
98
48
61
—
0
1
—
—
—
0
4
—
—
Mountain
5
14
41
23
65
—
0
3
1
4
—
1
7
—
4
Arizona
2
5
27
15
29
—
0
3
—
4
—
0
6
—
4
Colorado
—
1
8
1
12
—
0
0
—
—
—
0
1
—
—
Idaho
1
0
3
1
2
—
0
1
1
—
—
0
1
—
—
Montana
2
1
15
3
1
—
0
0
—
—
—
0
1
—
—
Nevada
—
0
4
1
5
—
0
0
—
—
—
0
1
—
—
New Mexico
—
2
7
1
12
—
0
0
—
—
—
0
0
—
—
Utah
—
1
4
1
4
—
0
0
—
—
—
0
1
—
—
Wyoming
—
0
1
—
—
—
0
0
—
—
—
0
2
—
—
Pacific
6
20
44
41
80
—
0
2
1
—
—
0
1
1
—
Alaska
—
0
2
2
—
N
0
0
N
N
N
0
0
N
N
California
6
15
41
36
71
—
0
2
1
—
—
0
1
1
—
Hawaii
—
1
3
—
5
N
0
0
N
N
N
0
0
N
N
Oregon
—
1
4
3
4
—
0
0
—
—
—
0
0
—
—
Washington
—
1
9
—
—
—
0
0
—
—
—
0
0
—
—
Territories
American Samoa
—
0
0
—
1
N
0
0
N
N
N
0
0
N
N
C.N.M.I.
—
—
—
—
—
—
—
—
—
—
—
—
—
—
—
Guam
—
0
1
—
—
N
0
0
N
N
N
0
0
N
N
Puerto Rico
—
0
0
—
—
N
0
0
N
N
N
0
0
N
N
U.S. Virgin Islands
—
0
0
—
—
—
0
0
—
—
—
0
0
—
—
C.N.M.I.: Commonwealth of Northern Mariana Islands.
U: Unavailable. —: No reported cases. N: Not reportable. NN: Not Nationally Notifiable. Cum: Cumulative year-to-date counts. Med: Median. Max: Maximum.
† Illnesses with similar clinical presentation that result from Spotted fever group rickettsia infections are reported as Spotted fever rickettsioses. Rocky Mountain spotted fever (RMSF) caused by Rickettsia rickettsii, is the most common and well-known spotted fever.
TABLE II. (Continued) Provisional cases of selected notifiable diseases, United States, weeks ending January 28, 2012, and January 29, 2011 (4th week)*
Reporting area
Streptococcus pneumoniae,† invasive disease
Syphilis, primary and secondary
All ages
Age <5
Current week
Previous 52 weeks
Cum 2012
Cum 2011
Current week
Previous 52 weeks
Cum 2012
Cum 2011
Current week
Previous 52 weeks
Cum 2012
Cum 2011
Med
Max
Med
Max
Med
Max
United States
161
251
464
997
1,494
11
20
41
64
85
76
263
316
441
913
New England
1
14
31
36
88
—
1
4
—
2
—
7
22
7
29
Connecticut
—
6
20
18
44
—
0
3
—
—
—
0
12
—
1
Maine
1
2
8
12
12
—
0
1
—
—
—
0
2
—
2
Massachusetts
—
0
3
—
4
—
0
2
—
2
—
5
10
6
19
New Hampshire
—
1
8
1
10
—
0
1
—
—
—
0
3
—
2
Rhode Island
—
1
6
—
14
—
0
1
—
—
—
0
7
1
5
Vermont
—
1
6
5
4
—
0
2
—
—
—
0
2
—
—
Mid. Atlantic
4
15
52
120
98
—
1
10
3
3
8
30
53
49
128
New Jersey
—
0
13
32
—
—
0
2
2
—
—
4
13
—
12
New York (Upstate)
—
2
30
49
8
—
1
10
1
3
3
4
9
10
11
New York City
4
12
24
39
90
—
0
9
—
—
—
14
24
17
77
Pennsylvania
N
0
0
N
N
N
0
0
N
N
5
7
17
22
28
E.N. Central
43
63
122
228
299
1
3
10
13
18
4
30
47
27
120
Illinois
N
0
0
N
N
—
0
0
—
—
3
11
24
16
51
Indiana
1
15
36
11
61
—
1
4
1
2
1
3
8
6
17
Michigan
4
13
26
47
64
—
0
2
2
6
—
4
12
1
19
Ohio
33
28
43
136
131
1
2
7
7
7
—
8
17
4
30
Wisconsin
5
8
23
34
43
—
0
2
3
3
—
1
5
—
3
W.N. Central
4
2
28
17
15
1
0
2
1
1
—
6
13
1
31
Iowa
N
0
0
N
N
N
0
0
N
N
—
0
3
1
—
Kansas
N
0
0
N
N
N
0
0
N
N
—
0
4
—
1
Minnesota
—
0
0
—
—
—
0
0
—
—
—
2
8
—
14
Missouri
N
0
0
N
N
—
0
0
—
—
—
2
8
—
15
Nebraska
4
2
9
17
15
1
0
2
1
1
—
0
2
—
1
North Dakota
—
0
25
—
—
—
0
1
—
—
—
0
0
—
—
South Dakota
N
0
0
N
N
—
0
0
—
—
—
0
0
—
—
S. Atlantic
53
65
143
297
500
5
5
15
19
31
24
69
100
141
192
Delaware
—
1
5
5
10
—
0
0
—
—
2
0
4
4
2
District of Columbia
—
1
5
1
5
—
0
1
1
1
7
3
8
19
10
Florida
23
21
55
115
214
3
2
8
8
13
7
23
36
55
94
Georgia
9
19
38
82
132
—
2
5
6
10
5
15
43
23
21
Maryland
6
9
29
27
72
1
1
3
1
5
1
8
20
10
19
North Carolina
N
0
0
N
N
N
0
0
N
N
—
8
21
19
18
South Carolina
6
8
22
44
67
—
0
3
—
2
—
4
11
—
13
Virginia
N
0
0
N
N
—
0
0
—
—
2
4
12
11
15
West Virginia
9
1
48
23
—
1
0
4
3
—
—
0
2
—
—
E.S. Central
15
23
45
97
131
—
2
4
7
13
3
15
30
17
39
Alabama
N
0
0
N
N
N
0
0
N
N
—
4
11
5
15
Kentucky
1
4
12
19
27
—
0
3
—
4
2
2
8
4
6
Mississippi
N
0
0
N
N
—
0
0
—
—
—
3
19
—
2
Tennessee
14
19
39
78
104
—
2
3
7
9
1
5
11
8
16
W.S. Central
32
31
118
101
145
3
3
10
11
6
18
36
50
91
119
Arkansas
4
4
14
17
26
—
0
4
2
2
—
3
10
—
11
Louisiana
1
2
11
15
27
—
0
2
2
1
1
7
25
13
8
Oklahoma
N
0
0
N
N
—
0
0
—
—
1
1
6
2
3
Texas
27
24
104
69
92
3
3
9
7
3
16
23
38
76
97
Mountain
8
26
72
94
206
—
3
8
6
11
1
12
20
6
39
Arizona
8
12
45
70
113
—
1
5
5
5
—
4
10
4
14
Colorado
—
9
23
10
45
—
0
4
—
1
—
2
6
1
8
Idaho
N
0
0
N
N
—
0
0
—
—
1
0
4
1
3
Montana
N
0
0
N
N
N
0
0
N
N
—
0
1
—
3
Nevada
N
0
0
N
N
N
0
0
N
N
—
2
9
—
8
New Mexico
—
4
12
14
27
—
0
2
1
1
—
1
4
—
2
Utah
—
1
8
—
18
—
0
3
—
4
—
0
2
—
1
Wyoming
—
0
3
—
3
—
0
0
—
—
—
0
0
—
—
Pacific
1
3
11
7
12
1
0
2
4
—
18
56
74
102
216
Alaska
1
2
11
7
12
1
0
2
4
—
—
0
2
1
—
California
N
0
0
N
N
N
0
0
N
N
12
44
62
84
187
Hawaii
—
0
1
—
—
—
0
1
—
—
—
0
3
—
—
Oregon
N
0
0
N
N
N
0
0
N
N
—
4
14
4
5
Washington
N
0
0
N
N
N
0
0
N
N
6
5
11
13
24
Territories
American Samoa
N
0
0
N
N
—
0
0
—
—
—
0
0
—
—
C.N.M.I.
—
—
—
—
—
—
—
—
—
—
—
—
—
—
—
Guam
—
0
0
—
—
—
0
0
—
—
—
0
0
—
—
Puerto Rico
—
0
0
—
—
—
0
0
—
—
6
4
15
12
11
U.S. Virgin Islands
—
0
0
—
—
—
0
0
—
—
—
0
0
—
—
C.N.M.I.: Commonwealth of Northern Mariana Islands.
U: Unavailable. —: No reported cases. N: Not reportable. NN: Not Nationally Notifiable. Cum: Cumulative year-to-date counts. Med: Median. Max: Maximum.
† Includes drug resistant and susceptible cases of invasive Streptococcus pneumoniae disease among children <5 years and among all ages. Case definition: Isolation of S. pneumoniae from a normally sterile body site (e.g., blood or cerebrospinal fluid).
TABLE II. (Continued) Provisional cases of selected notifiable diseases, United States, weeks ending January 28, 2012, and January 29, 2011 (4th week)*
Reporting area
Varicella (chickenpox)
West Nile virus disease†
Neuroinvasive
Nonneuroinvasive§
Current week
Previous 52 weeks
Cum 2012
Cum 2011
Current week
Previous 52 weeks
Cum 2012
Cum 2011
Current week
Previous 52 weeks
Cum 2012
Cum 2011
Med
Max
Med
Max
Med
Max
United States
163
259
344
663
1,040
—
0
60
—
1
—
0
31
—
—
New England
3
21
50
27
122
—
0
3
—
—
—
0
1
—
—
Connecticut
2
5
16
15
22
—
0
2
—
—
—
0
1
—
—
Maine
—
4
11
2
22
—
0
0
—
—
—
0
0
—
—
Massachusetts
—
9
18
—
44
—
0
2
—
—
—
0
1
—
—
New Hampshire
—
1
7
—
11
—
0
0
—
—
—
0
0
—
—
Rhode Island
1
0
6
1
2
—
0
1
—
—
—
0
0
—
—
Vermont
—
1
9
9
21
—
0
1
—
—
—
0
0
—
—
Mid. Atlantic
32
21
51
158
71
—
0
11
—
—
—
0
6
—
—
New Jersey
17
0
41
107
—
—
0
1
—
—
—
0
2
—
—
New York (Upstate)
N
0
0
N
N
—
0
5
—
—
—
0
4
—
—
New York City
—
0
0
—
—
—
0
4
—
—
—
0
1
—
—
Pennsylvania
15
19
39
51
71
—
0
2
—
—
—
0
1
—
—
E.N. Central
37
65
114
213
314
—
0
13
—
—
—
0
6
—
—
Illinois
2
18
38
59
65
—
0
6
—
—
—
0
5
—
—
Indiana
1
5
20
17
19
—
0
2
—
—
—
0
1
—
—
Michigan
10
18
44
49
104
—
0
7
—
—
—
0
1
—
—
Ohio
24
21
47
88
126
—
0
3
—
—
—
0
3
—
—
Wisconsin
—
0
1
—
—
—
0
1
—
—
—
0
1
—
—
W.N. Central
—
11
32
6
70
—
0
9
—
1
—
0
7
—
—
Iowa
N
0
0
N
N
—
0
2
—
—
—
0
2
—
—
Kansas
—
7
21
—
33
—
0
1
—
—
—
0
0
—
—
Minnesota
—
0
1
—
—
—
0
1
—
—
—
0
1
—
—
Missouri
—
3
14
5
35
—
0
2
—
1
—
0
2
—
—
Nebraska
—
0
2
—
—
—
0
4
—
—
—
0
3
—
—
North Dakota
—
0
7
—
1
—
0
1
—
—
—
0
1
—
—
South Dakota
—
1
6
1
1
—
0
0
—
—
—
0
1
—
—
S. Atlantic
36
36
66
94
107
—
0
10
—
—
—
0
5
—
—
Delaware
—
0
2
—
1
—
0
1
—
—
—
0
0
—
—
District of Columbia
—
0
2
—
2
—
0
3
—
—
—
0
3
—
—
Florida
36
17
38
81
61
—
0
5
—
—
—
0
2
—
—
Georgia
N
0
0
N
N
—
0
2
—
—
—
0
1
—
—
Maryland
N
0
0
N
N
—
0
5
—
—
—
0
3
—
—
North Carolina
N
0
0
N
N
—
0
1
—
—
—
0
0
—
—
South Carolina
—
0
9
—
—
—
0
0
—
—
—
0
0
—
—
Virginia
—
10
27
13
19
—
0
2
—
—
—
0
0
—
—
West Virginia
—
6
32
—
24
—
0
1
—
—
—
0
0
—
—
E.S. Central
—
5
15
13
24
—
0
11
—
—
—
0
5
—
—
Alabama
—
5
14
11
20
—
0
2
—
—
—
0
0
—
—
Kentucky
N
0
0
N
N
—
0
2
—
—
—
0
1
—
—
Mississippi
—
0
2
2
4
—
0
5
—
—
—
0
4
—
—
Tennessee
N
0
0
N
N
—
0
3
—
—
—
0
1
—
—
W.S. Central
52
53
137
110
109
—
0
4
—
—
—
0
3
—
—
Arkansas
—
5
26
4
7
—
0
1
—
—
—
0
0
—
—
Louisiana
—
2
6
1
5
—
0
1
—
—
—
0
2
—
—
Oklahoma
N
0
0
N
N
—
0
1
—
—
—
0
0
—
—
Texas
52
46
133
105
97
—
0
3
—
—
—
0
3
—
—
Mountain
1
22
68
40
201
—
0
11
—
—
—
0
5
—
—
Arizona
1
4
50
4
61
—
0
7
—
—
—
0
4
—
—
Colorado
—
7
32
22
61
—
0
2
—
—
—
0
2
—
—
Idaho
N
0
0
N
N
—
0
1
—
—
—
0
1
—
—
Montana
—
2
15
—
46
—
0
1
—
—
—
0
0
—
—
Nevada
N
0
0
N
N
—
0
4
—
—
—
0
2
—
—
New Mexico
—
1
5
6
6
—
0
1
—
—
—
0
0
—
—
Utah
—
3
26
7
26
—
0
1
—
—
—
0
1
—
—
Wyoming
—
0
1
1
1
—
0
1
—
—
—
0
1
—
—
Pacific
2
2
9
2
22
—
0
18
—
—
—
0
7
—
—
Alaska
1
1
4
1
8
—
0
0
—
—
—
0
0
—
—
California
—
0
4
—
7
—
0
18
—
—
—
0
7
—
—
Hawaii
1
0
4
1
7
—
0
0
—
—
—
0
0
—
—
Oregon
N
0
0
N
N
—
0
0
—
—
—
0
0
—
—
Washington
N
0
0
N
N
—
0
0
—
—
—
0
0
—
—
Territories
American Samoa
N
0
0
N
N
—
0
0
—
—
—
0
0
—
—
C.N.M.I.
—
—
—
—
—
—
—
—
—
—
—
—
—
—
—
Guam
—
2
4
—
1
—
0
0
—
—
—
0
0
—
—
Puerto Rico
—
2
10
—
16
—
0
0
—
—
—
0
0
—
—
U.S. Virgin Islands
—
0
0
—
—
—
0
0
—
—
—
0
0
—
—
C.N.M.I.: Commonwealth of Northern Mariana Islands.
U: Unavailable. —: No reported cases. N: Not reportable. NN: Not Nationally Notifiable. Cum: Cumulative year-to-date counts. Med: Median. Max: Maximum.
† Updated weekly from reports to the Division of Vector-Borne Infectious Diseases, National Center for Zoonotic, Vector-Borne, and Enteric Diseases (ArboNET Surveillance). Data for California serogroup, eastern equine, Powassan, St. Louis, and western equine diseases are available in Table I.
§ Not reportable in all states. Data from states where the condition is not reportable are excluded from this table, except starting in 2007 for the domestic arboviral diseases and influenza-associated pediatric mortality, and in 2003 for SARS-CoV. Reporting exceptions are available at http://www.cdc.gov/ncphi/disss/nndss/phs/infdis.htm.
TABLE III. Deaths in 122 U.S. cities,* week ending January 28, 2012 (4th week)
Reporting area
All causes, by age (years)
P&I† Total
Reporting area (Continued)
All causes, by age (years)
P&I† Total
All Ages
=65
45–64
25–44
1–24
<1
All Ages
=65
45–64
25–44
1–24
<1
New England
574
411
121
28
6
7
44
S. Atlantic
1,132
705
301
81
23
22
68
Boston, MA
138
87
38
8
4
—
13
Atlanta, GA
190
114
50
21
3
2
3
Bridgeport, CT
40
33
7
—
—
—
4
Baltimore, MD
144
76
53
11
3
1
11
Cambridge, MA
12
11
1
—
—
—
—
Charlotte, NC
152
98
43
6
3
2
9
Fall River, MA
35
30
4
1
—
—
2
Jacksonville, FL
12
6
4
2
—
—
—
Hartford, CT
57
37
13
4
2
1
4
Miami, FL
118
79
22
12
4
1
7
Lowell, MA
23
17
4
1
—
1
2
Norfolk, VA
50
34
11
2
1
2
2
Lynn, MA
12
6
3
2
—
1
1
Richmond, VA
65
35
22
5
2
1
5
New Bedford, MA
18
16
1
1
—
—
1
Savannah, GA
60
36
14
5
3
2
1
New Haven, CT
49
32
13
2
—
2
5
St. Petersburg, FL
69
45
19
3
1
1
5
Providence, RI
53
44
7
1
—
1
2
Tampa, FL
135
90
32
7
1
5
7
Somerville, MA
1
—
1
—
—
—
—
Washington, D.C.
122
82
29
5
2
4
17
Springfield, MA
34
26
4
3
—
1
2
Wilmington, DE
15
10
2
2
—
1
1
Waterbury, CT
41
28
11
2
—
—
3
E.S. Central
1,064
690
280
65
16
13
118
Worcester, MA
61
44
14
3
—
—
5
Birmingham, AL
239
144
73
15
5
2
25
Mid. Atlantic
1,942
1,346
443
82
31
40
99
Chattanooga, TN
87
62
18
4
—
3
4
Albany, NY
70
51
10
4
2
3
1
Knoxville, TN
103
73
22
6
2
—
18
Allentown, PA
29
24
4
—
—
1
1
Lexington, KY
83
55
23
4
—
1
11
Buffalo, NY
73
51
17
2
1
2
7
Memphis, TN
215
140
57
10
4
4
26
Camden, NJ
30
16
8
4
1
1
1
Mobile, AL
137
92
34
10
—
1
11
Elizabeth, NJ
14
7
5
—
—
2
—
Montgomery, AL
28
18
6
2
—
2
6
Erie, PA
68
53
12
3
—
—
4
Nashville, TN
172
106
47
14
5
—
17
Jersey City, NJ
26
16
10
—
—
—
1
W.S. Central
1,234
807
263
101
38
25
67
New York City, NY
1,104
774
257
45
15
13
53
Austin, TX
95
56
28
10
1
—
6
Newark, NJ
45
28
11
3
2
1
2
Baton Rouge, LA
68
39
15
8
4
2
—
Paterson, NJ
17
10
4
1
2
—
1
Corpus Christi, TX
69
45
14
5
2
3
3
Philadelphia, PA
113
69
20
10
3
11
4
Dallas, TX
212
137
52
14
5
4
16
Pittsburgh, PA§
50
32
15
2
—
1
3
El Paso, TX
95
64
25
3
2
1
3
Reading, PA
42
35
7
—
—
—
2
Fort Worth, TX
U
U
U
U
U
U
U
Rochester, NY
85
55
21
2
2
5
4
Houston, TX
116
65
18
13
13
7
8
Schenectady, NY
31
20
10
1
—
—
4
Little Rock, AR
87
59
20
5
2
1
1
Scranton, PA
32
25
6
1
—
—
3
New Orleans, LA
U
U
U
U
U
U
U
Syracuse, NY
51
42
8
—
1
—
5
San Antonio, TX
303
213
46
30
8
6
20
Trenton, NJ
28
16
8
2
2
—
2
Shreveport, LA
27
20
5
1
—
1
2
Utica, NY
14
10
3
1
—
—
—
Tulsa, OK
162
109
40
12
1
—
8
Yonkers, NY
20
12
7
1
—
—
1
Mountain
1,262
855
299
66
20
20
97
E.N. Central
2,319
1,556
558
129
38
38
188
Albuquerque, NM
141
103
24
9
4
1
16
Akron, OH
55
36
15
1
3
—
5
Boise, ID
58
39
16
2
—
1
6
Canton, OH
57
39
14
2
1
1
11
Colorado Springs, CO
80
55
18
3
2
2
2
Chicago, IL
251
157
70
12
8
4
19
Denver, CO
83
50
23
6
1
3
2
Cincinnati, OH
100
64
27
5
1
3
8
Las Vegas, NV
313
218
78
13
3
1
22
Cleveland, OH
337
244
67
21
3
2
21
Ogden, UT
42
33
6
2
—
1
9
Columbus, OH
292
196
62
15
8
11
28
Phoenix, AZ
193
103
66
12
4
8
16
Dayton, OH
146
102
31
11
1
1
16
Pueblo, CO
31
25
4
1
1
—
—
Detroit, MI
158
84
55
12
5
2
7
Salt Lake City, UT
132
97
24
9
1
1
7
Evansville, IN
39
30
7
1
—
1
6
Tucson, AZ
189
132
40
9
4
2
17
Fort Wayne, IN
84
58
21
4
1
—
4
Pacific
1,946
1,357
440
102
30
17
175
Gary, IN
12
5
5
1
1
—
—
Berkeley, CA
18
8
6
—
1
3
3
Grand Rapids, MI
51
38
9
4
—
—
8
Fresno, CA
122
84
31
6
1
—
10
Indianapolis, IN
239
141
70
18
1
9
19
Glendale, CA
31
24
3
4
—
—
7
Lansing, MI
49
35
11
2
—
1
4
Honolulu, HI
82
59
11
12
—
—
2
Milwaukee, WI
93
66
19
7
—
1
7
Long Beach, CA
99
66
26
4
3
—
11
Peoria, IL
58
45
12
—
1
—
5
Los Angeles, CA
279
187
69
15
4
4
30
Rockford, IL
67
51
14
2
—
—
6
Pasadena, CA
30
25
4
1
—
—
5
South Bend, IN
44
28
12
2
1
1
4
Portland, OR
139
96
33
7
3
—
9
Toledo, OH
110
71
27
8
3
1
7
Sacramento, CA
238
165
56
10
4
3
26
Youngstown, OH
77
66
10
1
—
—
3
San Diego, CA
186
128
46
5
3
4
16
W.N. Central
779
493
197
45
21
22
61
San Francisco, CA
109
78
23
6
1
1
9
Des Moines, IA
132
88
34
6
1
3
10
San Jose, CA
219
170
33
13
3
—
26
Duluth, MN
26
19
6
1
—
—
7
Santa Cruz, CA
41
32
7
1
—
1
2
Kansas City, KS
36
21
9
2
3
1
3
Seattle, WA
139
85
42
8
3
1
3
Kansas City, MO
105
70
24
8
3
—
4
Spokane, WA
60
43
15
1
1
—
3
Lincoln, NE
41
35
5
1
—
—
—
Tacoma, WA
154
107
35
9
3
—
13
Minneapolis, MN
72
33
28
5
1
5
7
Total¶
12,252
8,220
2,902
699
223
204
917
Omaha, NE
87
57
14
9
1
6
7
St. Louis, MO
135
70
40
8
10
6
8
St. Paul, MN
64
47
13
3
1
—
7
Wichita, KS
81
53
24
2
1
1
8
U: Unavailable. —: No reported cases.
* Mortality data in this table are voluntarily reported from 122 cities in the United States, most of which have populations of >100,000. A death is reported by the place of its occurrence and by the week that the death certificate was filed. Fetal deaths are not included.
† Pneumonia and influenza.
§ Because of changes in reporting methods in this Pennsylvania city, these numbers are partial counts for the current week. Complete counts will be available in 4 to 6 weeks.