Persons using assistive technology might not be able to fully access information in this file. For assistance, please send e-mail to: mmwrq@cdc.gov. Type 508 Accommodation and the title of the report in the subject line of e-mail.
Notifiable Diseases and Mortality Tables
Table I Summary of provisional cases of selected notifiable diseases, United States, cumulative, week ending February 4, 2012 (5th Week)
Figure I Selected notifiable disease reports, United States, comparison of provisional 4-week totals ending February 4, 2012, with historical data
Table II Provisional cases of selected notifiable diseases, United States, weeks ending February 4, 2012 and February 5, 2011 (5th Week)
Table III Deaths in 122 U.S. cities, week ending February 4, 2012 (5th Week)
TABLE I. Provisional cases of infrequently reported notifiable diseases (<1,000 cases reported during the preceding year) — United States, week ending February 4, 2012 (5th week)*
TABLE I. (Continued) Provisional cases of infrequently reported notifiable diseases (<1,000 cases reported during the preceding year) — United States, week ending February 4, 2012 (5th week)*
—: No reported cases. N: Not reportable. NN: Not Nationally Notifiable. Cum: Cumulative year-to-date counts.
§ Not reportable in all states. Data from states where the condition is not reportable are excluded from this table except starting in 2007 for the arboviral diseases, STD data, TB data, and influenza-associated pediatric mortality, and in 2003 for SARS-CoV. Reporting exceptions are available at http://www.cdc.gov/osels/ph_surveillance/nndss/phs/infdis.htm.
¶ Includes both neuroinvasive and nonneuroinvasive. Updated weekly from reports to the Division of Vector-Borne Infectious Diseases, National Center for Zoonotic, Vector-Borne, and Enteric Diseases (ArboNET Surveillance). Data for West Nile virus are available in Table II.
** Data for H. influenzae (all ages, all serotypes) are available in Table II.
†† Updated weekly from reports to the Influenza Division, National Center for Immunization and Respiratory Diseases. Since October 2, 2011, two influenza-associated pediatric deaths occurring during the 2011-12 influenza season have been reported.
§§ No measles cases were reported for the current week.
¶¶ Data for meningococcal disease (all serogroups) are available in Table II.
*** CDC discontinued reporting of individual confirmed and probable cases of 2009 pandemic influenza A (H1N1) virus infections on July 24, 2009. During 2009, four cases of human infection with novel influenza A viruses, different from the 2009 pandemic influenza A (H1N1) strain, were reported to CDC. The four cases of novel influenza A virus infection reported to CDC during 2010, and the eight cases reported during 2011, were identified as swine influenza A (H3N2) virus and are unrelated to the 2009 pandemic influenza A (H1N1) virus. Total case counts are provided by the Influenza Division, National Center for Immunization and Respiratory Diseases (NCIRD).
††† No rubella cases were reported for the current week.
§§§ Updated weekly from reports to the Division of STD Prevention, National Center for HIV/AIDS, Viral Hepatitis, STD, and TB Prevention.
¶¶¶ There were no cases of viral hemorrhagic fever reported during the current week. See Table II for dengue hemorrhagic fever.
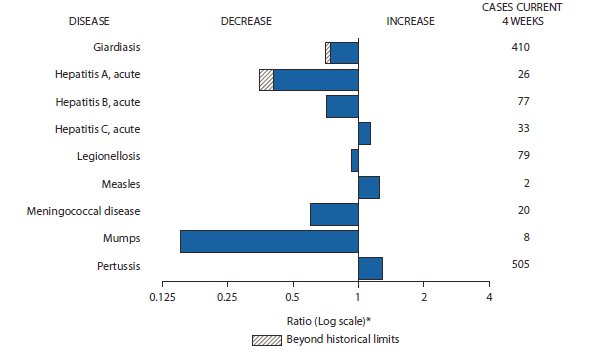
FIGURE I. Selected notifiable disease reports, United States, comparison of provisional 4-week totals February 4, 2012, with historical data
* Ratio of current 4-week total to mean of 15 4-week totals (from previous, comparable, and subsequent 4-week periods for the past 5 years). The point where the hatched area begins is based on the mean and two standard deviations of these 4-week totals.
Alternate Text: The figure above shows selected notifiable disease reports for the United States, with comparison of provisional 4-week totals through February 4, 2012, with historical data. Reports of acute hepatitis C, measles, and pertussis all increased. Reports of giardiasis, acute hepatitis A, acute hepatitis B, legionellosis, meningococcal disease, and mumps all decreased, with giardiasis and acute hepatitis A decreasing beyond historical limits.
TABLE II. Provisional cases of selected notifiable diseases, United States, weeks ending February 4, 2012, and February 5, 2011 (5th week)*
Reporting area
Chlamydia trachomatis infection
Coccidioidomycosis
Cryptosporidiosis
Current week
Previous 52 weeks
Cum 2012
Cum 2011
Current week
Previous 52 weeks
Cum 2012
Cum 2011
Current week
Previous 52 weeks
Cum 2012
Cum 2011
Med
Max
Med
Max
Med
Max
United States
12,343
26,750
30,790
81,960
124,475
93
390
585
911
2,288
50
133
397
342
439
New England
685
892
1,594
2,505
3,089
—
0
1
—
—
—
6
22
11
25
Connecticut
—
240
869
—
121
—
0
0
—
—
—
1
9
4
7
Maine
61
58
100
284
288
—
0
0
—
—
—
1
4
1
4
Massachusetts
435
427
860
1,615
1,924
—
0
0
—
—
—
2
8
—
11
New Hampshire
2
58
90
12
288
—
0
1
—
—
—
1
5
2
1
Rhode Island
143
80
188
550
360
—
0
0
—
—
—
0
1
—
—
Vermont
44
26
84
44
108
—
0
0
—
—
—
1
5
4
2
Mid. Atlantic
1,885
3,216
3,954
13,022
15,126
—
0
1
—
—
11
14
43
38
47
New Jersey
121
540
1,004
2,160
2,129
—
0
0
—
—
—
0
1
1
—
New York (Upstate)
760
715
1,715
2,663
2,774
—
0
0
—
—
6
4
16
11
8
New York City
243
1,067
1,315
3,307
5,465
—
0
0
—
—
1
1
6
6
7
Pennsylvania
761
1,015
1,601
4,892
4,758
—
0
1
—
—
4
9
27
20
32
E.N. Central
1,201
4,123
4,594
11,697
22,091
—
1
5
4
4
8
32
147
87
110
Illinois
34
1,149
1,387
1,981
5,870
—
0
0
—
—
—
3
26
1
11
Indiana
237
550
720
1,706
3,277
—
0
0
—
—
—
3
14
—
19
Michigan
545
919
1,229
3,557
5,257
—
0
3
1
1
1
6
14
15
26
Ohio
241
1,020
1,182
2,848
5,270
—
0
2
3
3
7
11
95
54
35
Wisconsin
144
461
543
1,605
2,417
—
0
0
—
—
—
8
65
17
19
W.N. Central
6
1,497
1,818
1,577
7,242
—
0
2
—
—
2
16
87
25
53
Iowa
6
211
422
1,011
1,091
—
0
0
—
—
—
6
19
8
17
Kansas
—
208
281
80
961
—
0
0
—
—
—
0
11
1
—
Minnesota
—
316
401
—
1,714
—
0
0
—
—
—
0
0
—
—
Missouri
—
534
759
—
2,422
—
0
0
—
—
2
5
63
10
14
Nebraska
—
127
215
272
467
—
0
2
—
—
—
2
12
2
17
North Dakota
—
43
64
5
206
—
0
0
—
—
—
0
12
—
—
South Dakota
—
62
89
209
381
—
0
0
—
—
—
2
13
4
5
S. Atlantic
3,690
5,400
7,453
21,230
25,203
—
0
2
—
—
15
22
58
82
91
Delaware
99
86
182
344
351
—
0
0
—
—
—
0
1
1
1
District of Columbia
—
110
216
487
516
—
0
0
—
—
—
0
1
—
1
Florida
899
1,509
1,690
6,431
7,327
—
0
0
—
—
6
8
17
35
34
Georgia
653
1,023
1,569
4,117
4,677
—
0
0
—
—
1
5
11
12
19
Maryland
277
479
790
938
1,887
—
0
2
—
—
3
1
7
14
4
North Carolina
762
1,000
1,688
4,832
3,733
—
0
0
—
—
—
0
44
—
9
South Carolina
—
528
1,344
—
2,341
—
0
0
—
—
3
2
6
10
14
Virginia
856
659
1,787
3,601
3,913
—
0
1
—
—
2
2
8
9
9
West Virginia
144
81
137
480
458
—
0
0
—
—
—
0
5
1
—
E.S. Central
1,323
1,900
2,804
5,522
8,506
—
0
0
—
—
3
8
25
19
12
Alabama
632
532
1,566
1,700
2,717
—
0
0
—
—
1
2
7
7
7
Kentucky
367
301
557
1,257
853
—
0
0
—
—
1
2
17
2
3
Mississippi
—
403
845
—
2,061
—
0
0
—
—
—
1
4
3
1
Tennessee
324
600
755
2,565
2,875
—
0
0
—
—
1
2
6
7
1
W.S. Central
1,581
3,346
4,313
10,423
15,427
—
0
1
—
—
5
8
44
24
15
Arkansas
—
309
440
—
1,578
—
0
0
—
—
—
0
2
1
—
Louisiana
195
364
1,071
1,294
1,862
—
0
1
—
—
—
1
9
6
2
Oklahoma
140
130
675
489
674
—
0
0
—
—
2
2
6
4
2
Texas
1,246
2,408
3,113
8,640
11,313
—
0
0
—
—
3
5
40
13
11
Mountain
791
1,758
2,406
5,371
8,020
74
306
457
775
1,736
1
10
29
23
54
Arizona
132
548
782
2,407
2,624
71
302
454
764
1,709
1
1
4
1
3
Colorado
469
415
846
1,512
1,857
—
0
0
—
—
—
2
11
—
14
Idaho
70
85
259
276
396
—
0
0
—
—
—
1
9
10
6
Montana
72
66
88
354
318
—
0
2
—
—
—
1
6
5
3
Nevada
31
203
380
182
1,067
1
2
5
7
11
—
0
2
2
1
New Mexico
—
209
482
—
894
—
1
4
—
11
—
2
9
4
15
Utah
6
133
190
532
654
—
0
4
2
3
—
1
5
—
6
Wyoming
11
32
67
108
210
2
0
1
2
2
—
0
5
1
6
Pacific
1,181
4,010
5,428
10,613
19,771
19
89
151
132
548
5
11
21
33
32
Alaska
38
109
157
492
610
—
0
0
—
—
—
0
3
—
—
California
736
3,002
4,499
7,480
15,107
19
89
151
132
547
3
6
16
27
14
Hawaii
—
114
142
—
555
—
0
0
—
—
1
0
1
2
—
Oregon
—
273
412
1,095
1,260
—
0
1
—
1
1
2
8
4
16
Washington
407
438
611
1,546
2,239
—
0
0
—
—
—
1
9
—
2
Territories
American Samoa
—
0
0
—
—
—
0
0
—
—
N
0
0
N
N
C.N.M.I.
—
—
—
—
—
—
—
—
—
—
—
—
—
—
—
Guam
—
16
44
—
26
—
0
0
—
—
—
0
0
—
—
Puerto Rico
256
102
348
570
541
—
0
0
—
—
N
0
0
N
N
U.S. Virgin Islands
—
16
27
—
70
—
0
0
—
—
—
0
0
—
—
C.N.M.I.: Commonwealth of Northern Mariana Islands.
U: Unavailable. —: No reported cases. N: Not reportable. NN: Not Nationally Notifiable. Cum: Cumulative year-to-date counts. Med: Median. Max: Maximum.
TABLE II. (Continued) Provisional cases of selected notifiable diseases, United States, weeks ending February 4, 2012, and February 5, 2011 (5th week)*
Reporting area
Dengue Virus Infection
Dengue Fever†
Dengue Hemorrhagic Fever§
Current week
Previous 52 weeks
Cum 2012
Cum 2011
Current week
Previous 52 weeks
Cum 2012
Cum 2011
Med
Max
Med
Max
United States
—
2
16
—
25
—
0
1
—
—
New England
—
0
1
—
—
—
0
0
—
—
Connecticut
—
0
0
—
—
—
0
0
—
—
Maine
—
0
0
—
—
—
0
0
—
—
Massachusetts
—
0
0
—
—
—
0
0
—
—
New Hampshire
—
0
0
—
—
—
0
0
—
—
Rhode Island
—
0
0
—
—
—
0
0
—
—
Vermont
—
0
1
—
—
—
0
0
—
—
Mid. Atlantic
—
1
6
—
7
—
0
0
—
—
New Jersey
—
0
0
—
—
—
0
0
—
—
New York (Upstate)
—
0
0
—
—
—
0
0
—
—
New York City
—
0
4
—
4
—
0
0
—
—
Pennsylvania
—
0
2
—
3
—
0
0
—
—
E.N. Central
—
0
2
—
4
—
0
1
—
—
Illinois
—
0
1
—
—
—
0
1
—
—
Indiana
—
0
1
—
1
—
0
0
—
—
Michigan
—
0
1
—
1
—
0
0
—
—
Ohio
—
0
1
—
—
—
0
0
—
—
Wisconsin
—
0
1
—
2
—
0
0
—
—
W.N. Central
—
0
2
—
—
—
0
0
—
—
Iowa
—
0
1
—
—
—
0
0
—
—
Kansas
—
0
1
—
—
—
0
0
—
—
Minnesota
—
0
1
—
—
—
0
0
—
—
Missouri
—
0
0
—
—
—
0
0
—
—
Nebraska
—
0
0
—
—
—
0
0
—
—
North Dakota
—
0
1
—
—
—
0
0
—
—
South Dakota
—
0
0
—
—
—
0
0
—
—
S. Atlantic
—
1
8
—
7
—
0
1
—
—
Delaware
—
0
2
—
—
—
0
0
—
—
District of Columbia
—
0
0
—
—
—
0
0
—
—
Florida
—
1
7
—
4
—
0
0
—
—
Georgia
—
0
1
—
1
—
0
0
—
—
Maryland
—
0
2
—
—
—
0
0
—
—
North Carolina
—
0
1
—
1
—
0
0
—
—
South Carolina
—
0
1
—
—
—
0
0
—
—
Virginia
—
0
1
—
1
—
0
1
—
—
West Virginia
—
0
0
—
—
—
0
0
—
—
E.S. Central
—
0
3
—
—
—
0
0
—
—
Alabama
—
0
1
—
—
—
0
0
—
—
Kentucky
—
0
1
—
—
—
0
0
—
—
Mississippi
—
0
0
—
—
—
0
0
—
—
Tennessee
—
0
2
—
—
—
0
0
—
—
W.S. Central
—
0
2
—
—
—
0
0
—
—
Arkansas
—
0
0
—
—
—
0
0
—
—
Louisiana
—
0
1
—
—
—
0
0
—
—
Oklahoma
—
0
0
—
—
—
0
0
—
—
Texas
—
0
1
—
—
—
0
0
—
—
Mountain
—
0
1
—
2
—
0
0
—
—
Arizona
—
0
1
—
1
—
0
0
—
—
Colorado
—
0
0
—
—
—
0
0
—
—
Idaho
—
0
0
—
—
—
0
0
—
—
Montana
—
0
0
—
—
—
0
0
—
—
Nevada
—
0
1
—
—
—
0
0
—
—
New Mexico
—
0
1
—
1
—
0
0
—
—
Utah
—
0
1
—
—
—
0
0
—
—
Wyoming
—
0
0
—
—
—
0
0
—
—
Pacific
—
0
4
—
5
—
0
0
—
—
Alaska
—
0
0
—
—
—
0
0
—
—
California
—
0
2
—
3
—
0
0
—
—
Hawaii
—
0
4
—
—
—
0
0
—
—
Oregon
—
0
0
—
—
—
0
0
—
—
Washington
—
0
1
—
2
—
0
0
—
—
Territories
American Samoa
—
0
0
—
—
—
0
0
—
—
C.N.M.I.
—
—
—
—
—
—
—
—
—
—
Guam
—
0
0
—
—
—
0
0
—
—
Puerto Rico
—
16
83
—
103
—
0
3
—
1
U.S. Virgin Islands
—
0
0
—
—
—
0
0
—
—
C.N.M.I.: Commonwealth of Northern Mariana Islands.
U: Unavailable. —: No reported cases. N: Not reportable. NN: Not Nationally Notifiable. Cum: Cumulative year-to-date counts. Med: Median. Max: Maximum.
† Dengue Fever includes cases that meet criteria for Dengue Fever with hemorrhage, other clinical and unknown case classifications.
§ DHF includes cases that meet criteria for dengue shock syndrome (DSS), a more severe form of DHF.
TABLE II. (Continued) Provisional cases of selected notifiable diseases, United States, weeks ending February 4, 2012, and February 5, 2011 (5th week)*
Reporting area
Ehrlichiosis/Anaplasmosis†
Ehrlichia chaffeensis
Anaplasma phagocytophilum
Undetermined
Current week
Previous 52 weeks
Cum 2012
Cum 2011
Current week
Previous 52 weeks
Cum 2012
Cum 2011
Current week
Previous 52 weeks
Cum 2012
Cum 2011
Med
Max
Med
Max
Med
Max
United States
2
9
93
5
9
2
15
57
6
9
—
2
9
2
2
New England
—
0
1
—
—
—
3
28
1
3
—
0
1
—
—
Connecticut
—
0
0
—
—
—
0
0
—
—
—
0
0
—
—
Maine
—
0
1
—
—
—
0
3
1
1
—
0
0
—
—
Massachusetts
—
0
0
—
—
—
1
18
—
—
—
0
0
—
—
New Hampshire
—
0
1
—
—
—
0
4
—
—
—
0
1
—
—
Rhode Island
—
0
1
—
—
—
0
15
—
2
—
0
1
—
—
Vermont
—
0
0
—
—
—
0
1
—
—
—
0
0
—
—
Mid. Atlantic
—
1
5
—
1
2
6
35
4
3
—
0
2
—
—
New Jersey
—
0
0
—
—
—
0
0
—
—
—
0
0
—
—
New York (Upstate)
—
0
4
—
—
2
3
35
3
2
—
0
2
—
—
New York City
—
0
2
—
1
—
1
5
1
1
—
0
0
—
—
Pennsylvania
—
0
0
—
—
—
0
1
—
—
—
0
0
—
—
E.N. Central
—
0
5
—
1
—
0
2
—
1
—
0
6
—
2
Illinois
—
0
4
—
—
—
0
2
—
—
—
0
1
—
1
Indiana
—
0
0
—
—
—
0
0
—
—
—
0
4
—
1
Michigan
—
0
2
—
—
—
0
0
—
—
—
0
2
—
—
Ohio
—
0
1
—
1
—
0
1
—
—
—
0
1
—
—
Wisconsin
—
0
0
—
—
—
0
1
—
1
—
0
1
—
—
W.N. Central
—
1
19
1
—
—
0
8
—
—
—
0
7
—
—
Iowa
N
0
0
N
N
N
0
0
N
N
N
0
0
N
N
Kansas
—
0
2
—
—
—
0
1
—
—
—
0
1
—
—
Minnesota
—
0
0
—
—
—
0
1
—
—
—
0
0
—
—
Missouri
—
1
19
1
—
—
0
7
—
—
—
0
7
—
—
Nebraska
—
0
1
—
—
—
0
1
—
—
—
0
0
—
—
North Dakota
N
0
0
N
N
N
0
0
N
N
N
0
0
N
N
South Dakota
—
0
1
—
—
—
0
1
—
—
—
0
0
—
—
S. Atlantic
2
3
33
4
7
—
1
8
1
2
—
0
2
2
—
Delaware
—
0
2
—
1
—
0
1
—
—
—
0
0
—
—
District of Columbia
N
0
0
N
N
N
0
0
N
N
N
0
0
N
N
Florida
—
0
3
—
1
—
0
3
—
—
—
0
0
—
—
Georgia
1
0
3
3
1
—
0
2
1
—
—
0
1
1
—
Maryland
—
0
3
—
2
—
0
2
—
—
—
0
1
1
—
North Carolina
1
0
17
1
2
—
0
6
—
2
—
0
0
—
—
South Carolina
—
0
1
—
—
—
0
0
—
—
—
0
1
—
—
Virginia
—
1
13
—
—
—
0
3
—
—
—
0
1
—
—
West Virginia
—
0
1
—
—
—
0
0
—
—
—
0
1
—
—
E.S. Central
—
1
8
—
—
—
0
2
—
—
—
0
3
—
—
Alabama
—
0
2
—
—
—
0
1
—
—
N
0
0
N
N
Kentucky
—
0
3
—
—
—
0
0
—
—
—
0
0
—
—
Mississippi
—
0
1
—
—
—
0
1
—
—
—
0
0
—
—
Tennessee
—
0
5
—
—
—
0
1
—
—
—
0
3
—
—
W.S. Central
—
0
30
—
—
—
0
3
—
—
—
0
0
—
—
Arkansas
—
0
13
—
—
—
0
3
—
—
—
0
0
—
—
Louisiana
—
0
0
—
—
—
0
0
—
—
—
0
0
—
—
Oklahoma
—
0
25
—
—
—
0
1
—
—
—
0
0
—
—
Texas
—
0
1
—
—
—
0
1
—
—
—
0
0
—
—
Mountain
—
0
0
—
—
—
0
0
—
—
—
0
1
—
—
Arizona
—
0
0
—
—
—
0
0
—
—
—
0
1
—
—
Colorado
N
0
0
N
N
N
0
0
N
N
N
0
0
N
N
Idaho
N
0
0
N
N
N
0
0
N
N
N
0
0
N
N
Montana
N
0
0
N
N
N
0
0
N
N
N
0
0
N
N
Nevada
N
0
0
N
N
N
0
0
N
N
N
0
0
N
N
New Mexico
N
0
0
N
N
N
0
0
N
N
N
0
0
N
N
Utah
—
0
0
—
—
—
0
0
—
—
—
0
1
—
—
Wyoming
—
0
0
—
—
—
0
0
—
—
—
0
0
—
—
Pacific
—
0
0
—
—
—
0
1
—
—
—
0
2
—
—
Alaska
N
0
0
N
N
N
0
0
N
N
N
0
0
N
N
California
—
0
0
—
—
—
0
0
—
—
—
0
2
—
—
Hawaii
N
0
0
N
N
N
0
0
N
N
N
0
0
N
N
Oregon
—
0
0
—
—
—
0
1
—
—
—
0
0
—
—
Washington
—
0
0
—
—
—
0
0
—
—
—
0
0
—
—
Territories
American Samoa
N
0
0
N
N
N
0
0
N
N
N
0
0
N
N
C.N.M.I.
—
—
—
—
—
—
—
—
—
—
—
—
—
—
—
Guam
N
0
0
N
N
N
0
0
N
N
N
0
0
N
N
Puerto Rico
N
0
0
N
N
N
0
0
N
N
N
0
0
N
N
U.S. Virgin Islands
—
0
0
—
—
—
0
0
—
—
—
0
0
—
—
C.N.M.I.: Commonwealth of Northern Mariana Islands.
U: Unavailable. —: No reported cases. N: Not reportable. NN: Not Nationally Notifiable. Cum: Cumulative year-to-date counts. Med: Median. Max: Maximum.
† Cumulative total E. ewingii cases reported for year 2011 = 14, and 0 case reports for 2012.
TABLE II. (Continued) Provisional cases of selected notifiable diseases, United States, weeks ending February 4, 2012, and February 5, 2011 (5th week)*
Reporting area
Giardiasis
Gonorrhea
Haemophilus influenzae, invasive† All ages, all serotypes
Current week
Previous 52 weeks
Cum 2012
Cum 2011
Current week
Previous 52 weeks
Cum 2012
Cum 2011
Current week
Previous 52 weeks
Cum 2012
Cum 2011
Med
Max
Med
Max
Med
Max
United States
110
278
449
759
1,195
2,841
6,009
6,726
20,090
29,208
32
65
96
261
359
New England
2
27
64
24
114
66
108
178
275
374
1
4
9
11
23
Connecticut
—
4
10
7
20
—
45
101
—
146
—
1
4
7
7
Maine
1
3
10
7
8
6
5
18
37
10
—
0
2
2
5
Massachusetts
—
12
29
—
67
52
47
80
184
194
—
2
4
—
8
New Hampshire
—
2
8
3
7
1
2
7
4
7
—
0
2
1
1
Rhode Island
—
0
10
2
6
7
7
35
50
15
1
0
2
1
1
Vermont
1
3
19
5
6
—
0
6
—
2
—
0
2
—
1
Mid. Atlantic
29
54
90
133
223
425
745
916
3,203
3,484
9
15
28
76
68
New Jersey
—
0
0
—
—
28
150
232
602
623
—
2
6
1
13
New York (Upstate)
16
21
50
38
66
128
115
319
478
424
6
3
14
16
11
New York City
6
16
29
62
85
59
241
315
767
1,230
—
4
10
22
11
Pennsylvania
7
15
30
33
72
210
264
492
1,356
1,207
3
5
14
37
33
E.N. Central
13
47
84
122
222
347
1,056
1,271
3,213
5,990
4
11
22
30
67
Illinois
—
10
19
3
44
5
290
391
508
1,501
—
3
11
1
20
Indiana
—
6
13
2
29
66
132
169
444
911
—
2
6
2
7
Michigan
1
10
21
34
49
152
235
371
1,022
1,481
—
1
4
5
8
Ohio
12
15
30
61
62
75
314
403
860
1,647
4
4
7
21
22
Wisconsin
—
8
19
22
38
49
90
118
379
450
—
1
4
1
10
W.N. Central
9
20
52
78
97
4
313
377
308
1,411
1
2
10
6
11
Iowa
1
4
15
22
26
4
37
108
204
176
—
0
1
—
—
Kansas
—
2
9
2
9
—
42
65
23
187
—
0
2
1
—
Minnesota
—
0
0
—
—
—
44
61
—
190
—
0
0
—
—
Missouri
6
8
23
34
34
—
149
204
—
674
1
1
5
3
7
Nebraska
2
3
11
17
18
—
28
52
63
108
—
0
2
2
4
North Dakota
—
0
12
—
—
—
4
9
—
22
—
0
6
—
—
South Dakota
—
1
8
3
10
—
11
20
18
54
—
0
1
—
—
S. Atlantic
31
52
105
193
222
973
1,490
1,947
5,775
6,890
11
14
31
74
86
Delaware
—
0
3
—
1
29
15
35
79
81
—
0
2
—
—
District of Columbia
—
1
5
1
6
—
38
105
202
205
—
0
1
—
—
Florida
25
23
69
86
126
223
374
472
1,650
1,911
4
4
12
19
30
Georgia
—
11
51
62
37
190
312
461
1,232
1,464
2
2
6
12
20
Maryland
5
6
14
25
20
86
118
176
293
515
4
2
6
15
11
North Carolina
N
0
0
N
N
250
334
548
1,480
1,284
—
1
7
6
6
South Carolina
—
2
8
10
7
—
152
421
—
688
—
1
5
10
4
Virginia
1
5
12
9
25
177
122
353
780
646
—
2
8
7
15
West Virginia
—
0
8
—
—
18
14
29
59
96
1
0
5
5
—
E.S. Central
2
3
9
14
9
343
514
789
1,518
2,421
4
3
12
21
23
Alabama
2
3
9
14
9
164
166
408
490
875
—
1
3
5
7
Kentucky
N
0
0
N
N
84
77
151
331
226
—
1
4
4
5
Mississippi
N
0
0
N
N
—
111
258
—
603
2
0
3
5
2
Tennessee
N
0
0
N
N
95
149
222
697
717
2
2
8
7
9
W.S. Central
4
5
15
27
20
336
877
1,175
2,722
4,134
—
2
10
12
22
Arkansas
4
3
8
11
3
—
87
138
—
466
—
0
3
2
3
Louisiana
—
2
10
16
17
54
120
255
370
532
—
1
4
5
10
Oklahoma
—
0
0
—
—
32
33
196
119
242
—
1
9
5
9
Texas
N
0
0
N
N
250
589
832
2,233
2,894
—
0
1
—
—
Mountain
2
22
41
30
99
92
202
323
686
1,054
1
5
10
17
36
Arizona
1
2
6
5
10
39
86
132
466
370
—
1
6
6
15
Colorado
—
7
23
10
27
47
39
89
166
278
—
1
4
—
10
Idaho
1
3
9
5
18
—
3
14
3
10
1
0
2
1
2
Montana
—
2
5
2
2
1
1
4
6
12
—
0
1
1
1
Nevada
—
1
7
4
7
4
39
103
20
193
—
0
2
2
2
New Mexico
—
1
6
1
9
—
33
73
—
157
—
1
3
4
5
Utah
—
3
9
2
24
1
5
10
21
25
—
0
3
2
1
Wyoming
—
0
5
1
2
—
0
3
4
9
—
0
1
1
—
Pacific
18
47
156
138
189
255
633
757
2,390
3,450
1
3
9
14
23
Alaska
—
2
7
5
7
8
19
31
66
99
1
0
3
1
4
California
12
33
51
106
135
193
520
610
2,043
2,871
—
1
5
4
6
Hawaii
—
1
3
1
1
—
12
24
—
67
—
0
3
2
3
Oregon
2
6
20
17
34
—
26
60
76
128
—
1
6
7
10
Washington
4
6
126
9
12
54
50
79
205
285
—
0
1
—
—
Territories
American Samoa
—
0
0
—
—
—
0
0
—
—
—
0
0
—
—
C.N.M.I.
—
—
—
—
—
—
—
—
—
—
—
—
—
—
—
Guam
—
0
0
—
—
—
0
5
—
—
—
0
0
—
—
Puerto Rico
—
0
4
—
6
7
6
14
19
27
—
0
0
—
—
U.S. Virgin Islands
—
0
0
—
—
—
2
10
—
14
—
0
0
—
—
C.N.M.I.: Commonwealth of Northern Mariana Islands.
U: Unavailable. —: No reported cases. N: Not reportable. NN: Not Nationally Notifiable. Cum: Cumulative year-to-date counts. Med: Median. Max: Maximum.
† Data for H. influenzae (age <5 yrs for serotype b, nonserotype b, and unknown serotype) are available in Table I.
TABLE II. (Continued) Provisional cases of selected notifiable diseases, United States, weeks ending February 4, 2012, and February 5, 2011 (5th week)*
Reporting area
Hepatitis (viral, acute), by type
A
B
C
Current week
Previous 52 weeks
Cum 2012
Cum 2011
Current week
Previous 52 weeks
Cum 2012
Cum 2011
Current week
Previous 52 weeks
Cum 2012
Cum 2011
Med
Max
Med
Max
Med
Max
United States
9
21
40
54
121
19
47
97
152
260
13
19
36
63
82
New England
—
1
5
2
10
—
1
8
—
13
—
1
5
2
7
Connecticut
—
0
3
2
5
—
0
4
—
1
—
0
4
2
6
Maine
—
0
2
—
—
—
0
2
—
—
—
0
3
—
—
Massachusetts
—
0
3
—
2
—
0
6
—
11
—
0
2
—
1
New Hampshire
—
0
0
—
—
—
0
1
—
1
N
0
0
N
N
Rhode Island
—
0
1
—
1
U
0
0
U
U
U
0
0
U
U
Vermont
—
0
2
—
2
—
0
0
—
—
—
0
1
—
—
Mid. Atlantic
2
3
7
8
19
—
5
8
8
22
1
2
5
8
5
New Jersey
—
0
0
—
—
—
0
1
2
—
—
0
1
1
—
New York (Upstate)
2
1
4
4
3
—
1
4
1
6
1
1
4
1
4
New York City
—
1
4
2
10
—
1
5
2
6
—
0
1
—
—
Pennsylvania
—
1
4
2
6
—
2
4
3
10
—
1
3
6
1
E.N. Central
2
3
7
6
24
7
5
37
19
54
1
2
8
4
20
Illinois
—
1
4
1
5
—
1
6
—
13
—
0
2
—
1
Indiana
—
0
1
—
4
—
1
4
2
5
—
1
5
2
13
Michigan
2
1
6
5
5
—
1
6
4
14
1
1
4
2
5
Ohio
—
1
2
—
8
7
1
30
13
19
—
0
1
—
—
Wisconsin
—
0
1
—
2
—
0
3
—
3
—
0
1
—
1
W.N. Central
2
1
7
4
5
—
2
9
5
14
—
0
4
1
—
Iowa
—
0
1
—
1
—
0
1
—
—
—
0
0
—
—
Kansas
—
0
1
—
—
—
0
2
—
3
—
0
1
1
—
Minnesota
—
0
7
—
—
—
0
7
—
—
—
0
2
—
—
Missouri
1
0
1
2
2
—
1
5
4
7
—
0
0
—
—
Nebraska
1
0
1
2
—
—
0
2
1
3
—
0
1
—
—
North Dakota
—
0
0
—
—
—
0
0
—
—
—
0
0
—
—
South Dakota
—
0
0
—
2
—
0
0
—
1
—
0
0
—
—
S. Atlantic
3
4
11
10
24
8
12
57
45
63
5
5
14
20
16
Delaware
—
0
1
—
1
—
0
2
1
—
U
0
0
U
U
District of Columbia
—
0
0
—
—
—
0
0
—
—
—
0
0
—
—
Florida
1
1
8
4
6
3
4
7
14
24
3
1
3
7
5
Georgia
1
1
5
1
7
1
2
7
6
14
1
1
3
1
3
Maryland
—
0
4
1
4
2
1
4
12
8
—
1
3
1
2
North Carolina
—
0
3
2
2
1
2
9
5
7
—
1
7
3
4
South Carolina
—
0
2
—
1
—
1
3
1
5
—
0
1
—
—
Virginia
1
0
3
1
3
1
1
4
6
5
1
0
3
1
2
West Virginia
—
0
2
1
—
—
0
43
—
—
—
0
7
7
—
E.S. Central
—
1
6
1
2
3
10
17
46
41
1
5
10
16
13
Alabama
—
0
2
—
—
—
2
6
7
6
—
0
3
1
—
Kentucky
—
0
2
—
2
2
3
9
18
16
—
2
8
9
8
Mississippi
—
0
1
—
—
—
1
4
2
3
U
0
0
U
U
Tennessee
—
0
5
1
—
1
4
8
19
16
1
1
5
6
5
W.S. Central
—
3
7
8
3
1
6
14
11
16
3
1
5
5
9
Arkansas
—
0
2
—
—
—
1
4
—
2
—
0
0
—
—
Louisiana
—
0
2
—
1
—
0
2
1
8
—
0
1
—
4
Oklahoma
—
0
2
—
—
1
1
9
2
1
—
1
4
—
3
Texas
—
3
7
8
2
—
3
11
8
5
3
0
3
5
2
Mountain
—
1
5
6
11
—
1
4
8
12
—
1
5
2
6
Arizona
—
0
2
2
4
—
0
3
1
1
U
0
0
U
U
Colorado
—
0
2
2
5
—
0
2
—
2
—
0
2
—
2
Idaho
—
0
1
1
—
—
0
1
—
1
—
0
2
—
2
Montana
—
0
1
—
1
—
0
0
—
—
—
0
1
—
—
Nevada
—
0
3
1
—
—
0
3
7
6
—
0
2
2
—
New Mexico
—
0
1
—
1
—
0
2
—
—
—
0
2
—
—
Utah
—
0
1
—
—
—
0
1
—
2
—
0
2
—
2
Wyoming
—
0
1
—
—
—
0
0
—
—
—
0
1
—
—
Pacific
—
3
11
9
23
—
3
8
10
25
2
2
10
5
6
Alaska
—
0
1
—
—
—
0
1
—
1
U
0
0
U
U
California
—
3
7
6
20
—
2
7
5
20
—
1
4
2
2
Hawaii
—
0
2
—
1
—
0
1
1
1
U
0
0
U
U
Oregon
—
0
2
1
1
—
0
4
3
3
—
0
2
1
3
Washington
—
0
4
2
1
—
0
3
1
—
2
0
8
2
1
Territories
American Samoa
—
0
0
—
—
—
0
0
—
—
—
0
0
—
—
C.N.M.I.
—
—
—
—
—
—
—
—
—
—
—
—
—
—
—
Guam
—
0
5
—
1
—
2
8
—
5
—
0
3
—
1
Puerto Rico
—
0
1
—
—
—
0
2
—
—
N
0
0
N
N
U.S. Virgin Islands
—
0
0
—
—
—
0
0
—
—
—
0
0
—
—
C.N.M.I.: Commonwealth of Northern Mariana Islands.
U: Unavailable. —: No reported cases. N: Not reportable. NN: Not Nationally Notifiable. Cum: Cumulative year-to-date counts. Med: Median. Max: Maximum.
TABLE II. (Continued) Provisional cases of selected notifiable diseases, United States, weeks ending February 4, 2012, and February 5, 2011 (5th week)*
Reporting area
Legionellosis
Lyme disease
Malaria
Current week
Previous 52 weeks
Cum 2012
Cum 2011
Current week
Previous 52 weeks
Cum 2012
Cum 2011
Current week
Previous 52 weeks
Cum 2012
Cum 2011
Med
Max
Med
Max
Med
Max
United States
17
68
166
140
178
92
402
1,593
964
790
12
24
48
76
123
New England
—
4
40
3
16
1
81
503
36
254
—
1
7
1
9
Connecticut
—
1
11
2
3
—
36
234
3
107
—
0
2
—
1
Maine
—
0
3
—
—
—
13
67
15
17
—
0
2
—
—
Massachusetts
—
3
24
—
10
—
17
106
—
83
—
0
6
—
6
New Hampshire
—
0
3
—
1
—
10
90
3
39
—
0
1
—
—
Rhode Island
—
0
9
1
1
1
1
31
1
1
—
0
2
—
—
Vermont
—
0
2
—
1
—
6
70
14
7
—
0
1
1
2
Mid. Atlantic
6
15
76
28
44
78
196
760
783
314
3
6
13
11
33
New Jersey
—
0
0
—
—
39
2
144
511
1
—
0
0
—
—
New York (Upstate)
2
6
27
11
12
21
56
211
50
27
1
1
4
2
3
New York City
—
3
14
4
17
—
1
14
—
6
1
4
11
7
24
Pennsylvania
4
5
41
13
15
18
110
535
222
280
1
1
5
2
6
E.N. Central
5
13
51
30
33
—
21
263
11
67
—
3
10
5
14
Illinois
—
2
11
1
4
—
1
21
—
3
—
1
5
—
5
Indiana
1
2
8
4
6
—
1
12
—
—
—
0
2
1
1
Michigan
—
2
15
—
7
—
1
12
6
—
—
0
4
1
1
Ohio
4
7
34
25
16
—
1
6
4
3
—
0
4
2
6
Wisconsin
—
0
1
—
—
—
17
221
1
61
—
0
2
1
1
W.N. Central
—
1
8
4
3
—
1
16
2
2
1
1
5
4
2
Iowa
—
0
2
—
—
—
0
13
1
1
—
0
3
1
—
Kansas
—
0
2
—
—
—
0
2
—
—
—
0
2
—
—
Minnesota
—
0
0
—
—
—
0
0
—
—
—
0
0
—
—
Missouri
—
1
5
4
2
—
0
2
—
1
1
0
2
3
1
Nebraska
—
0
2
—
—
—
0
2
1
—
—
0
1
—
1
North Dakota
—
0
1
—
—
—
0
9
—
—
—
0
0
—
—
South Dakota
—
0
1
—
1
—
0
2
—
—
—
0
1
—
—
S. Atlantic
5
11
30
45
21
11
62
181
115
147
4
8
25
33
42
Delaware
1
0
4
3
—
3
13
48
29
46
—
0
3
—
—
District of Columbia
—
0
3
1
—
—
0
3
1
2
—
0
2
—
3
Florida
3
4
13
24
10
1
3
8
11
3
1
2
6
14
9
Georgia
—
1
4
3
3
1
0
5
5
1
—
1
6
4
8
Maryland
—
2
15
3
3
2
21
116
39
55
1
2
15
8
9
North Carolina
—
1
7
4
2
1
0
12
1
5
1
0
7
1
4
South Carolina
—
0
5
2
—
—
0
6
1
1
—
0
1
2
—
Virginia
1
1
7
5
3
3
15
75
22
34
1
1
8
4
9
West Virginia
—
0
5
—
—
—
0
13
6
—
—
0
1
—
—
E.S. Central
—
2
11
2
7
—
1
5
1
—
—
1
4
—
2
Alabama
—
0
2
—
1
—
0
2
—
—
—
0
3
—
1
Kentucky
—
1
4
—
3
—
0
1
1
—
—
0
2
—
—
Mississippi
—
0
3
—
1
—
0
1
—
—
—
0
1
—
—
Tennessee
—
1
8
2
2
—
0
4
—
—
—
0
3
—
1
W.S. Central
—
3
8
2
5
—
1
3
—
1
1
1
5
5
2
Arkansas
—
0
2
—
—
—
0
0
—
—
—
0
1
—
—
Louisiana
—
0
3
—
1
—
0
1
—
—
—
0
1
—
—
Oklahoma
—
0
3
—
1
—
0
0
—
—
—
0
3
3
—
Texas
—
2
7
2
3
—
1
3
—
1
1
0
5
2
2
Mountain
—
2
9
7
10
2
1
5
5
1
1
1
5
2
8
Arizona
—
1
4
3
3
—
0
4
1
—
—
0
4
—
2
Colorado
—
0
4
—
5
—
0
1
—
—
—
0
3
—
3
Idaho
—
0
1
1
—
1
0
2
2
—
—
0
1
—
—
Montana
—
0
1
—
—
—
0
3
—
—
—
0
1
—
—
Nevada
—
0
2
1
1
—
0
1
—
—
1
0
2
2
2
New Mexico
—
0
2
—
—
—
0
2
—
1
—
0
1
—
1
Utah
—
0
2
1
1
—
0
1
1
—
—
0
1
—
—
Wyoming
—
0
2
1
—
1
0
1
1
—
—
0
0
—
—
Pacific
1
5
17
19
39
—
3
8
11
4
2
3
11
15
11
Alaska
—
0
0
—
—
—
0
3
—
—
—
0
2
1
—
California
1
4
11
15
35
—
1
7
11
3
2
2
7
13
7
Hawaii
—
0
2
—
1
N
0
0
N
N
—
0
1
—
—
Oregon
—
0
3
4
1
—
0
2
—
1
—
0
4
1
3
Washington
—
0
13
—
2
—
0
5
—
—
—
0
2
—
1
Territories
American Samoa
N
0
0
N
N
N
0
0
N
N
—
0
1
—
—
C.N.M.I.
—
—
—
—
—
—
—
—
—
—
—
—
—
—
—
Guam
—
0
0
—
—
—
0
0
—
—
—
0
0
—
—
Puerto Rico
—
0
0
—
—
N
0
0
N
N
—
0
0
—
—
U.S. Virgin Islands
—
0
0
—
—
—
0
0
—
—
—
0
0
—
—
C.N.M.I.: Commonwealth of Northern Mariana Islands.
U: Unavailable. —: No reported cases. N: Not reportable. NN: Not Nationally Notifiable. Cum: Cumulative year-to-date counts. Med: Median. Max: Maximum.
TABLE II. (Continued) Provisional cases of selected notifiable diseases, United States, weeks ending February 4, 2012, and February 5, 2011 (5th week)*
Reporting area
Meningococcal disease, invasive† All serogroups
Mumps
Pertussis
Current week
Previous 52 weeks
Cum 2012
Cum 2011
Current week
Previous 52 weeks
Cum 2012
Cum 2011
Current week
Previous 52 weeks
Cum 2012
Cum 2011
Med
Max
Med
Max
Med
Max
United States
5
12
30
45
92
2
7
19
15
34
164
304
701
1,125
1,807
New England
—
0
3
—
3
—
0
2
—
1
—
16
32
57
43
Connecticut
—
0
1
—
1
—
0
0
—
—
—
1
5
2
8
Maine
—
0
1
—
—
—
0
2
—
—
—
3
19
14
5
Massachusetts
—
0
2
—
2
—
0
1
—
1
—
4
10
—
20
New Hampshire
—
0
1
—
—
—
0
0
—
—
—
2
13
2
6
Rhode Island
—
0
1
—
—
—
0
2
—
—
—
0
5
5
4
Vermont
—
0
3
—
—
—
0
1
—
—
—
1
16
34
—
Mid. Atlantic
2
1
4
8
9
—
0
7
—
5
66
39
162
280
154
New Jersey
—
0
0
—
—
—
0
2
—
5
—
4
10
6
13
New York (Upstate)
—
0
4
1
1
—
0
3
—
—
57
13
134
163
45
New York City
—
0
2
3
6
—
0
6
—
—
—
3
42
11
—
Pennsylvania
2
0
2
4
2
—
0
1
—
—
9
13
29
100
96
E.N. Central
—
2
6
4
12
—
2
12
4
11
21
67
214
305
454
Illinois
—
0
3
—
2
—
1
10
—
4
—
19
122
45
85
Indiana
—
0
2
—
2
—
0
2
1
—
—
4
21
3
43
Michigan
—
0
1
—
3
—
0
2
2
1
6
10
38
33
113
Ohio
—
0
2
4
3
—
0
2
1
5
12
13
35
74
160
Wisconsin
—
0
1
—
2
—
0
1
—
1
3
13
58
150
53
W.N. Central
1
1
3
3
8
—
0
3
1
6
5
21
119
80
99
Iowa
—
0
1
—
1
—
0
2
—
—
—
4
9
9
27
Kansas
—
0
1
—
1
—
0
1
—
1
1
2
10
6
16
Minnesota
—
0
0
—
—
—
0
1
—
—
—
0
110
—
—
Missouri
1
0
3
3
3
—
0
3
1
4
4
7
27
64
44
Nebraska
—
0
2
—
3
—
0
1
—
1
—
1
5
1
10
North Dakota
—
0
1
—
—
—
0
3
—
—
—
0
10
—
—
South Dakota
—
0
1
—
—
—
0
0
—
—
—
0
7
—
2
S. Atlantic
1
2
8
6
12
2
1
4
4
1
24
26
67
103
212
Delaware
—
0
1
—
—
—
0
0
—
—
—
0
5
4
3
District of Columbia
—
0
1
—
—
—
0
1
—
—
—
0
2
1
1
Florida
1
1
5
4
4
1
0
2
2
—
13
6
17
39
32
Georgia
—
0
1
—
1
—
0
2
—
—
—
3
8
9
31
Maryland
—
0
2
2
1
—
0
1
1
—
2
2
10
15
18
North Carolina
—
0
3
—
3
—
0
2
—
—
1
3
35
5
59
South Carolina
—
0
1
—
2
—
0
1
—
—
—
2
9
1
24
Virginia
—
0
2
—
1
—
0
4
—
1
3
6
25
18
44
West Virginia
—
0
3
—
—
1
0
1
1
—
5
0
15
11
—
E.S. Central
—
0
3
—
5
—
0
1
—
2
1
9
15
45
69
Alabama
—
0
2
—
4
—
0
1
—
1
—
2
11
2
17
Kentucky
—
0
2
—
—
—
0
0
—
—
—
3
9
25
31
Mississippi
—
0
1
—
1
—
0
1
—
1
1
0
4
3
4
Tennessee
—
0
2
—
—
—
0
1
—
—
—
2
7
15
17
W.S. Central
—
1
5
1
8
—
1
12
1
4
4
19
79
25
46
Arkansas
—
0
2
—
1
—
0
2
—
—
—
1
5
1
5
Louisiana
—
0
2
1
3
—
0
0
—
—
—
0
3
—
4
Oklahoma
—
0
2
—
1
—
0
2
—
—
—
0
11
—
—
Texas
—
0
2
—
3
—
1
12
1
4
4
18
76
24
37
Mountain
1
1
4
2
6
—
0
2
2
1
5
40
82
139
255
Arizona
1
0
1
1
2
—
0
0
—
—
—
12
46
84
99
Colorado
—
0
1
—
1
—
0
1
1
—
—
7
25
17
60
Idaho
—
0
1
—
2
—
0
2
—
—
—
3
12
10
15
Montana
—
0
2
1
—
—
0
1
1
—
1
1
32
9
15
Nevada
—
0
1
—
—
—
0
0
—
—
4
0
4
8
7
New Mexico
—
0
1
—
—
—
0
1
—
1
—
4
24
6
8
Utah
—
0
2
—
1
—
0
0
—
—
—
6
15
2
50
Wyoming
—
0
0
—
—
—
0
1
—
—
—
0
3
3
1
Pacific
—
3
10
21
29
—
0
11
3
3
38
60
239
91
475
Alaska
—
0
1
—
—
—
0
1
—
—
—
0
3
6
11
California
—
2
9
14
23
—
0
11
3
—
—
36
78
14
424
Hawaii
—
0
1
—
1
—
0
1
—
1
1
1
9
9
6
Oregon
—
0
4
7
3
—
0
1
—
2
2
5
23
9
20
Washington
—
0
3
—
2
—
0
1
—
—
35
11
194
53
14
Territories
American Samoa
—
0
0
—
—
—
0
0
—
—
—
0
0
—
—
C.N.M.I.
—
—
—
—
—
—
—
—
—
—
—
—
—
—
—
Guam
—
0
0
—
—
—
1
3
—
2
—
2
14
—
1
Puerto Rico
—
0
0
—
—
—
0
1
1
—
—
0
1
—
1
U.S. Virgin Islands
—
0
0
—
—
—
0
0
—
—
—
0
0
—
—
C.N.M.I.: Commonwealth of Northern Mariana Islands.
U: Unavailable. —: No reported cases. N: Not reportable. NN: Not Nationally Notifiable. Cum: Cumulative year-to-date counts. Med: Median. Max: Maximum.
† Data for meningococcal disease, invasive caused by serogroups A, C, Y, and W-135; serogroup B; other serogroup; and unknown serogroup are available in Table I.
TABLE II. (Continued) Provisional cases of selected notifiable diseases, United States, weeks ending February 4, 2012, and February 5, 2011 (5th week)*
Reporting area
Rabies, animal
Salmonellosis
Shiga toxin-producing E. coli (STEC)†
Current week
Previous 52 weeks
Cum 2012
Cum 2011
Current week
Previous 52 weeks
Cum 2012
Cum 2011
Current week
Previous 52 weeks
Cum 2012
Cum 2011
Med
Max
Med
Max
Med
Max
United States
27
56
99
129
268
278
872
1,855
1,723
2,373
23
86
206
162
184
New England
3
5
16
30
8
1
36
107
37
119
—
3
13
2
8
Connecticut
—
2
10
13
2
—
8
30
18
34
—
1
4
2
4
Maine
2
1
6
11
1
1
2
8
7
12
—
0
3
—
—
Massachusetts
—
0
0
—
—
—
19
44
—
57
—
1
9
—
2
New Hampshire
—
0
3
2
1
—
3
8
5
11
—
0
3
—
2
Rhode Island
—
0
6
2
—
—
1
62
—
—
—
0
2
—
—
Vermont
1
0
2
2
4
—
1
8
7
5
—
0
3
—
—
Mid. Atlantic
7
16
35
18
66
15
74
172
144
199
1
9
28
20
23
New Jersey
—
0
0
—
—
—
0
3
3
—
—
0
1
1
—
New York (Upstate)
7
7
20
18
24
10
25
67
34
39
1
3
13
3
10
New York City
—
0
3
—
1
1
19
42
48
64
—
2
6
6
1
Pennsylvania
—
8
21
—
41
4
31
113
59
96
—
3
16
10
12
E.N. Central
—
2
17
2
4
14
88
184
123
297
1
15
51
28
42
Illinois
—
0
6
—
3
—
27
80
16
108
—
4
14
4
8
Indiana
—
0
7
—
—
—
8
27
6
27
—
1
10
—
9
Michigan
—
1
6
1
1
2
14
42
33
50
—
3
19
19
11
Ohio
—
1
5
1
—
12
20
46
62
77
1
3
10
5
5
Wisconsin
N
0
0
N
N
—
12
46
6
35
—
3
21
—
9
W.N. Central
—
1
7
6
1
17
40
103
98
116
6
11
40
29
14
Iowa
—
0
0
—
—
—
8
19
9
30
—
2
15
5
3
Kansas
—
0
4
4
1
3
8
27
33
20
—
2
8
3
2
Minnesota
—
0
0
—
—
—
0
0
—
—
—
0
0
—
—
Missouri
—
0
2
2
—
11
16
46
44
48
4
5
32
14
5
Nebraska
—
0
3
—
—
3
4
13
9
10
2
1
7
4
4
North Dakota
—
0
3
—
—
—
0
15
—
—
—
0
4
—
—
South Dakota
—
0
0
—
—
—
3
10
3
8
—
1
4
3
—
S. Atlantic
11
17
53
28
172
144
273
730
724
716
7
13
28
41
40
Delaware
—
0
0
—
—
—
3
12
6
11
—
0
2
1
—
District of Columbia
—
0
0
—
—
—
1
6
—
3
—
0
1
—
1
Florida
10
0
4
12
120
65
107
203
331
281
6
3
9
20
6
Georgia
—
0
0
—
—
2
40
134
73
118
—
2
8
3
7
Maryland
—
6
13
10
10
11
18
45
65
58
—
1
3
3
7
North Carolina
—
0
0
—
—
53
30
251
127
109
1
2
11
4
9
South Carolina
N
0
0
N
N
5
26
71
60
61
—
0
4
1
—
Virginia
—
11
27
—
42
8
19
54
54
75
—
3
9
9
10
West Virginia
1
0
30
6
—
—
0
18
8
—
—
0
2
—
—
E.S. Central
—
3
11
7
11
18
64
190
141
182
—
4
18
14
12
Alabama
—
2
7
6
6
7
19
70
40
58
—
0
15
2
2
Kentucky
—
0
2
1
1
5
11
30
27
28
—
1
5
3
3
Mississippi
—
0
1
—
—
—
22
66
39
35
—
0
4
4
1
Tennessee
—
1
4
—
4
6
15
51
35
61
—
1
11
5
6
W.S. Central
6
1
21
28
—
20
132
250
125
206
2
10
45
7
7
Arkansas
1
0
10
1
—
5
13
52
28
32
—
1
6
3
1
Louisiana
—
0
0
—
—
1
14
44
36
50
—
0
1
—
—
Oklahoma
—
0
21
4
—
13
12
31
23
19
2
1
10
3
2
Texas
5
0
7
23
—
1
92
157
38
105
—
7
45
1
4
Mountain
—
1
4
9
—
13
45
93
101
203
3
11
27
12
21
Arizona
N
0
0
N
N
8
15
35
48
71
—
1
7
1
2
Colorado
—
0
0
—
—
—
9
23
11
43
—
3
9
1
10
Idaho
—
0
1
—
—
—
3
8
4
19
—
1
8
2
4
Montana
N
0
0
N
N
1
2
10
7
3
—
1
4
—
—
Nevada
—
0
2
—
—
3
3
7
7
16
—
0
7
—
1
New Mexico
—
0
4
9
—
—
6
22
9
30
—
1
3
3
3
Utah
—
0
2
—
—
—
6
15
13
20
—
1
7
2
1
Wyoming
—
0
0
—
—
1
1
9
2
1
3
0
7
3
—
Pacific
—
4
13
1
6
36
92
173
230
335
3
9
28
9
17
Alaska
—
0
2
1
2
—
1
6
7
7
—
0
1
—
—
California
—
3
12
—
2
24
72
141
182
253
—
4
14
2
12
Hawaii
—
0
0
—
—
1
6
14
10
34
—
0
2
—
—
Oregon
—
0
2
—
2
—
6
12
15
32
1
1
11
3
4
Washington
—
0
0
—
—
11
9
40
16
9
2
2
19
4
1
Territories
American Samoa
N
0
0
N
N
—
0
0
—
—
—
0
0
—
—
C.N.M.I.
—
—
—
—
—
—
—
—
—
—
—
—
—
—
—
Guam
—
0
0
—
—
—
0
2
—
3
—
0
0
—
—
Puerto Rico
—
0
6
—
2
—
3
12
3
13
—
0
0
—
—
U.S. Virgin Islands
—
0
0
—
—
—
0
0
—
—
—
0
0
—
—
C.N.M.I.: Commonwealth of Northern Mariana Islands.
U: Unavailable. —: No reported cases. N: Not reportable. NN: Not Nationally Notifiable. Cum: Cumulative year-to-date counts. Med: Median. Max: Maximum.
† Includes E. coli O157:H7; Shiga toxin-positive, serogroup non-O157; and Shiga toxin-positive, not serogrouped.
TABLE II. (Continued) Provisional cases of selected notifiable diseases, United States, weeks ending February 4, 2012, and February 5, 2011 (5th week)*
Reporting area
Shigellosis
Spotted Fever Rickettsiosis (including RMSF)†
Confirmed
Probable
Current week
Previous 52 weeks
Cum 2012
Cum 2011
Current week
Previous 52 weeks
Cum 2012
Cum 2011
Current week
Previous 52 weeks
Cum 2012
Cum 2011
Med
Max
Med
Max
Med
Max
United States
111
245
353
746
786
1
3
15
8
8
7
30
140
30
26
New England
—
4
21
2
17
—
0
1
—
—
—
0
1
—
—
Connecticut
—
1
4
2
2
—
0
0
—
—
—
0
0
—
—
Maine
—
0
8
—
1
—
0
0
—
—
—
0
1
—
—
Massachusetts
—
3
20
—
13
—
0
0
—
—
—
0
1
—
—
New Hampshire
—
0
1
—
—
—
0
1
—
—
—
0
1
—
—
Rhode Island
—
0
3
—
—
—
0
0
—
—
—
0
1
—
—
Vermont
—
0
1
—
1
—
0
0
—
—
—
0
0
—
—
Mid. Atlantic
27
17
45
131
45
—
0
2
1
—
1
1
7
4
2
New Jersey
—
0
24
49
—
—
0
0
—
—
—
0
0
—
—
New York (Upstate)
26
5
32
33
13
—
0
1
—
—
—
0
2
—
—
New York City
—
7
28
42
22
—
0
0
—
—
—
0
3
2
2
Pennsylvania
1
2
13
7
10
—
0
2
1
—
1
0
3
2
—
E.N. Central
10
14
40
113
81
—
0
2
1
—
1
2
10
1
3
Illinois
—
4
16
—
30
—
0
1
—
—
—
1
4
—
2
Indiana
—
0
4
—
8
—
0
1
1
—
1
0
5
1
—
Michigan
—
3
11
18
16
—
0
1
—
—
—
0
1
—
—
Ohio
10
6
27
95
27
—
0
2
—
—
—
0
2
—
1
Wisconsin
—
0
0
—
—
—
0
0
—
—
—
0
0
—
—
W.N. Central
1
5
18
29
54
—
0
4
—
—
—
4
29
3
2
Iowa
—
0
3
—
2
—
0
0
—
—
—
0
2
—
—
Kansas
1
1
5
15
13
—
0
0
—
—
—
0
0
—
—
Minnesota
—
0
0
—
—
—
0
0
—
—
—
0
0
—
—
Missouri
—
3
14
12
37
—
0
3
—
—
—
4
29
3
2
Nebraska
—
0
2
2
1
—
0
3
—
—
—
0
1
—
—
North Dakota
—
0
0
—
—
—
0
1
—
—
—
0
0
—
—
South Dakota
—
0
2
—
1
—
0
1
—
—
—
0
0
—
—
S. Atlantic
24
75
134
161
252
1
1
9
5
4
3
6
57
15
10
Delaware
—
0
2
—
—
—
0
1
—
—
—
0
4
1
—
District of Columbia
1
0
5
1
5
—
0
1
—
—
—
0
1
—
—
Florida
14
50
98
104
157
—
0
1
—
1
1
0
2
4
—
Georgia
3
13
24
34
40
1
1
8
5
1
—
0
0
—
—
Maryland
1
2
7
7
6
—
0
1
—
1
1
0
2
2
1
North Carolina
3
3
19
7
29
—
0
4
—
1
—
0
49
3
6
South Carolina
—
1
54
2
6
—
0
2
—
—
—
0
2
—
1
Virginia
2
2
7
6
9
—
0
1
—
—
1
3
14
5
2
West Virginia
—
0
2
—
—
—
0
0
—
—
—
0
1
—
—
E.S. Central
20
19
51
123
43
—
0
2
—
—
1
4
25
3
4
Alabama
2
6
21
37
20
—
0
1
—
—
—
1
8
1
2
Kentucky
16
4
22
64
2
—
0
1
—
—
—
0
2
—
—
Mississippi
—
4
24
14
6
—
0
0
—
—
—
0
2
—
1
Tennessee
2
4
11
8
15
—
0
2
—
—
1
4
20
2
1
W.S. Central
23
54
121
110
107
—
0
3
—
—
—
2
52
1
1
Arkansas
5
2
7
8
3
—
0
3
—
—
—
1
52
—
—
Louisiana
—
4
21
12
16
—
0
0
—
—
—
0
2
1
—
Oklahoma
6
3
28
26
7
—
0
1
—
—
—
0
25
—
—
Texas
12
43
98
64
81
—
0
1
—
—
—
0
4
—
1
Mountain
1
14
41
29
76
—
0
3
—
4
1
1
7
2
4
Arizona
1
5
27
20
34
—
0
3
—
4
—
0
6
—
4
Colorado
—
1
8
1
13
—
0
0
—
—
—
0
1
—
—
Idaho
—
0
3
1
3
—
0
0
—
—
1
0
1
1
—
Montana
—
1
15
3
2
—
0
0
—
—
—
0
1
—
—
Nevada
—
0
4
1
6
—
0
0
—
—
—
0
1
—
—
New Mexico
—
2
7
2
13
—
0
0
—
—
—
0
0
—
—
Utah
—
1
4
1
5
—
0
0
—
—
—
0
1
1
—
Wyoming
—
0
1
—
—
—
0
0
—
—
—
0
2
—
—
Pacific
5
20
44
48
111
—
0
2
1
—
—
0
1
1
—
Alaska
—
0
2
2
—
N
0
0
N
N
N
0
0
N
N
California
4
15
41
41
96
—
0
2
1
—
—
0
1
1
—
Hawaii
—
1
3
—
7
N
0
0
N
N
N
0
0
N
N
Oregon
—
1
4
4
6
—
0
0
—
—
—
0
0
—
—
Washington
1
1
9
1
2
—
0
0
—
—
—
0
0
—
—
Territories
American Samoa
—
0
0
—
1
N
0
0
N
N
N
0
0
N
N
C.N.M.I.
—
—
—
—
—
—
—
—
—
—
—
—
—
—
—
Guam
—
0
1
—
—
N
0
0
N
N
N
0
0
N
N
Puerto Rico
—
0
0
—
—
N
0
0
N
N
N
0
0
N
N
U.S. Virgin Islands
—
0
0
—
—
—
0
0
—
—
—
0
0
—
—
C.N.M.I.: Commonwealth of Northern Mariana Islands.
U: Unavailable. —: No reported cases. N: Not reportable. NN: Not Nationally Notifiable. Cum: Cumulative year-to-date counts. Med: Median. Max: Maximum.
† Illnesses with similar clinical presentation that result from Spotted fever group rickettsia infections are reported as Spotted fever rickettsioses. Rocky Mountain spotted fever (RMSF) caused by Rickettsia rickettsii, is the most common and well-known spotted fever.
TABLE II. (Continued) Provisional cases of selected notifiable diseases, United States, weeks ending February 4, 2012, and February 5, 2011 (5th week)*
Reporting area
Streptococcus pneumoniae,† invasive disease
Syphilis, primary and secondary
All ages
Age <5
Current week
Previous 52 weeks
Cum 2012
Cum 2011
Current week
Previous 52 weeks
Cum 2012
Cum 2011
Current week
Previous 52 weeks
Cum 2012
Cum 2011
Med
Max
Med
Max
Med
Max
United States
147
247
464
1,270
1,822
12
20
41
84
103
60
265
317
600
1,148
New England
2
14
31
50
118
—
1
4
—
2
2
7
23
13
33
Connecticut
1
6
20
27
58
—
0
3
—
—
—
0
12
—
2
Maine
—
2
8
12
20
—
0
1
—
—
—
0
2
—
2
Massachusetts
—
0
3
—
4
—
0
2
—
2
2
5
10
12
21
New Hampshire
1
1
8
3
13
—
0
1
—
—
—
0
3
—
3
Rhode Island
—
1
6
—
19
—
0
1
—
—
—
0
7
1
5
Vermont
—
1
6
8
4
—
0
2
—
—
—
0
2
—
—
Mid. Atlantic
22
16
52
168
119
1
1
10
7
4
5
30
53
71
165
New Jersey
—
0
16
42
—
—
0
2
4
—
—
4
13
—
18
New York (Upstate)
19
1
27
76
11
1
1
10
3
4
2
4
9
11
13
New York City
3
12
24
50
108
—
0
9
—
—
—
14
24
27
101
Pennsylvania
N
0
0
N
N
N
0
0
N
N
3
7
17
33
33
E.N. Central
30
64
122
293
372
—
3
10
14
22
6
30
48
35
154
Illinois
N
0
0
N
N
—
0
0
—
—
6
11
24
24
63
Indiana
1
15
36
31
81
—
1
4
1
2
—
3
8
6
19
Michigan
5
13
26
63
74
—
0
2
3
7
—
4
12
1
26
Ohio
22
28
43
158
167
—
1
7
7
10
—
8
17
4
40
Wisconsin
2
8
23
41
50
—
0
2
3
3
—
1
5
—
6
W.N. Central
4
2
28
21
17
—
0
2
1
1
—
6
13
2
35
Iowa
N
0
0
N
N
N
0
0
N
N
—
0
3
2
—
Kansas
N
0
0
N
N
N
0
0
N
N
—
0
4
—
1
Minnesota
—
0
0
—
—
—
0
0
—
—
—
2
8
—
16
Missouri
N
0
0
N
N
—
0
0
—
—
—
2
8
—
17
Nebraska
4
2
9
21
17
—
0
2
1
1
—
0
2
—
1
North Dakota
—
0
25
—
—
—
0
1
—
—
—
0
0
—
—
South Dakota
N
0
0
N
N
—
0
0
—
—
—
0
0
—
—
S. Atlantic
48
65
143
364
593
8
5
15
29
36
23
69
100
186
240
Delaware
—
1
5
6
11
—
0
0
—
—
3
0
4
7
3
District of Columbia
—
1
5
1
7
—
0
1
1
1
—
3
8
19
15
Florida
24
21
55
139
254
4
2
8
12
16
5
23
36
77
111
Georgia
10
19
38
102
157
1
2
5
8
12
7
15
48
31
26
Maryland
5
9
29
33
88
1
1
3
2
5
3
9
20
13
29
North Carolina
N
0
0
N
N
N
0
0
N
N
5
8
21
28
18
South Carolina
3
8
22
54
76
—
0
3
1
2
—
4
11
—
19
Virginia
N
0
0
N
N
—
0
0
—
—
—
4
12
11
19
West Virginia
6
1
48
29
—
2
0
4
5
—
—
0
2
—
—
E.S. Central
7
23
45
114
165
—
2
4
8
16
3
15
30
23
50
Alabama
N
0
0
N
N
N
0
0
N
N
—
4
11
7
18
Kentucky
2
4
12
22
32
—
0
3
—
5
3
2
8
7
7
Mississippi
N
0
0
N
N
—
0
0
—
—
—
3
22
—
6
Tennessee
5
19
39
92
133
—
2
3
8
11
—
5
11
9
19
W.S. Central
17
31
122
130
171
1
3
10
12
7
11
36
50
117
133
Arkansas
3
4
14
20
31
—
0
4
2
2
—
4
10
—
15
Louisiana
—
2
11
21
35
—
0
2
2
1
—
7
25
15
10
Oklahoma
N
0
0
N
N
—
0
0
—
—
—
1
6
2
3
Texas
14
24
108
89
105
1
3
9
8
4
11
23
38
100
105
Mountain
15
26
72
121
251
1
2
8
8
14
3
12
20
16
51
Arizona
12
12
45
91
141
1
1
5
7
8
2
4
10
9
18
Colorado
—
9
23
10
52
—
0
4
—
1
—
2
6
4
11
Idaho
N
0
0
N
N
—
0
0
—
—
1
0
4
2
3
Montana
N
0
0
N
N
N
0
0
N
N
—
0
1
—
3
Nevada
N
0
0
N
N
N
0
0
N
N
—
2
9
—
11
New Mexico
—
4
12
17
31
—
0
2
1
1
—
1
4
—
3
Utah
—
1
8
—
23
—
0
3
—
4
—
0
2
1
2
Wyoming
3
0
3
3
4
—
0
0
—
—
—
0
0
—
—
Pacific
2
2
11
9
16
1
0
2
5
1
7
57
74
137
287
Alaska
2
2
11
9
16
1
0
2
5
1
1
0
2
2
—
California
N
0
0
N
N
N
0
0
N
N
3
44
62
114
240
Hawaii
—
0
1
—
—
—
0
1
—
—
—
0
3
—
—
Oregon
N
0
0
N
N
N
0
0
N
N
—
4
14
5
14
Washington
N
0
0
N
N
N
0
0
N
N
3
6
11
16
33
Territories
American Samoa
N
0
0
N
N
—
0
0
—
—
—
0
0
—
—
C.N.M.I.
—
—
—
—
—
—
—
—
—
—
—
—
—
—
—
Guam
—
0
0
—
—
—
0
0
—
—
—
0
0
—
—
Puerto Rico
—
0
0
—
—
—
0
0
—
—
5
4
15
19
11
U.S. Virgin Islands
—
0
0
—
—
—
0
0
—
—
—
0
0
—
—
C.N.M.I.: Commonwealth of Northern Mariana Islands.
U: Unavailable. —: No reported cases. N: Not reportable. NN: Not Nationally Notifiable. Cum: Cumulative year-to-date counts. Med: Median. Max: Maximum.
† Includes drug resistant and susceptible cases of invasive Streptococcus pneumoniae disease among children <5 years and among all ages. Case definition: Isolation of S. pneumoniae from a normally sterile body site (e.g., blood or cerebrospinal fluid).
TABLE II. (Continued) Provisional cases of selected notifiable diseases, United States, weeks ending February 4, 2012, and February 5, 2011 (5th week)*
Reporting area
Varicella (chickenpox)
West Nile virus disease†
Neuroinvasive
Nonneuroinvasive§
Current week
Previous 52 weeks
Cum 2012
Cum 2011
Current week
Previous 52 weeks
Cum 2012
Cum 2011
Current week
Previous 52 weeks
Cum 2012
Cum 2011
Med
Max
Med
Max
Med
Max
United States
157
260
344
978
1,265
—
0
60
—
1
—
0
31
—
—
New England
7
20
50
47
138
—
0
3
—
—
—
0
1
—
—
Connecticut
1
5
16
27
26
—
0
2
—
—
—
0
1
—
—
Maine
3
4
11
5
25
—
0
0
—
—
—
0
0
—
—
Massachusetts
—
8
18
—
51
—
0
2
—
—
—
0
1
—
—
New Hampshire
—
1
7
—
12
—
0
0
—
—
—
0
0
—
—
Rhode Island
—
0
6
1
2
—
0
1
—
—
—
0
0
—
—
Vermont
3
1
9
14
22
—
0
1
—
—
—
0
0
—
—
Mid. Atlantic
23
21
54
214
90
—
0
11
—
—
—
0
6
—
—
New Jersey
7
0
44
142
—
—
0
1
—
—
—
0
2
—
—
New York (Upstate)
N
0
0
N
N
—
0
5
—
—
—
0
4
—
—
New York City
—
0
0
—
—
—
0
4
—
—
—
0
1
—
—
Pennsylvania
16
19
41
72
90
—
0
2
—
—
—
0
1
—
—
E.N. Central
42
64
114
286
381
—
0
13
—
—
—
0
6
—
—
Illinois
—
18
38
72
73
—
0
6
—
—
—
0
5
—
—
Indiana
13
5
20
35
27
—
0
2
—
—
—
0
1
—
—
Michigan
5
18
44
68
130
—
0
7
—
—
—
0
1
—
—
Ohio
24
21
47
111
151
—
0
3
—
—
—
0
3
—
—
Wisconsin
—
0
1
—
—
—
0
1
—
—
—
0
1
—
—
W.N. Central
3
11
32
34
78
—
0
9
—
1
—
0
7
—
—
Iowa
N
0
0
N
N
—
0
2
—
—
—
0
2
—
—
Kansas
3
7
21
28
39
—
0
1
—
—
—
0
0
—
—
Minnesota
—
0
1
—
—
—
0
1
—
—
—
0
1
—
—
Missouri
—
3
14
5
35
—
0
2
—
1
—
0
2
—
—
Nebraska
—
0
2
—
1
—
0
4
—
—
—
0
3
—
—
North Dakota
—
0
7
—
1
—
0
1
—
—
—
0
1
—
—
South Dakota
—
1
6
1
2
—
0
0
—
—
—
0
1
—
—
S. Atlantic
20
37
66
144
148
—
0
10
—
—
—
0
5
—
—
Delaware
—
0
2
—
1
—
0
1
—
—
—
0
0
—
—
District of Columbia
—
0
2
—
3
—
0
3
—
—
—
0
3
—
—
Florida
14
17
38
95
79
—
0
5
—
—
—
0
2
—
—
Georgia
N
0
0
N
N
—
0
2
—
—
—
0
1
—
—
Maryland
N
0
0
N
N
—
0
5
—
—
—
0
3
—
—
North Carolina
N
0
0
N
N
—
0
1
—
—
—
0
0
—
—
South Carolina
—
0
9
—
—
—
0
0
—
—
—
0
0
—
—
Virginia
6
10
27
20
27
—
0
2
—
—
—
0
0
—
—
West Virginia
—
7
32
29
38
—
0
1
—
—
—
0
0
—
—
E.S. Central
5
5
15
21
28
—
0
11
—
—
—
0
5
—
—
Alabama
5
5
14
19
24
—
0
2
—
—
—
0
0
—
—
Kentucky
N
0
0
N
N
—
0
2
—
—
—
0
1
—
—
Mississippi
—
0
2
2
4
—
0
5
—
—
—
0
4
—
—
Tennessee
N
0
0
N
N
—
0
3
—
—
—
0
1
—
—
W.S. Central
50
56
142
167
145
—
0
4
—
—
—
0
3
—
—
Arkansas
3
5
26
7
13
—
0
1
—
—
—
0
0
—
—
Louisiana
—
2
6
7
7
—
0
1
—
—
—
0
2
—
—
Oklahoma
N
0
0
N
N
—
0
1
—
—
—
0
0
—
—
Texas
47
47
137
153
125
—
0
3
—
—
—
0
3
—
—
Mountain
6
22
68
62
232
—
0
11
—
—
—
0
5
—
—
Arizona
5
4
50
10
73
—
0
7
—
—
—
0
4
—
—
Colorado
—
7
32
22
67
—
0
2
—
—
—
0
2
—
—
Idaho
N
0
0
N
N
—
0
1
—
—
—
0
1
—
—
Montana
—
2
15
—
50
—
0
1
—
—
—
0
0
—
—
Nevada
N
0
0
N
N
—
0
4
—
—
—
0
2
—
—
New Mexico
—
1
8
12
7
—
0
1
—
—
—
0
0
—
—
Utah
1
4
26
16
34
—
0
1
—
—
—
0
1
—
—
Wyoming
—
0
1
2
1
—
0
1
—
—
—
0
1
—
—
Pacific
1
2
9
3
25
—
0
18
—
—
—
0
7
—
—
Alaska
1
1
4
2
10
—
0
0
—
—
—
0
0
—
—
California
—
0
4
—
7
—
0
18
—
—
—
0
7
—
—
Hawaii
—
1
4
1
8
—
0
0
—
—
—
0
0
—
—
Oregon
N
0
0
N
N
—
0
0
—
—
—
0
0
—
—
Washington
N
0
0
N
N
—
0
0
—
—
—
0
0
—
—
Territories
American Samoa
N
0
0
N
N
—
0
0
—
—
—
0
0
—
—
C.N.M.I.
—
—
—
—
—
—
—
—
—
—
—
—
—
—
—
Guam
—
2
4
—
1
—
0
0
—
—
—
0
0
—
—
Puerto Rico
—
2
10
9
21
—
0
0
—
—
—
0
0
—
—
U.S. Virgin Islands
—
0
0
—
—
—
0
0
—
—
—
0
0
—
—
C.N.M.I.: Commonwealth of Northern Mariana Islands.
U: Unavailable. —: No reported cases. N: Not reportable. NN: Not Nationally Notifiable. Cum: Cumulative year-to-date counts. Med: Median. Max: Maximum.
† Updated weekly from reports to the Division of Vector-Borne Infectious Diseases, National Center for Zoonotic, Vector-Borne, and Enteric Diseases (ArboNET Surveillance). Data for California serogroup, eastern equine, Powassan, St. Louis, and western equine diseases are available in Table I.
§ Not reportable in all states. Data from states where the condition is not reportable are excluded from this table, except starting in 2007 for the domestic arboviral diseases and influenza-associated pediatric mortality, and in 2003 for SARS-CoV. Reporting exceptions are available at http://www.cdc.gov/ncphi/disss/nndss/phs/infdis.htm.
TABLE III. Deaths in 122 U.S. cities,* week ending February 4, 2012 (5th week)
Reporting area
All causes, by age (years)
P&I† Total
Reporting area (Continued)
All causes, by age (years)
P&I† Total
All Ages
=65
45–64
25–44
1–24
<1
All Ages
=65
45–64
25–44
1–24
<1
New England
583
408
134
22
9
10
48
S. Atlantic
1,152
760
276
61
30
24
79
Boston, MA
162
97
46
9
5
5
15
Atlanta, GA
128
91
25
7
1
4
11
Bridgeport, CT
37
23
14
—
—
—
4
Baltimore, MD
143
90
33
9
6
4
10
Cambridge, MA
15
12
2
1
—
—
—
Charlotte, NC
119
79
28
6
2
4
11
Fall River, MA
22
17
5
—
—
—
—
Jacksonville, FL
14
7
6
1
—
—
—
Hartford, CT
66
46
15
2
2
1
12
Miami, FL
133
94
26
8
4
1
4
Lowell, MA
21
14
5
2
—
—
2
Norfolk, VA
65
45
16
1
2
1
6
Lynn, MA
9
7
2
—
—
—
—
Richmond, VA
51
33
15
1
2
—
3
New Bedford, MA
18
13
4
—
1
—
2
Savannah, GA
59
44
11
2
1
1
6
New Haven, CT
35
24
9
1
—
1
4
St. Petersburg, FL
57
41
12
4
—
—
7
Providence, RI
55
44
8
2
—
1
—
Tampa, FL
244
154
66
10
7
7
11
Somerville, MA
2
2
—
—
—
—
—
Washington, D.C.
120
70
32
11
5
2
8
Springfield, MA
41
29
10
2
—
—
3
Wilmington, DE
19
12
6
1
—
—
2
Waterbury, CT
37
30
4
3
—
—
1
E.S. Central
925
629
208
44
18
25
76
Worcester, MA
63
50
10
—
1
2
5
Birmingham, AL
176
116
36
9
3
11
17
Mid. Atlantic
2,869
1,947
637
180
58
46
153
Chattanooga, TN
69
52
14
—
1
2
4
Albany, NY
38
26
11
1
—
—
2
Knoxville, TN
131
94
25
6
4
2
19
Allentown, PA
33
25
4
3
1
—
2
Lexington, KY
63
44
10
4
3
2
—
Buffalo, NY
71
48
10
8
—
5
5
Memphis, TN
218
148
58
7
2
3
24
Camden, NJ
20
15
5
—
—
—
1
Mobile, AL
64
42
10
9
2
1
1
Elizabeth, NJ
16
11
4
1
—
—
4
Montgomery, AL
44
29
14
—
1
—
1
Erie, PA
68
48
18
1
—
1
3
Nashville, TN
160
104
41
9
2
4
10
Jersey City, NJ
9
7
2
—
—
—
1
W.S. Central
1,194
771
270
88
41
24
101
New York City, NY
1,115
796
233
53
18
14
53
Austin, TX
88
61
17
5
1
4
7
Newark, NJ
36
21
11
2
1
1
4
Baton Rouge, LA
71
34
13
15
9
—
—
Paterson, NJ
15
9
4
—
2
—
3
Corpus Christi, TX
68
44
19
3
1
1
13
Philadelphia, PA
1,063
647
261
100
31
24
48
Dallas, TX
227
133
63
19
7
5
23
Pittsburgh, PA§
57
42
13
2
—
—
4
El Paso, TX
102
74
17
5
3
3
4
Reading, PA
37
32
3
1
1
—
3
Fort Worth, TX
U
U
U
U
U
U
U
Rochester, NY
67
55
10
—
1
1
4
Houston, TX
93
57
10
9
15
2
12
Schenectady, NY
30
19
9
1
1
—
1
Little Rock, AR
87
59
19
6
1
2
6
Scranton, PA
35
32
3
—
—
—
2
New Orleans, LA
U
U
U
U
U
U
U
Syracuse, NY
101
74
19
6
2
—
7
San Antonio, TX
278
185
63
21
3
6
23
Trenton, NJ
12
6
6
—
—
—
—
Shreveport, LA
39
29
8
1
—
1
4
Utica, NY
20
14
6
—
—
—
2
Tulsa, OK
141
95
41
4
1
—
9
Yonkers, NY
26
20
5
1
—
—
4
Mountain
1,198
804
274
67
33
19
70
E.N. Central
2,252
1,493
538
136
43
42
173
Albuquerque, NM
136
94
29
6
5
2
14
Akron, OH
56
37
15
1
1
2
11
Boise, ID
53
45
5
1
—
2
1
Canton, OH
30
20
8
2
—
—
2
Colorado Springs, CO
89
56
26
3
3
1
3
Chicago, IL
251
163
58
21
5
4
26
Denver, CO
76
52
18
4
1
1
3
Cincinnati, OH
109
70
24
2
5
8
9
Las Vegas, NV
301
203
76
15
5
2
14
Cleveland, OH
237
170
51
12
3
1
21
Ogden, UT
33
24
7
1
1
—
2
Columbus, OH
407
269
104
22
4
8
33
Phoenix, AZ
161
92
37
14
9
8
10
Dayton, OH
151
110
34
5
—
2
12
Pueblo, CO
38
23
12
2
1
—
—
Detroit, MI
163
88
47
16
7
5
9
Salt Lake City, UT
150
97
36
10
5
2
14
Evansville, IN
47
36
9
2
—
—
3
Tucson, AZ
161
118
28
11
3
1
9
Fort Wayne, IN
85
60
19
2
3
1
4
Pacific
1,823
1,260
402
100
32
29
166
Gary, IN
10
5
5
—
—
—
—
Berkeley, CA
12
6
4
1
—
1
2
Grand Rapids, MI
59
38
11
7
1
2
3
Fresno, CA
126
96
23
2
3
2
13
Indianapolis, IN
204
122
55
17
9
1
17
Glendale, CA
20
15
5
—
—
—
7
Lansing, MI
37
26
8
3
—
—
1
Honolulu, HI
78
61
11
3
3
—
10
Milwaukee, WI
109
68
27
9
2
3
7
Long Beach, CA
65
38
20
2
2
3
9
Peoria, IL
48
33
9
4
2
—
6
Los Angeles, CA
274
189
57
15
6
7
29
Rockford, IL
69
43
20
5
—
1
2
Pasadena, CA
25
22
1
1
1
—
3
South Bend, IN
42
30
9
2
—
1
—
Portland, OR
130
77
41
12
—
—
6
Toledo, OH
78
60
14
2
1
1
7
Sacramento, CA
219
150
49
16
3
1
19
Youngstown, OH
60
45
11
2
—
2
—
San Diego, CA
179
120
40
9
6
4
15
W.N. Central
687
444
165
50
14
13
57
San Francisco, CA
118
76
34
5
1
2
14
Des Moines, IA
78
61
13
2
—
2
6
San Jose, CA
238
176
40
13
4
5
21
Duluth, MN
29
21
5
2
1
—
4
Santa Cruz, CA
44
33
7
3
—
1
3
Kansas City, KS
37
20
12
4
1
—
6
Seattle, WA
120
81
28
8
1
2
9
Kansas City, MO
88
56
21
7
2
2
4
Spokane, WA
60
40
15
5
—
—
2
Lincoln, NE
42
35
7
—
—
—
3
Tacoma, WA
115
80
27
5
2
1
4
Minneapolis, MN
53
35
15
1
—
2
8
Total¶
12,683
8,516
2,904
748
278
232
923
Omaha, NE
98
64
23
7
1
3
9
St. Louis, MO
102
45
33
14
6
4
3
St. Paul, MN
58
41
9
6
1
—
5
Wichita, KS
102
66
27
7
2
—
9
U: Unavailable. —: No reported cases.
* Mortality data in this table are voluntarily reported from 122 cities in the United States, most of which have populations of >100,000. A death is reported by the place of its occurrence and by the week that the death certificate was filed. Fetal deaths are not included.
† Pneumonia and influenza.
§ Because of changes in reporting methods in this Pennsylvania city, these numbers are partial counts for the current week. Complete counts will be available in 4 to 6 weeks.