Persons using assistive technology might not be able to fully access information in this file. For assistance, please send e-mail to: mmwrq@cdc.gov. Type 508 Accommodation and the title of the report in the subject line of e-mail.
Notifiable Diseases and Mortality Tables
Table I Summary of provisional cases of selected notifiable diseases, United States, cumulative, week ending February 11, 2012 (6th Week)
Figure I Selected notifiable disease reports, United States, comparison of provisional 4-week totals ending February 11, 2012, with historical data
Table II Provisional cases of selected notifiable diseases, United States, weeks ending February 11, 2012 and February 12, 2011 (6th Week)
Table III Deaths in 122 U.S. cities, week ending February 11, 2012 (6th Week)
TABLE I. Provisional cases of infrequently reported notifiable diseases (<1,000 cases reported during the preceding year) — United States, week ending February 11, 2012 (6th week)*
TABLE I. (Continued) Provisional cases of infrequently reported notifiable diseases (<1,000 cases reported during the preceding year) — United States, week ending February 11, 2012 (6th week)*
—: No reported cases. N: Not reportable. NN: Not Nationally Notifiable. Cum: Cumulative year-to-date counts.
§ Not reportable in all states. Data from states where the condition is not reportable are excluded from this table except starting in 2007 for the arboviral diseases, STD data, TB data, and influenza-associated pediatric mortality, and in 2003 for SARS-CoV. Reporting exceptions are available at http://www.cdc.gov/osels/ph_surveillance/nndss/phs/infdis.htm.
¶ Includes both neuroinvasive and nonneuroinvasive. Updated weekly from reports to the Division of Vector-Borne Infectious Diseases, National Center for Zoonotic, Vector-Borne, and Enteric Diseases (ArboNET Surveillance). Data for West Nile virus are available in Table II.
** Data for H. influenzae (all ages, all serotypes) are available in Table II.
†† Updated weekly from reports to the Influenza Division, National Center for Immunization and Respiratory Diseases. Since October 2, 2011, three influenza-associated pediatric deaths occurring during the 2011-12 influenza season have been reported.
§§ No measles cases were reported for the current week.
¶¶ Data for meningococcal disease (all serogroups) are available in Table II.
*** CDC discontinued reporting of individual confirmed and probable cases of 2009 pandemic influenza A (H1N1) virus infections on July 24, 2009. During 2009, four cases of human infection with novel influenza A viruses, different from the 2009 pandemic influenza A (H1N1) strain, were reported to CDC. The four cases of novel influenza A virus infection reported to CDC during 2010, and the eight cases reported during 2011, were identified as swine influenza A (H3N2) virus and are unrelated to the 2009 pandemic influenza A (H1N1) virus. Total case counts are provided by the Influenza Division, National Center for Immunization and Respiratory Diseases (NCIRD)..
††† No rubella cases were reported for the current week.
§§§ Updated weekly from reports to the Division of STD Prevention, National Center for HIV/AIDS, Viral Hepatitis, STD, and TB Prevention.
¶¶¶ There were no cases of viral hemorrhagic fever reported during the current week. See Table II for dengue hemorrhagic fever.
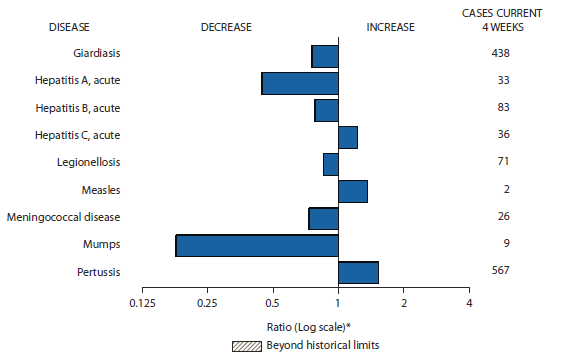
FIGURE I. Selected notifiable disease reports, United States, comparison of provisional 4-week totals February 11, 2012, with historical data
* Ratio of current 4-week total to mean of 15 4-week totals (from previous, comparable, and subsequent 4-week periods for the past 5 years). The point where the hatched area begins is based on the mean and two standard deviations of these 4-week totals.
Alternate Text: The figure above shows selected notifiable disease reports for the United States, with comparison of provisional 4-week totals through Feb. 11, 2012. Reports of acute hepatitis C, measles, and pertussis all increased. Reports of giardiasis, acute hepatitis A, acute hepatitis B, legionellosis, meningococcal disease, and mumps all decreased.
TABLE II. Provisional cases of selected notifiable diseases, United States, weeks ending February 11, 2012, and February 12, 2011 (6th week)*
Reporting area
Chlamydia trachomatis infection
Coccidioidomycosis
Cryptosporidiosis
Current week
Previous 52 weeks
Cum 2012
Cum 2011
Current week
Previous 52 weeks
Cum 2012
Cum 2011
Current week
Previous 52 weeks
Cum 2012
Cum 2011
Med
Max
Med
Max
Med
Max
United States
11,081
26,829
30,720
102,555
152,529
70
400
586
1,402
2,658
43
132
398
441
538
New England
679
892
1,594
3,316
3,871
—
0
1
—
—
1
6
22
27
30
Connecticut
—
240
869
—
150
N
0
0
N
N
—
1
9
4
8
Maine
73
59
100
378
340
N
0
0
N
N
—
1
4
2
4
Massachusetts
452
433
860
2,104
2,381
N
0
0
N
N
1
3
8
15
15
New Hampshire
5
58
90
92
363
—
0
1
—
—
—
1
5
2
1
Rhode Island
99
80
187
648
503
—
0
0
—
—
—
0
1
—
—
Vermont
50
27
84
94
134
N
0
0
N
N
—
1
5
4
2
Mid. Atlantic
1,880
3,203
3,954
15,670
18,417
—
0
0
—
—
2
15
43
50
61
New Jersey
—
540
1,004
2,160
2,599
N
0
0
N
N
—
0
1
1
—
New York (Upstate)
746
715
1,758
3,404
3,351
N
0
0
N
N
1
4
16
14
9
New York City
273
1,046
1,315
3,985
6,607
N
0
0
N
N
—
1
6
9
7
Pennsylvania
861
1,030
1,602
6,121
5,860
N
0
0
N
N
1
9
27
26
45
E.N. Central
1,246
4,131
4,603
15,809
26,466
—
1
5
5
4
8
32
148
103
127
Illinois
36
1,157
1,396
2,850
7,073
N
0
0
N
N
1
3
26
3
13
Indiana
273
550
726
2,413
3,784
N
0
0
N
N
—
3
14
—
20
Michigan
520
922
1,229
4,573
6,486
—
0
3
2
1
—
6
14
17
30
Ohio
238
1,020
1,182
3,892
6,333
—
0
2
3
3
5
11
95
59
41
Wisconsin
179
464
548
2,081
2,790
N
0
0
N
N
2
8
65
24
23
W.N. Central
10
1,501
1,817
2,228
8,720
—
0
2
—
—
2
16
85
34
61
Iowa
1
212
431
1,261
1,290
N
0
0
N
N
—
6
19
12
19
Kansas
—
208
281
104
1,159
N
0
0
N
N
—
0
11
2
—
Minnesota
—
316
401
—
2,042
—
0
0
—
—
—
0
0
—
—
Missouri
—
533
759
—
2,839
—
0
0
—
—
—
5
61
10
18
Nebraska
—
127
215
546
682
—
0
2
—
—
1
2
12
3
18
North Dakota
—
46
76
5
261
N
0
0
N
N
—
0
12
—
—
South Dakota
9
62
89
312
447
N
0
0
N
N
1
2
13
7
6
S. Atlantic
3,554
5,448
7,444
25,900
31,207
—
0
2
—
—
12
22
59
99
118
Delaware
92
86
182
436
456
—
0
0
—
—
—
0
1
1
2
District of Columbia
92
111
219
725
635
—
0
0
—
—
—
0
1
—
1
Florida
1,038
1,501
1,684
8,073
8,816
N
0
0
N
N
7
8
17
41
45
Georgia
742
1,069
1,563
5,179
4,783
N
0
0
N
N
3
5
12
20
30
Maryland
134
481
790
1,101
2,276
—
0
2
—
—
2
1
7
16
6
North Carolina
722
1,000
1,688
5,587
4,932
N
0
0
N
N
—
0
44
—
9
South Carolina
—
528
1,539
—
3,887
N
0
0
N
N
—
2
6
10
16
Virginia
734
659
1,778
4,319
4,878
N
0
0
N
N
—
2
8
10
9
West Virginia
—
81
144
480
544
N
0
0
N
N
—
0
5
1
—
E.S. Central
1,241
1,883
2,804
7,281
10,558
—
0
0
—
—
2
8
25
28
15
Alabama
527
533
1,566
2,362
3,184
N
0
0
N
N
1
2
7
12
8
Kentucky
386
301
557
1,643
1,096
N
0
0
N
N
—
2
17
3
4
Mississippi
—
398
696
—
2,682
N
0
0
N
N
—
1
4
4
2
Tennessee
328
601
782
3,276
3,596
N
0
0
N
N
1
2
6
9
1
W.S. Central
324
3,346
4,313
10,749
19,324
—
0
1
—
—
7
8
44
34
20
Arkansas
—
309
511
—
2,089
N
0
0
N
N
—
0
2
1
—
Louisiana
270
364
1,071
1,566
2,284
—
0
1
—
—
2
1
9
8
3
Oklahoma
54
143
675
543
1,224
N
0
0
N
N
2
2
6
6
4
Texas
—
2,408
3,113
8,640
13,727
N
0
0
N
N
3
5
40
19
13
Mountain
898
1,740
2,409
8,041
10,234
58
306
458
1,232
2,031
3
10
29
28
64
Arizona
109
549
802
2,935
3,112
55
303
455
1,218
2,001
—
1
4
1
3
Colorado
440
415
847
2,096
2,479
N
0
0
N
N
—
2
11
2
18
Idaho
104
85
274
439
508
N
0
0
N
N
1
1
9
11
7
Montana
74
68
88
438
391
N
0
0
N
N
2
1
6
7
4
Nevada
45
203
380
233
1,344
3
2
5
10
12
—
0
2
2
1
New Mexico
125
218
483
1,082
1,378
—
1
4
—
11
—
2
9
4
19
Utah
1
133
190
710
781
—
0
4
2
5
—
1
5
—
6
Wyoming
—
32
67
108
241
—
0
2
2
2
—
0
3
1
6
Pacific
1,249
3,977
5,428
13,561
23,732
12
92
163
165
623
6
10
20
38
42
Alaska
40
109
157
601
767
N
0
0
N
N
—
0
3
—
—
California
805
2,988
4,499
9,915
18,069
12
92
163
165
623
4
6
16
33
18
Hawaii
—
114
142
—
663
N
0
0
N
N
—
0
1
2
—
Oregon
—
273
412
1,095
1,472
N
0
0
N
N
2
2
8
3
18
Washington
404
436
611
1,950
2,761
N
0
0
N
N
—
1
15
—
6
Territories
American Samoa
—
0
0
—
—
N
0
0
N
N
N
0
0
N
N
C.N.M.I.
—
—
—
—
—
—
—
—
—
—
—
—
—
—
—
Guam
—
17
44
—
50
—
0
0
—
—
—
0
0
—
—
Puerto Rico
66
105
348
636
627
N
0
0
N
N
N
0
0
N
N
U.S. Virgin Islands
—
16
27
—
80
—
0
0
—
—
—
0
0
—
—
C.N.M.I.: Commonwealth of Northern Mariana Islands.
U: Unavailable. —: No reported cases. N: Not reportable. NN: Not Nationally Notifiable. Cum: Cumulative year-to-date counts. Med: Median. Max: Maximum.
TABLE II. (Continued) Provisional cases of selected notifiable diseases, United States, weeks ending February 11, 2012, and February 12, 2011 (6th week)*
Reporting area
Dengue Virus Infection
Dengue Fever†
Dengue Hemorrhagic Fever§
Current week
Previous 52 weeks
Cum 2012
Cum 2011
Current week
Previous 52 weeks
Cum 2012
Cum 2011
Med
Max
Med
Max
United States
—
3
16
—
28
—
0
1
—
—
New England
—
0
1
—
1
—
0
0
—
—
Connecticut
—
0
0
—
—
—
0
0
—
—
Maine
—
0
0
—
—
—
0
0
—
—
Massachusetts
—
0
0
—
—
—
0
0
—
—
New Hampshire
—
0
0
—
—
—
0
0
—
—
Rhode Island
—
0
0
—
—
—
0
0
—
—
Vermont
—
0
1
—
1
—
0
0
—
—
Mid. Atlantic
—
1
6
—
8
—
0
0
—
—
New Jersey
—
0
0
—
—
—
0
0
—
—
New York (Upstate)
—
0
2
—
—
—
0
0
—
—
New York City
—
0
4
—
4
—
0
0
—
—
Pennsylvania
—
0
2
—
4
—
0
0
—
—
E.N. Central
—
0
2
—
4
—
0
1
—
—
Illinois
—
0
1
—
—
—
0
1
—
—
Indiana
—
0
1
—
1
—
0
0
—
—
Michigan
—
0
1
—
1
—
0
0
—
—
Ohio
—
0
1
—
—
—
0
0
—
—
Wisconsin
—
0
1
—
2
—
0
0
—
—
W.N. Central
—
0
2
—
—
—
0
0
—
—
Iowa
—
0
1
—
—
—
0
0
—
—
Kansas
—
0
1
—
—
—
0
0
—
—
Minnesota
—
0
1
—
—
—
0
0
—
—
Missouri
—
0
0
—
—
—
0
0
—
—
Nebraska
—
0
0
—
—
—
0
0
—
—
North Dakota
—
0
1
—
—
—
0
0
—
—
South Dakota
—
0
0
—
—
—
0
0
—
—
S. Atlantic
—
1
8
—
8
—
0
1
—
—
Delaware
—
0
2
—
—
—
0
0
—
—
District of Columbia
—
0
0
—
—
—
0
0
—
—
Florida
—
1
7
—
5
—
0
0
—
—
Georgia
—
0
1
—
1
—
0
0
—
—
Maryland
—
0
2
—
—
—
0
0
—
—
North Carolina
—
0
1
—
1
—
0
0
—
—
South Carolina
—
0
1
—
—
—
0
0
—
—
Virginia
—
0
1
—
1
—
0
1
—
—
West Virginia
—
0
0
—
—
—
0
0
—
—
E.S. Central
—
0
3
—
—
—
0
0
—
—
Alabama
—
0
1
—
—
—
0
0
—
—
Kentucky
—
0
1
—
—
—
0
0
—
—
Mississippi
—
0
0
—
—
—
0
0
—
—
Tennessee
—
0
2
—
—
—
0
0
—
—
W.S. Central
—
0
2
—
—
—
0
0
—
—
Arkansas
—
0
0
—
—
—
0
0
—
—
Louisiana
—
0
1
—
—
—
0
0
—
—
Oklahoma
—
0
0
—
—
—
0
0
—
—
Texas
—
0
1
—
—
—
0
0
—
—
Mountain
—
0
1
—
2
—
0
0
—
—
Arizona
—
0
1
—
1
—
0
0
—
—
Colorado
—
0
0
—
—
—
0
0
—
—
Idaho
—
0
0
—
—
—
0
0
—
—
Montana
—
0
0
—
—
—
0
0
—
—
Nevada
—
0
1
—
—
—
0
0
—
—
New Mexico
—
0
1
—
1
—
0
0
—
—
Utah
—
0
1
—
—
—
0
0
—
—
Wyoming
—
0
0
—
—
—
0
0
—
—
Pacific
—
0
4
—
5
—
0
0
—
—
Alaska
—
0
0
—
—
—
0
0
—
—
California
—
0
2
—
3
—
0
0
—
—
Hawaii
—
0
4
—
—
—
0
0
—
—
Oregon
—
0
0
—
—
—
0
0
—
—
Washington
—
0
1
—
2
—
0
0
—
—
Territories
American Samoa
—
0
0
—
—
—
0
0
—
—
C.N.M.I.
—
—
—
—
—
—
—
—
—
—
Guam
—
0
0
—
—
—
0
0
—
—
Puerto Rico
—
16
83
—
125
—
0
3
—
1
U.S. Virgin Islands
—
0
0
—
—
—
0
0
—
—
C.N.M.I.: Commonwealth of Northern Mariana Islands.
U: Unavailable. —: No reported cases. N: Not reportable. NN: Not Nationally Notifiable. Cum: Cumulative year-to-date counts. Med: Median. Max: Maximum.
† Dengue Fever includes cases that meet criteria for Dengue Fever with hemorrhage, other clinical and unknown case classifications.
§ DHF includes cases that meet criteria for dengue shock syndrome (DSS), a more severe form of DHF.
TABLE II. (Continued) Provisional cases of selected notifiable diseases, United States, weeks ending February 11, 2012, and February 12, 2011 (6th week)*
Reporting area
Ehrlichiosis/Anaplasmosis†
Ehrlichia chaffeensis
Anaplasma phagocytophilum
Undetermined
Current week
Previous 52 weeks
Cum 2012
Cum 2011
Current week
Previous 52 weeks
Cum 2012
Cum 2011
Current week
Previous 52 weeks
Cum 2012
Cum 2011
Med
Max
Med
Max
Med
Max
United States
1
9
90
8
9
2
16
57
9
11
—
2
8
2
2
New England
—
0
1
—
—
—
3
28
1
4
—
0
1
—
—
Connecticut
—
0
0
—
—
—
0
0
—
—
—
0
0
—
—
Maine
—
0
1
—
—
—
0
3
1
1
—
0
0
—
—
Massachusetts
—
0
0
—
—
—
1
18
—
—
—
0
0
—
—
New Hampshire
—
0
1
—
—
—
0
4
—
—
—
0
1
—
—
Rhode Island
—
0
1
—
—
—
0
15
—
3
—
0
1
—
—
Vermont
—
0
0
—
—
—
0
1
—
—
—
0
0
—
—
Mid. Atlantic
—
1
5
—
1
2
6
35
7
3
—
0
2
—
—
New Jersey
—
0
0
—
—
—
0
0
—
—
—
0
0
—
—
New York (Upstate)
—
0
4
—
—
2
3
35
5
2
—
0
2
—
—
New York City
—
0
2
—
1
—
1
5
2
1
—
0
0
—
—
Pennsylvania
—
0
0
—
—
—
0
1
—
—
—
0
0
—
—
E.N. Central
—
0
5
—
1
—
0
2
—
1
—
0
6
—
2
Illinois
—
0
4
—
—
—
0
2
—
—
—
0
1
—
1
Indiana
—
0
0
—
—
—
0
0
—
—
—
0
4
—
1
Michigan
—
0
2
—
—
—
0
0
—
—
—
0
2
—
—
Ohio
—
0
1
—
1
—
0
1
—
—
—
0
1
—
—
Wisconsin
—
0
0
—
—
—
0
1
—
1
—
0
1
—
—
W.N. Central
—
1
16
1
—
—
0
6
—
—
—
0
6
—
—
Iowa
N
0
0
N
N
N
0
0
N
N
N
0
0
N
N
Kansas
—
0
2
—
—
—
0
1
—
—
—
0
1
—
—
Minnesota
—
0
0
—
—
—
0
1
—
—
—
0
0
—
—
Missouri
—
1
16
1
—
—
0
5
—
—
—
0
6
—
—
Nebraska
—
0
1
—
—
—
0
1
—
—
—
0
1
—
—
North Dakota
N
0
0
N
N
N
0
0
N
N
N
0
0
N
N
South Dakota
—
0
1
—
—
—
0
1
—
—
—
0
0
—
—
S. Atlantic
1
3
33
7
7
—
1
8
1
2
—
0
2
2
—
Delaware
—
0
2
—
1
—
0
1
—
—
—
0
0
—
—
District of Columbia
N
0
0
N
N
N
0
0
N
N
N
0
0
N
N
Florida
—
0
3
—
1
—
0
3
—
—
—
0
0
—
—
Georgia
1
0
3
4
1
—
0
2
1
—
—
0
1
1
—
Maryland
—
0
3
—
2
—
0
2
—
—
—
0
1
1
—
North Carolina
—
0
17
1
2
—
0
6
—
2
—
0
0
—
—
South Carolina
—
0
1
—
—
—
0
0
—
—
—
0
1
—
—
Virginia
—
1
13
2
—
—
0
3
—
—
—
0
1
—
—
West Virginia
—
0
1
—
—
—
0
0
—
—
—
0
1
—
—
E.S. Central
—
1
8
—
—
—
0
2
—
1
—
0
3
—
—
Alabama
—
0
2
—
—
—
0
1
—
1
N
0
0
N
N
Kentucky
—
0
3
—
—
—
0
0
—
—
—
0
0
—
—
Mississippi
—
0
1
—
—
—
0
1
—
—
—
0
0
—
—
Tennessee
—
0
5
—
—
—
0
1
—
—
—
0
3
—
—
W.S. Central
—
0
30
—
—
—
0
3
—
—
—
0
0
—
—
Arkansas
—
0
13
—
—
—
0
3
—
—
—
0
0
—
—
Louisiana
—
0
0
—
—
—
0
0
—
—
—
0
0
—
—
Oklahoma
—
0
25
—
—
—
0
1
—
—
—
0
0
—
—
Texas
—
0
1
—
—
—
0
1
—
—
—
0
0
—
—
Mountain
—
0
0
—
—
—
0
0
—
—
—
0
1
—
—
Arizona
—
0
0
—
—
—
0
0
—
—
—
0
1
—
—
Colorado
N
0
0
N
N
N
0
0
N
N
N
0
0
N
N
Idaho
N
0
0
N
N
N
0
0
N
N
N
0
0
N
N
Montana
N
0
0
N
N
N
0
0
N
N
N
0
0
N
N
Nevada
N
0
0
N
N
N
0
0
N
N
N
0
0
N
N
New Mexico
N
0
0
N
N
N
0
0
N
N
N
0
0
N
N
Utah
—
0
0
—
—
—
0
0
—
—
—
0
1
—
—
Wyoming
—
0
0
—
—
—
0
0
—
—
—
0
0
—
—
Pacific
—
0
0
—
—
—
0
1
—
—
—
0
2
—
—
Alaska
N
0
0
N
N
N
0
0
N
N
N
0
0
N
N
California
—
0
0
—
—
—
0
0
—
—
—
0
2
—
—
Hawaii
N
0
0
N
N
N
0
0
N
N
N
0
0
N
N
Oregon
—
0
0
—
—
—
0
1
—
—
—
0
0
—
—
Washington
—
0
0
—
—
—
0
0
—
—
—
0
0
—
—
Territories
American Samoa
N
0
0
N
N
N
0
0
N
N
N
0
0
N
N
C.N.M.I.
—
—
—
—
—
—
—
—
—
—
—
—
—
—
—
Guam
N
0
0
N
N
N
0
0
N
N
N
0
0
N
N
Puerto Rico
N
0
0
N
N
N
0
0
N
N
N
0
0
N
N
U.S. Virgin Islands
—
0
0
—
—
—
0
0
—
—
—
0
0
—
—
C.N.M.I.: Commonwealth of Northern Mariana Islands.
U: Unavailable. —: No reported cases. N: Not reportable. NN: Not Nationally Notifiable. Cum: Cumulative year-to-date counts. Med: Median. Max: Maximum.
† Cumulative total E. ewingii cases reported for year 2011 = 13, and 0 case reports for 2012.
TABLE II. (Continued) Provisional cases of selected notifiable diseases, United States, weeks ending February 11, 2012, and February 12, 2011 (6th week)*
Reporting area
Giardiasis
Gonorrhea
Haemophilus influenzae, invasive† All ages, all serotypes
Current week
Previous 52 weeks
Cum 2012
Cum 2011
Current week
Previous 52 weeks
Cum 2012
Cum 2011
Current week
Previous 52 weeks
Cum 2012
Cum 2011
Med
Max
Med
Max
Med
Max
United States
118
279
449
1,033
1,471
2,384
6,025
6,790
24,476
35,392
31
66
102
342
425
New England
3
27
64
75
135
77
108
178
357
480
1
4
9
29
27
Connecticut
—
4
10
7
26
—
44
101
—
181
—
1
4
7
7
Maine
1
3
10
8
9
7
5
18
47
15
1
0
2
3
5
Massachusetts
2
12
29
47
78
50
47
80
235
242
—
2
7
16
12
New Hampshire
—
2
8
6
7
6
2
7
11
9
—
0
2
2
1
Rhode Island
—
0
10
2
6
10
7
35
60
28
—
0
2
1
1
Vermont
—
3
19
5
9
4
0
6
4
5
—
0
2
—
1
Mid. Atlantic
24
54
90
182
282
393
744
916
3,824
4,203
6
15
28
87
80
New Jersey
—
0
0
—
—
—
150
232
602
724
—
1
6
1
15
New York (Upstate)
9
20
50
61
90
116
116
325
592
520
6
3
14
21
15
New York City
6
16
29
78
111
53
241
315
926
1,478
—
4
10
26
14
Pennsylvania
9
15
30
43
81
224
267
492
1,704
1,481
—
5
14
39
36
E.N. Central
18
47
84
157
264
304
1,063
1,275
4,190
7,078
3
11
22
38
78
Illinois
—
10
19
3
53
7
293
395
704
1,793
—
3
11
1
22
Indiana
1
6
13
8
35
49
132
170
594
1,015
—
2
6
2
10
Michigan
4
10
21
45
55
147
235
371
1,263
1,769
1
1
4
8
10
Ohio
13
15
30
74
75
65
314
403
1,154
1,991
2
4
7
23
24
Wisconsin
—
8
19
27
46
36
91
118
475
510
—
1
4
4
12
W.N. Central
4
18
50
92
113
1
313
382
428
1,710
1
2
9
10
10
Iowa
—
4
15
22
27
1
37
108
244
212
—
0
1
—
—
Kansas
1
2
9
9
14
—
42
65
31
220
—
0
2
2
—
Minnesota
—
0
0
—
—
—
44
61
—
243
—
0
0
—
—
Missouri
2
6
17
38
39
—
149
204
—
802
—
1
5
5
6
Nebraska
1
3
11
18
22
—
28
52
124
136
1
0
2
3
4
North Dakota
—
0
12
—
—
—
5
14
—
25
—
0
6
—
—
South Dakota
—
1
8
5
11
—
11
20
29
72
—
0
1
—
—
S. Atlantic
41
51
105
258
272
883
1,503
1,946
6,948
8,445
10
14
31
88
107
Delaware
—
0
3
1
2
18
15
35
97
111
—
0
2
—
—
District of Columbia
1
1
5
2
6
30
38
105
279
260
—
0
1
—
—
Florida
24
23
69
110
150
251
374
472
2,035
2,307
4
4
12
23
36
Georgia
5
11
51
87
45
216
322
456
1,532
1,507
2
2
6
17
24
Maryland
8
6
14
34
26
31
119
176
336
634
2
2
6
16
15
North Carolina
N
0
0
N
N
191
334
548
1,685
1,691
—
1
7
6
8
South Carolina
—
2
8
10
9
—
152
421
—
1,080
1
1
5
13
6
Virginia
3
5
12
14
34
146
122
353
925
742
—
2
8
7
18
West Virginia
—
0
8
—
—
—
14
29
59
113
1
0
5
6
—
E.S. Central
1
3
9
18
11
297
505
789
1,942
2,909
1
4
12
27
25
Alabama
1
3
9
18
11
148
167
408
673
993
—
1
3
5
8
Kentucky
N
0
0
N
N
91
77
151
422
285
1
1
4
6
6
Mississippi
N
0
0
N
N
—
102
196
—
755
—
0
3
5
2
Tennessee
N
0
0
N
N
58
149
222
847
876
—
2
8
11
9
W.S. Central
—
5
15
29
26
100
877
1,175
2,822
5,238
6
2
10
20
27
Arkansas
—
3
8
11
7
—
87
138
—
601
—
0
3
2
4
Louisiana
—
2
10
18
19
83
120
255
453
670
—
1
4
7
14
Oklahoma
—
0
0
—
—
17
33
196
136
421
6
1
9
11
9
Texas
N
0
0
N
N
—
589
832
2,233
3,546
—
0
1
—
—
Mountain
5
22
41
51
124
77
205
323
986
1,270
2
5
10
25
46
Arizona
1
2
6
8
13
34
87
136
556
434
—
1
6
7
20
Colorado
—
7
23
23
32
38
40
77
229
332
—
1
4
1
12
Idaho
1
3
9
6
18
—
3
15
3
14
1
0
2
2
2
Montana
1
2
5
3
2
3
1
4
9
13
—
0
1
2
1
Nevada
1
1
7
6
14
1
39
103
23
239
1
0
2
3
2
New Mexico
1
1
6
2
10
1
34
73
134
198
—
1
3
7
8
Utah
—
2
9
2
28
—
5
10
28
30
—
0
3
2
1
Wyoming
—
0
5
1
7
—
0
3
4
10
—
0
1
1
—
Pacific
22
47
163
171
244
252
631
758
2,979
4,059
1
4
9
18
25
Alaska
—
2
7
5
7
11
19
31
86
121
—
0
3
1
4
California
14
33
51
129
174
203
517
610
2,574
3,366
—
1
5
6
8
Hawaii
—
0
4
1
2
—
12
24
—
79
—
0
3
2
3
Oregon
2
6
20
21
47
—
26
60
76
156
1
1
6
9
10
Washington
6
6
132
15
14
38
50
79
243
337
—
0
1
—
—
Territories
American Samoa
—
0
0
—
—
—
0
0
—
—
—
0
0
—
—
C.N.M.I.
—
—
—
—
—
—
—
—
—
—
—
—
—
—
—
Guam
—
0
0
—
—
—
0
5
—
1
—
0
0
—
—
Puerto Rico
—
0
4
—
7
—
6
14
19
36
—
0
0
—
—
U.S. Virgin Islands
—
0
0
—
—
—
2
10
—
17
—
0
0
—
—
C.N.M.I.: Commonwealth of Northern Mariana Islands.
U: Unavailable. —: No reported cases. N: Not reportable. NN: Not Nationally Notifiable. Cum: Cumulative year-to-date counts. Med: Median. Max: Maximum.
† Data for H. influenzae (age <5 yrs for serotype b, nonserotype b, and unknown serotype) are available in Table I.
TABLE II. (Continued) Provisional cases of selected notifiable diseases, United States, weeks ending February 11, 2012, and February 12, 2011 (6th week)*
Reporting area
Hepatitis (viral, acute), by type
A
B
C
Current week
Previous 52 weeks
Cum 2012
Cum 2011
Current week
Previous 52 weeks
Cum 2012
Cum 2011
Current week
Previous 52 weeks
Cum 2012
Cum 2011
Med
Max
Med
Max
Med
Max
United States
13
22
41
71
141
17
47
97
189
315
10
19
38
84
91
New England
—
1
5
2
11
—
1
8
—
15
—
1
5
2
8
Connecticut
—
0
3
2
5
—
0
4
—
1
—
0
4
2
7
Maine
—
0
2
—
—
—
0
2
—
1
—
0
3
—
—
Massachusetts
—
0
3
—
3
—
0
6
—
12
—
0
2
—
1
New Hampshire
—
0
0
—
—
—
0
1
—
1
N
0
0
N
N
Rhode Island
—
0
1
—
1
U
0
0
U
U
U
0
0
U
U
Vermont
—
0
2
—
2
—
0
0
—
—
—
0
1
—
—
Mid. Atlantic
3
3
7
12
20
1
5
8
12
28
3
2
5
11
6
New Jersey
—
0
0
—
—
—
0
1
2
—
—
0
1
1
—
New York (Upstate)
1
1
4
5
3
1
1
4
2
7
2
1
4
3
4
New York City
—
1
4
3
10
—
1
5
4
9
—
0
1
—
—
Pennsylvania
2
1
4
4
7
—
2
4
4
12
1
1
3
7
2
E.N. Central
1
3
7
7
29
4
6
37
24
63
—
2
8
8
22
Illinois
—
1
5
1
6
—
1
3
1
16
—
0
2
—
1
Indiana
—
0
1
—
4
—
1
4
3
8
—
0
5
2
14
Michigan
—
1
6
5
8
—
1
6
3
16
—
1
4
6
6
Ohio
1
0
2
1
9
4
1
30
17
20
—
0
1
—
—
Wisconsin
—
0
1
—
2
—
0
3
—
3
—
0
1
—
1
W.N. Central
1
1
7
5
6
—
2
9
6
15
—
0
4
1
—
Iowa
—
0
1
—
1
—
0
1
—
1
—
0
0
—
—
Kansas
—
0
1
—
—
—
0
2
—
3
—
0
1
1
—
Minnesota
—
0
7
—
—
—
0
7
—
—
—
0
2
—
—
Missouri
—
0
1
2
3
—
1
4
5
6
—
0
0
—
—
Nebraska
1
0
1
3
—
—
0
2
1
4
—
0
1
—
—
North Dakota
—
0
0
—
—
—
0
0
—
—
—
0
0
—
—
South Dakota
—
0
0
—
2
—
0
0
—
1
—
0
0
—
—
S. Atlantic
3
4
11
14
30
5
12
57
55
72
5
5
14
26
17
Delaware
1
0
1
1
1
—
0
2
2
—
U
0
0
U
U
District of Columbia
—
0
0
—
—
—
0
0
—
—
—
0
0
—
—
Florida
2
1
8
6
9
4
4
7
18
25
4
1
3
11
5
Georgia
—
1
5
1
8
—
2
7
7
18
—
1
3
1
4
Maryland
—
0
4
1
4
—
1
4
12
8
—
1
3
2
2
North Carolina
—
0
3
2
2
—
1
9
5
10
—
1
7
3
4
South Carolina
—
0
2
—
2
—
1
3
2
5
—
0
1
—
—
Virginia
—
0
3
2
4
1
1
4
9
6
1
0
3
2
2
West Virginia
—
0
2
1
—
—
0
43
—
—
—
0
7
7
—
E.S. Central
—
1
6
1
3
3
10
18
55
54
2
5
10
20
16
Alabama
—
0
2
—
—
—
2
6
9
7
—
0
3
2
—
Kentucky
—
0
2
—
2
2
3
10
22
21
1
2
8
10
9
Mississippi
—
0
1
—
1
—
1
4
2
3
U
0
0
U
U
Tennessee
—
0
5
1
—
1
4
8
22
23
1
1
5
8
7
W.S. Central
5
3
7
14
5
4
6
14
17
25
—
1
5
5
9
Arkansas
—
0
2
—
—
—
1
4
—
3
—
0
0
—
—
Louisiana
—
0
2
—
1
—
0
2
3
9
—
0
1
—
4
Oklahoma
—
0
2
—
—
—
1
9
2
3
—
1
4
—
3
Texas
5
3
7
14
4
4
3
11
12
10
—
0
3
5
2
Mountain
—
1
5
7
11
—
1
4
8
15
—
1
5
2
7
Arizona
—
0
2
2
4
—
0
3
1
2
U
0
0
U
U
Colorado
—
0
2
3
5
—
0
2
—
2
—
0
2
—
2
Idaho
—
0
1
1
—
—
0
1
—
2
—
0
2
—
3
Montana
—
0
1
—
1
—
0
0
—
—
—
0
2
—
—
Nevada
—
0
3
1
—
—
0
3
7
6
—
0
2
2
—
New Mexico
—
0
1
—
1
—
0
2
—
—
—
0
2
—
—
Utah
—
0
1
—
—
—
0
1
—
3
—
0
2
—
2
Wyoming
—
0
1
—
—
—
0
0
—
—
—
0
1
—
—
Pacific
—
3
11
9
26
—
3
8
12
28
—
2
10
9
6
Alaska
—
0
1
—
—
—
0
1
—
1
U
0
0
U
U
California
—
3
7
6
23
—
2
7
7
21
—
1
4
4
2
Hawaii
—
0
2
—
1
—
0
1
1
2
U
0
0
U
U
Oregon
—
0
2
1
1
—
0
4
3
4
—
0
2
3
3
Washington
—
0
4
2
1
—
0
3
1
—
—
0
8
2
1
Territories
American Samoa
—
0
0
—
—
—
0
0
—
—
—
0
0
—
—
C.N.M.I.
—
—
—
—
—
—
—
—
—
—
—
—
—
—
—
Guam
—
0
5
—
1
—
2
8
—
7
—
0
3
—
3
Puerto Rico
—
0
1
—
—
—
0
2
—
—
N
0
0
N
N
U.S. Virgin Islands
—
0
0
—
—
—
0
0
—
—
—
0
0
—
—
C.N.M.I.: Commonwealth of Northern Mariana Islands.
U: Unavailable. —: No reported cases. N: Not reportable. NN: Not Nationally Notifiable. Cum: Cumulative year-to-date counts. Med: Median. Max: Maximum.
TABLE II. (Continued) Provisional cases of selected notifiable diseases, United States, weeks ending February 11, 2012, and February 12, 2011 (6th week)*
Reporting area
Legionellosis
Lyme disease
Malaria
Current week
Previous 52 weeks
Cum 2012
Cum 2011
Current week
Previous 52 weeks
Cum 2012
Cum 2011
Current week
Previous 52 weeks
Cum 2012
Cum 2011
Med
Max
Med
Max
Med
Max
United States
19
68
168
176
218
55
410
1,618
1,091
937
8
25
48
96
148
New England
1
4
40
7
20
—
81
504
64
300
—
1
7
6
11
Connecticut
—
1
11
2
3
—
36
234
3
125
—
0
2
—
1
Maine
—
0
3
—
—
—
13
67
23
20
—
0
2
—
—
Massachusetts
1
3
24
4
13
—
17
106
16
99
—
1
6
5
8
New Hampshire
—
0
3
—
1
—
10
90
6
43
—
0
1
—
—
Rhode Island
—
0
9
1
2
—
1
31
1
1
—
0
2
—
—
Vermont
—
0
2
—
1
—
6
70
15
12
—
0
1
1
2
Mid. Atlantic
5
15
77
37
51
41
200
765
851
375
—
6
13
13
39
New Jersey
—
0
0
—
—
—
2
144
511
1
—
0
0
—
—
New York (Upstate)
1
6
27
13
14
29
56
211
79
41
—
1
4
2
4
New York City
—
3
14
6
18
—
1
16
—
14
—
4
11
9
28
Pennsylvania
4
5
42
18
19
12
111
538
261
319
—
1
5
2
7
E.N. Central
2
13
51
35
36
—
23
284
12
83
2
3
10
7
16
Illinois
—
2
11
2
5
—
1
21
—
4
—
1
5
—
6
Indiana
1
2
8
7
6
—
1
12
—
—
—
0
2
1
1
Michigan
—
2
15
—
7
—
1
12
6
—
—
0
4
1
1
Ohio
1
7
34
26
18
—
1
6
5
3
2
0
4
4
7
Wisconsin
—
0
1
—
—
—
20
242
1
76
—
0
2
1
1
W.N. Central
—
1
8
4
4
1
1
16
3
2
1
1
5
6
2
Iowa
—
0
2
—
—
—
0
13
1
1
—
0
3
1
—
Kansas
—
0
2
—
—
—
0
2
—
—
1
0
2
2
—
Minnesota
—
0
0
—
—
—
0
0
—
—
—
0
0
—
—
Missouri
—
1
5
4
3
—
0
2
—
1
—
0
2
3
1
Nebraska
—
0
2
—
—
1
0
2
2
—
—
0
1
—
1
North Dakota
—
0
1
—
—
—
0
9
—
—
—
0
0
—
—
South Dakota
—
0
1
—
1
—
0
2
—
—
—
0
1
—
—
S. Atlantic
3
11
30
51
30
12
64
180
143
170
2
8
25
38
50
Delaware
—
0
4
3
—
3
13
48
34
52
1
0
3
1
—
District of Columbia
—
0
3
1
—
—
0
3
1
2
—
0
2
—
3
Florida
2
4
13
26
15
2
3
8
12
3
—
2
6
14
9
Georgia
—
1
4
4
3
—
0
5
5
1
1
1
6
5
10
Maryland
1
2
15
5
3
3
20
116
50
61
—
2
15
10
12
North Carolina
—
1
7
4
4
—
0
12
1
6
—
0
7
1
5
South Carolina
—
0
5
2
—
—
0
6
1
1
—
0
1
2
—
Virginia
—
1
7
6
5
4
16
75
33
41
—
1
8
5
11
West Virginia
—
0
5
—
—
—
0
13
6
3
—
0
1
—
—
E.S. Central
—
2
11
4
8
—
1
5
1
—
—
1
4
—
2
Alabama
—
0
2
1
1
—
0
2
—
—
—
0
3
—
1
Kentucky
—
1
4
—
3
—
0
1
1
—
—
0
2
—
—
Mississippi
—
0
3
—
1
—
0
1
—
—
—
0
1
—
—
Tennessee
—
1
8
3
3
—
0
4
—
—
—
0
3
—
1
W.S. Central
—
3
8
2
8
1
1
4
2
1
1
1
5
6
5
Arkansas
—
0
2
—
—
—
0
0
—
—
—
0
1
—
—
Louisiana
—
0
3
—
4
—
0
1
1
—
—
0
1
—
—
Oklahoma
—
0
3
—
1
—
0
0
—
—
1
0
3
4
1
Texas
—
2
7
2
3
1
1
4
1
1
—
0
5
2
4
Mountain
1
2
9
8
15
—
1
5
5
1
2
1
5
4
9
Arizona
—
1
4
3
4
—
0
4
1
—
—
0
4
—
3
Colorado
—
0
4
—
6
—
0
1
—
—
—
0
3
—
3
Idaho
—
0
1
1
1
—
0
2
2
—
—
0
1
—
—
Montana
—
0
1
—
—
—
0
3
—
—
—
0
1
—
—
Nevada
1
0
2
2
1
—
0
1
—
—
2
0
2
4
2
New Mexico
—
0
2
—
—
—
0
2
—
1
—
0
1
—
1
Utah
—
0
2
1
3
—
0
1
1
—
—
0
1
—
—
Wyoming
—
0
2
1
—
—
0
1
1
—
—
0
0
—
—
Pacific
7
6
17
28
46
—
2
8
10
5
—
3
11
16
14
Alaska
—
0
0
—
—
—
0
3
—
—
—
0
2
1
2
California
7
4
11
24
40
—
1
8
10
3
—
3
7
14
8
Hawaii
—
0
2
—
1
N
0
0
N
N
—
0
1
—
—
Oregon
—
0
3
4
1
—
0
2
—
2
—
0
4
1
3
Washington
—
0
13
—
4
—
0
5
—
—
—
0
2
—
1
Territories
American Samoa
N
0
0
N
N
N
0
0
N
N
—
0
1
—
—
C.N.M.I.
—
—
—
—
—
—
—
—
—
—
—
—
—
—
—
Guam
—
0
0
—
—
—
0
0
—
—
—
0
0
—
—
Puerto Rico
—
0
0
—
—
N
0
0
N
N
—
0
0
—
—
U.S. Virgin Islands
—
0
0
—
—
—
0
0
—
—
—
0
0
—
—
C.N.M.I.: Commonwealth of Northern Mariana Islands.
U: Unavailable. —: No reported cases. N: Not reportable. NN: Not Nationally Notifiable. Cum: Cumulative year-to-date counts. Med: Median. Max: Maximum.
TABLE II. (Continued) Provisional cases of selected notifiable diseases, United States, weeks ending February 11, 2012, and February 12, 2011 (6th week)*
Reporting area
Meningococcal disease, invasive† All serogroups
Mumps
Pertussis
Current week
Previous 52 weeks
Cum 2012
Cum 2011
Current week
Previous 52 weeks
Cum 2012
Cum 2011
Current week
Previous 52 weeks
Cum 2012
Cum 2011
Med
Max
Med
Max
Med
Max
United States
9
12
26
58
105
2
7
19
18
42
147
308
760
1,562
2,132
New England
1
0
3
1
3
—
0
2
—
1
10
17
32
111
57
Connecticut
—
0
1
—
1
—
0
0
—
—
—
1
5
2
10
Maine
—
0
1
—
—
—
0
2
—
—
—
3
19
16
10
Massachusetts
1
0
2
1
2
—
0
1
—
1
1
4
10
24
23
New Hampshire
—
0
1
—
—
—
0
0
—
—
—
2
13
3
8
Rhode Island
—
0
1
—
—
—
0
2
—
—
—
0
8
12
6
Vermont
—
0
3
—
—
—
0
1
—
—
9
1
16
54
—
Mid. Atlantic
—
1
4
8
11
1
0
7
1
5
65
40
167
371
183
New Jersey
—
0
0
—
—
—
0
1
—
5
—
4
10
6
15
New York (Upstate)
—
0
4
1
1
—
0
3
—
—
46
13
135
207
53
New York City
—
0
2
3
6
—
0
6
—
—
—
4
42
29
—
Pennsylvania
—
0
2
4
4
1
0
1
1
—
19
13
30
129
115
E.N. Central
1
2
6
6
15
—
2
12
4
12
14
67
214
442
536
Illinois
—
0
3
—
4
—
1
10
—
4
—
21
122
98
102
Indiana
—
0
2
—
2
—
0
2
1
—
—
4
21
10
48
Michigan
—
0
1
—
3
—
0
2
2
2
3
10
38
49
136
Ohio
1
0
2
5
4
—
0
2
1
5
8
13
25
82
185
Wisconsin
—
0
2
1
2
—
0
1
—
1
3
13
64
203
65
W.N. Central
—
1
3
3
8
—
0
3
1
5
7
22
119
112
119
Iowa
—
0
1
—
1
—
0
2
—
—
—
4
9
16
35
Kansas
—
0
1
—
1
—
0
1
—
1
—
2
6
11
17
Minnesota
—
0
0
—
—
—
0
1
—
—
—
0
110
—
—
Missouri
—
0
2
3
3
—
0
2
1
3
5
8
33
80
47
Nebraska
—
0
2
—
3
—
0
1
—
1
2
1
5
3
15
North Dakota
—
0
1
—
—
—
0
3
—
—
—
0
10
—
3
South Dakota
—
0
1
—
—
—
0
0
—
—
—
0
7
2
2
S. Atlantic
3
2
8
9
13
—
1
4
4
1
19
26
51
138
233
Delaware
—
0
1
—
—
—
0
0
—
—
1
0
5
5
3
District of Columbia
—
0
1
—
—
—
0
1
—
—
—
0
2
1
1
Florida
3
1
5
7
4
—
0
2
2
—
13
6
17
52
34
Georgia
—
0
1
—
1
—
0
2
—
—
—
3
7
9
37
Maryland
—
0
2
2
1
—
0
1
1
—
3
2
10
20
20
North Carolina
—
0
3
—
3
—
0
2
—
—
—
3
10
5
59
South Carolina
—
0
1
—
2
—
0
1
—
—
—
2
9
6
26
Virginia
—
0
2
—
2
—
0
4
—
1
2
6
25
25
53
West Virginia
—
0
3
—
—
—
0
1
1
—
—
0
15
15
—
E.S. Central
—
0
3
—
6
—
0
1
—
2
1
9
17
54
78
Alabama
—
0
2
—
5
—
0
1
—
1
—
2
11
2
21
Kentucky
—
0
2
—
—
—
0
0
—
—
—
3
9
27
34
Mississippi
—
0
1
—
1
—
0
1
—
1
—
0
4
5
4
Tennessee
—
0
2
—
—
—
0
1
—
—
1
2
7
20
19
W.S. Central
1
1
5
2
9
—
1
13
2
11
8
19
97
47
73
Arkansas
—
0
2
—
2
—
0
2
—
—
—
1
5
1
7
Louisiana
—
0
2
1
3
—
0
0
—
—
—
0
3
2
7
Oklahoma
1
0
2
1
1
—
0
2
—
—
—
0
11
—
2
Texas
—
0
2
—
3
—
1
13
2
11
8
18
94
44
57
Mountain
2
1
4
5
6
—
0
2
2
1
4
39
82
169
301
Arizona
—
0
1
1
2
—
0
0
—
—
1
12
48
93
117
Colorado
—
0
1
—
1
—
0
1
1
—
—
7
25
28
69
Idaho
1
0
1
1
2
—
0
2
—
—
2
3
12
12
17
Montana
—
0
2
1
—
—
0
1
1
—
—
1
32
10
22
Nevada
1
0
1
1
—
—
0
0
—
—
1
0
5
10
7
New Mexico
—
0
1
1
—
—
0
1
—
1
—
4
24
11
11
Utah
—
0
2
—
1
—
0
0
—
—
—
6
15
2
56
Wyoming
—
0
0
—
—
—
0
1
—
—
—
0
3
3
2
Pacific
1
3
11
24
34
1
0
11
4
4
19
60
251
118
552
Alaska
—
0
1
—
1
—
0
1
—
—
1
0
3
10
12
California
—
2
7
16
26
—
0
11
3
—
—
35
78
19
490
Hawaii
—
0
1
—
1
—
0
1
—
1
—
1
9
9
6
Oregon
1
0
4
8
4
—
0
1
—
3
2
5
23
14
24
Washington
—
0
3
—
2
1
0
1
1
—
16
11
199
66
20
Territories
American Samoa
—
0
0
—
—
—
0
0
—
—
—
0
0
—
—
C.N.M.I.
—
—
—
—
—
—
—
—
—
—
—
—
—
—
—
Guam
—
0
0
—
—
—
1
3
—
4
—
2
14
—
4
Puerto Rico
—
0
0
—
—
—
0
1
1
—
—
0
1
—
1
U.S. Virgin Islands
—
0
0
—
—
—
0
0
—
—
—
0
0
—
—
C.N.M.I.: Commonwealth of Northern Mariana Islands.
U: Unavailable. —: No reported cases. N: Not reportable. NN: Not Nationally Notifiable. Cum: Cumulative year-to-date counts. Med: Median. Max: Maximum.
† Data for meningococcal disease, invasive caused by serogroups A, C, Y, and W-135; serogroup B; other serogroup; and unknown serogroup are available in Table I.
TABLE II. (Continued) Provisional cases of selected notifiable diseases, United States, weeks ending February 11, 2012, and February 12, 2011 (6th week)*
Reporting area
Rabies, animal
Salmonellosis
Shiga toxin-producing E. coli(STEC)†
Current week
Previous 52 weeks
Cum 2012
Cum 2011
Current week
Previous 52 weeks
Cum 2012
Cum 2011
Current week
Previous 52 weeks
Cum 2012
Cum 2011
Med
Max
Med
Max
Med
Max
United States
36
60
104
164
304
230
870
1,859
2,163
2,824
15
84
206
196
229
New England
5
5
16
36
10
1
36
107
83
139
—
3
13
7
11
Connecticut
—
2
10
13
2
—
8
30
18
38
—
1
4
2
7
Maine
3
1
6
14
2
—
2
7
7
12
—
0
3
—
—
Massachusetts
—
0
0
—
—
1
19
44
46
68
—
1
9
5
2
New Hampshire
—
0
3
3
1
—
3
8
5
12
—
0
3
—
2
Rhode Island
2
0
6
4
—
—
1
62
—
4
—
0
2
—
—
Vermont
—
0
2
2
5
—
1
8
7
5
—
0
3
—
—
Mid. Atlantic
4
16
36
22
79
25
74
172
194
238
2
9
28
29
34
New Jersey
—
0
0
—
—
—
0
3
3
—
—
0
1
1
—
New York (Upstate)
4
7
20
22
27
16
25
67
55
51
1
3
13
6
10
New York City
—
0
3
—
1
3
19
42
63
77
—
2
6
7
6
Pennsylvania
—
8
21
—
51
6
31
113
73
110
1
3
16
15
18
E.N. Central
1
2
17
3
4
14
88
184
157
354
—
15
52
29
53
Illinois
—
0
6
—
3
—
27
80
26
122
—
4
14
5
9
Indiana
—
0
7
—
—
—
8
27
10
33
—
1
10
—
9
Michigan
1
1
6
2
1
3
14
42
41
61
—
3
19
19
13
Ohio
—
1
5
1
—
11
20
46
73
92
—
3
10
5
10
Wisconsin
N
0
0
N
N
—
12
46
7
46
—
3
21
—
12
W.N. Central
5
1
8
11
1
14
39
99
124
127
2
11
40
33
17
Iowa
—
0
0
—
—
—
8
19
16
33
—
2
15
5
4
Kansas
1
0
4
5
1
1
8
27
36
20
—
2
8
4
3
Minnesota
—
0
0
—
—
—
0
0
—
—
—
0
0
—
—
Missouri
—
0
4
2
—
9
15
42
53
53
1
5
32
16
5
Nebraska
—
0
3
—
—
4
4
13
13
12
1
1
8
5
5
North Dakota
4
0
3
4
—
—
0
15
—
—
—
0
4
—
—
South Dakota
—
0
0
—
—
—
3
10
6
9
—
1
4
3
—
S. Atlantic
12
17
48
37
190
76
276
739
840
840
5
12
25
45
43
Delaware
—
0
0
—
—
1
3
12
8
12
—
0
2
1
—
District of Columbia
—
0
0
—
—
—
1
6
—
5
1
0
1
1
1
Florida
11
0
2
13
120
47
107
203
378
324
3
3
9
23
6
Georgia
—
0
0
—
—
17
45
138
113
142
—
2
8
4
7
Maryland
—
6
13
17
18
4
19
46
71
68
1
1
4
2
8
North Carolina
—
0
0
—
—
—
32
251
127
126
—
2
11
4
13
South Carolina
N
0
0
N
N
1
26
71
70
78
—
0
4
2
—
Virginia
—
11
27
—
52
6
19
54
65
85
—
2
8
8
8
West Virginia
1
0
30
7
—
—
0
18
8
—
—
0
2
—
—
E.S. Central
—
3
11
7
11
16
64
190
182
220
—
4
18
13
13
Alabama
—
2
7
6
6
5
19
70
52
78
—
1
15
4
2
Kentucky
—
0
2
1
1
4
11
30
32
32
—
1
5
3
4
Mississippi
—
0
1
—
—
2
22
66
51
39
—
0
4
4
1
Tennessee
—
1
4
—
4
5
15
51
47
71
—
1
11
2
6
W.S. Central
8
1
21
36
—
18
132
250
163
251
2
10
49
13
15
Arkansas
—
0
10
1
—
—
13
52
28
36
—
1
6
3
1
Louisiana
—
0
0
—
—
1
14
44
48
52
—
0
1
—
—
Oklahoma
—
0
21
4
—
15
13
31
38
23
2
1
10
5
4
Texas
8
0
7
31
—
2
92
158
49
140
—
7
49
5
10
Mountain
1
1
4
11
—
8
45
93
121
240
—
11
27
15
25
Arizona
N
0
0
N
N
4
15
35
51
84
—
2
7
2
2
Colorado
—
0
0
—
—
—
9
23
18
50
—
3
9
2
12
Idaho
—
0
1
—
—
3
2
8
7
23
—
1
8
2
4
Montana
N
0
0
N
N
—
2
10
7
5
—
1
4
—
—
Nevada
—
0
2
—
—
1
3
7
8
19
—
1
7
1
1
New Mexico
1
0
4
11
—
—
5
22
13
33
—
1
3
3
3
Utah
—
0
2
—
—
—
6
15
15
23
—
1
7
2
3
Wyoming
—
0
0
—
—
—
1
9
2
3
—
0
7
3
—
Pacific
—
4
13
1
9
58
92
173
299
415
4
9
28
12
18
Alaska
—
0
2
1
4
—
1
6
7
8
—
0
1
—
—
California
—
3
12
—
3
36
72
141
235
310
—
4
14
3
13
Hawaii
—
0
0
—
—
—
7
14
10
40
—
0
2
—
—
Oregon
—
0
2
—
2
—
6
12
16
42
1
1
11
4
4
Washington
—
0
0
—
—
22
9
40
31
15
3
2
19
5
1
Territories
American Samoa
N
0
0
N
N
—
0
0
—
—
—
0
0
—
—
C.N.M.I.
—
—
—
—
—
—
—
—
—
—
—
—
—
—
—
Guam
—
0
0
—
—
—
0
2
—
3
—
0
0
—
—
Puerto Rico
—
0
6
—
2
—
3
12
3
14
—
0
0
—
—
U.S. Virgin Islands
—
0
0
—
—
—
0
0
—
—
—
0
0
—
—
C.N.M.I.: Commonwealth of Northern Mariana Islands.
U: Unavailable. —: No reported cases. N: Not reportable. NN: Not Nationally Notifiable. Cum: Cumulative year-to-date counts. Med: Median. Max: Maximum.
† Includes E. coli O157:H7; Shiga toxin-positive, serogroup non-O157; and Shiga toxin-positive, not serogrouped.
TABLE II. (Continued) Provisional cases of selected notifiable diseases, United States, weeks ending February 11, 2012, and February 12, 2011 (6th week)*
Reporting area
Shigellosis
Spotted Fever Rickettsiosis (including RMSF)†
Confirmed
Probable
Current week
Previous 52 weeks
Cum 2012
Cum 2011
Current week
Previous 52 weeks
Cum 2012
Cum 2011
Current week
Previous 52 weeks
Cum 2012
Cum 2011
Med
Max
Med
Max
Med
Max
United States
107
245
355
933
926
3
3
15
11
8
3
29
138
38
32
New England
1
4
21
10
22
—
0
1
—
—
—
0
1
—
—
Connecticut
—
1
4
2
4
—
0
0
—
—
—
0
0
—
—
Maine
—
0
8
—
1
—
0
0
—
—
—
0
1
—
—
Massachusetts
1
3
20
8
16
—
0
0
—
—
—
0
1
—
—
New Hampshire
—
0
1
—
—
—
0
1
—
—
—
0
1
—
—
Rhode Island
—
0
3
—
—
—
0
0
—
—
—
0
1
—
—
Vermont
—
0
1
—
1
—
0
0
—
—
—
0
0
—
—
Mid. Atlantic
8
19
49
157
51
2
0
2
3
—
—
1
7
4
2
New Jersey
—
0
24
49
—
—
0
0
—
—
—
0
0
—
—
New York (Upstate)
6
6
35
46
15
—
0
1
—
—
—
0
2
—
—
New York City
1
8
28
54
26
—
0
0
—
—
—
0
3
2
2
Pennsylvania
1
2
13
8
10
2
0
2
3
—
—
0
3
2
—
E.N. Central
10
14
40
124
90
—
0
2
1
—
—
2
10
2
3
Illinois
—
4
16
—
34
—
0
1
—
—
—
1
4
1
2
Indiana
—
1
6
—
9
—
0
1
1
—
—
1
5
1
—
Michigan
1
3
11
20
17
—
0
1
—
—
—
0
1
—
—
Ohio
9
6
27
104
30
—
0
2
—
—
—
0
2
—
1
Wisconsin
—
0
0
—
—
—
0
0
—
—
—
0
0
—
—
W.N. Central
1
5
18
34
57
—
0
4
—
—
—
4
24
3
4
Iowa
—
0
3
2
4
—
0
0
—
—
—
0
2
—
—
Kansas
1
1
6
17
13
—
0
0
—
—
—
0
0
—
—
Minnesota
—
0
0
—
—
—
0
0
—
—
—
0
0
—
—
Missouri
—
3
14
13
38
—
0
2
—
—
—
4
22
3
4
Nebraska
—
0
2
2
1
—
0
3
—
—
—
0
1
—
—
North Dakota
—
0
0
—
—
—
0
1
—
—
—
0
0
—
—
South Dakota
—
0
2
—
1
—
0
1
—
—
—
0
0
—
—
S. Atlantic
41
75
134
216
301
1
1
9
6
4
1
6
57
18
13
Delaware
—
0
2
—
—
—
0
1
—
—
—
0
4
1
—
District of Columbia
—
0
5
1
5
—
0
1
—
—
—
0
1
—
—
Florida
22
50
98
126
181
—
0
1
—
1
—
0
2
4
—
Georgia
9
13
26
57
52
1
1
8
6
1
—
0
0
—
—
Maryland
10
2
7
17
13
—
0
1
—
1
—
0
3
2
1
North Carolina
—
3
19
7
32
—
0
4
—
1
—
0
49
3
8
South Carolina
—
1
54
2
7
—
0
2
—
—
—
0
2
—
1
Virginia
—
2
7
6
11
—
0
1
—
—
1
3
14
8
3
West Virginia
—
0
2
—
—
—
0
0
—
—
—
0
1
—
—
E.S. Central
12
19
51
151
49
—
0
2
—
—
2
4
25
6
5
Alabama
2
6
21
43
22
—
0
1
—
—
1
1
8
2
3
Kentucky
6
4
22
70
4
—
0
1
—
—
—
0
2
—
—
Mississippi
2
4
24
27
6
—
0
0
—
—
—
0
2
—
1
Tennessee
2
4
11
11
17
—
0
2
—
—
1
4
20
4
1
W.S. Central
20
54
129
144
123
—
0
3
—
—
—
2
52
1
1
Arkansas
—
2
7
8
3
—
0
3
—
—
—
1
52
—
—
Louisiana
—
4
21
12
18
—
0
0
—
—
—
0
2
1
—
Oklahoma
6
4
28
32
7
—
0
1
—
—
—
0
25
—
—
Texas
14
43
99
92
95
—
0
1
—
—
—
0
4
—
1
Mountain
—
14
41
34
90
—
0
3
—
4
—
1
7
3
4
Arizona
—
6
27
23
38
—
0
3
—
4
—
0
6
—
4
Colorado
—
1
8
2
13
—
0
0
—
—
—
0
1
—
—
Idaho
—
0
3
1
3
—
0
0
—
—
—
0
2
2
—
Montana
—
1
15
3
5
—
0
0
—
—
—
0
1
—
—
Nevada
—
0
4
1
6
—
0
0
—
—
—
0
1
—
—
New Mexico
—
2
7
3
20
—
0
0
—
—
—
0
0
—
—
Utah
—
1
4
1
5
—
0
0
—
—
—
0
1
1
—
Wyoming
—
0
1
—
—
—
0
0
—
—
—
0
2
—
—
Pacific
14
19
44
63
143
—
0
2
1
—
—
0
1
1
—
Alaska
—
0
2
2
—
N
0
0
N
N
N
0
0
N
N
California
11
15
41
53
125
—
0
2
1
—
—
0
1
1
—
Hawaii
—
1
3
—
9
N
0
0
N
N
N
0
0
N
N
Oregon
—
1
4
5
6
—
0
0
—
—
—
0
0
—
—
Washington
3
1
9
3
3
—
0
0
—
—
—
0
0
—
—
Territories
American Samoa
—
0
0
—
1
N
0
0
N
N
N
0
0
N
N
C.N.M.I.
—
—
—
—
—
—
—
—
—
—
—
—
—
—
—
Guam
—
0
1
—
—
N
0
0
N
N
N
0
0
N
N
Puerto Rico
—
0
0
—
—
N
0
0
N
N
N
0
0
N
N
U.S. Virgin Islands
—
0
0
—
—
—
0
0
—
—
—
0
0
—
—
C.N.M.I.: Commonwealth of Northern Mariana Islands.
U: Unavailable. —: No reported cases. N: Not reportable. NN: Not Nationally Notifiable. Cum: Cumulative year-to-date counts. Med: Median. Max: Maximum.
† Illnesses with similar clinical presentation that result from Spotted fever group rickettsia infections are reported as Spotted fever rickettsioses. Rocky Mountain spotted fever (RMSF) caused by Rickettsia rickettsii, is the most common and well-known spotted fever.
TABLE II. (Continued) Provisional cases of selected notifiable diseases, United States, weeks ending February 11, 2012, and February 12, 2011 (6th week)*
Reporting area
Streptococcus pneumoniae,† invasive disease
Syphilis, primary and secondary
All ages
Age <5
Current week
Previous 52 weeks
Cum 2012
Cum 2011
Current week
Previous 52 weeks
Cum 2012
Cum 2011
Current week
Previous 52 weeks
Cum 2012
Cum 2011
Med
Max
Med
Max
Med
Max
United States
190
252
464
1,596
2,174
15
21
41
110
124
77
265
308
792
1,410
New England
2
13
31
60
130
1
1
4
3
3
3
7
23
23
39
Connecticut
—
6
20
27
64
—
0
3
—
—
—
0
12
—
4
Maine
—
2
8
13
21
—
0
1
—
—
—
0
2
—
2
Massachusetts
2
0
3
5
4
1
0
2
2
2
1
5
10
19
24
New Hampshire
—
1
8
7
15
—
0
1
1
—
—
0
3
1
3
Rhode Island
—
1
6
—
22
—
0
1
—
1
2
0
7
3
6
Vermont
—
1
6
8
4
—
0
2
—
—
—
0
2
—
—
Mid. Atlantic
41
16
53
242
137
3
1
10
12
5
9
29
53
90
191
New Jersey
—
0
16
42
—
—
0
2
4
—
—
4
13
—
23
New York (Upstate)
33
1
28
131
12
3
1
10
7
5
2
4
9
12
14
New York City
8
12
24
69
125
—
0
9
1
—
—
14
24
32
114
Pennsylvania
N
0
0
N
N
N
0
0
N
N
7
7
17
46
40
E.N. Central
29
64
122
345
460
1
3
10
16
22
2
29
48
48
177
Illinois
N
0
0
N
N
—
0
0
—
—
—
11
24
25
67
Indiana
2
13
36
42
106
—
1
4
1
2
2
3
8
10
21
Michigan
8
13
26
77
91
1
0
2
5
7
—
4
12
1
31
Ohio
19
28
43
177
199
—
1
7
7
10
—
8
17
10
51
Wisconsin
—
8
23
49
64
—
0
2
3
3
—
1
6
2
7
W.N. Central
3
2
28
24
18
—
0
2
1
1
—
6
13
3
45
Iowa
N
0
0
N
N
N
0
0
N
N
—
0
3
2
1
Kansas
N
0
0
N
N
N
0
0
N
N
—
0
4
—
1
Minnesota
—
0
0
—
—
—
0
0
—
—
—
2
8
—
23
Missouri
N
0
0
N
N
—
0
0
—
—
—
2
8
—
19
Nebraska
3
2
9
24
18
—
0
2
1
1
—
0
2
1
1
North Dakota
—
0
25
—
—
—
0
1
—
—
—
0
1
—
—
South Dakota
N
0
0
N
N
—
0
0
—
—
—
0
0
—
—
S. Atlantic
62
65
143
443
690
7
6
15
37
42
45
66
90
259
306
Delaware
—
1
5
6
13
—
0
0
—
—
—
0
4
7
3
District of Columbia
—
1
5
1
9
—
0
1
1
1
2
3
8
26
22
Florida
29
21
55
168
285
2
2
8
14
18
2
24
36
96
143
Georgia
14
19
38
126
189
2
1
5
10
15
15
12
37
48
22
Maryland
10
9
29
46
102
1
1
3
3
5
6
8
20
23
34
North Carolina
N
0
0
N
N
N
0
0
N
N
7
8
21
35
29
South Carolina
7
8
22
64
92
1
0
3
3
3
—
4
14
—
34
Virginia
N
0
0
N
N
—
0
0
—
—
13
4
12
24
19
West Virginia
2
1
48
32
—
1
0
4
6
—
—
0
2
—
—
E.S. Central
12
23
45
139
196
—
2
4
8
18
5
15
31
34
73
Alabama
N
0
0
N
N
N
0
0
N
N
2
4
11
12
29
Kentucky
3
4
12
28
35
—
0
3
—
5
3
2
8
10
11
Mississippi
N
0
0
N
N
—
0
0
—
—
—
3
22
—
9
Tennessee
9
19
42
111
161
—
1
4
8
13
—
5
11
12
24
W.S. Central
27
31
126
171
215
3
3
10
16
12
1
36
50
122
166
Arkansas
—
4
14
20
36
—
0
4
2
2
—
4
10
—
22
Louisiana
—
2
13
26
44
—
0
2
2
2
—
8
25
17
22
Oklahoma
N
0
0
N
N
—
0
0
—
—
1
1
6
5
6
Texas
27
24
112
125
135
3
3
9
12
8
—
23
38
100
116
Mountain
12
26
72
159
305
—
2
8
11
20
1
12
20
24
65
Arizona
11
12
45
112
163
—
1
5
7
9
—
4
10
9
21
Colorado
—
9
23
18
66
—
0
4
1
4
—
2
6
7
13
Idaho
N
0
0
N
N
—
0
0
—
—
—
0
4
2
3
Montana
N
0
0
N
N
N
0
0
N
N
—
0
1
—
3
Nevada
N
0
0
N
N
N
0
0
N
N
—
2
9
—
16
New Mexico
1
4
12
26
42
—
0
2
3
3
1
1
4
3
5
Utah
—
1
8
—
29
—
0
3
—
4
—
0
2
3
4
Wyoming
—
0
3
3
5
—
0
0
—
—
—
0
0
—
—
Pacific
2
2
11
13
23
—
0
2
6
1
11
57
74
189
348
Alaska
2
2
11
13
23
—
0
2
6
1
—
0
2
2
—
California
N
0
0
N
N
N
0
0
N
N
5
44
62
157
284
Hawaii
—
0
1
—
—
—
0
1
—
—
—
0
3
—
—
Oregon
N
0
0
N
N
N
0
0
N
N
1
4
14
9
21
Washington
N
0
0
N
N
N
0
0
N
N
5
5
11
21
43
Territories
American Samoa
N
0
0
N
N
—
0
0
—
—
—
0
0
—
—
C.N.M.I.
—
—
—
—
—
—
—
—
—
—
—
—
—
—
—
Guam
—
0
0
—
—
—
0
0
—
—
—
0
0
—
—
Puerto Rico
—
0
0
—
—
—
0
0
—
—
6
5
15
25
21
U.S. Virgin Islands
—
0
0
—
—
—
0
0
—
—
—
0
0
—
—
C.N.M.I.: Commonwealth of Northern Mariana Islands.
U: Unavailable. —: No reported cases. N: Not reportable. NN: Not Nationally Notifiable. Cum: Cumulative year-to-date counts. Med: Median. Max: Maximum.
† Includes drug resistant and susceptible cases of invasive Streptococcus pneumoniae disease among children <5 years and among all ages. Case definition: Isolation of S. pneumoniae from a normally sterile body site (e.g., blood or cerebrospinal fluid).
TABLE II. (Continued) Provisional cases of selected notifiable diseases, United States, weeks ending February 11, 2012, and February 12, 2011 (6th week)*
Reporting area
Varicella (chickenpox)
West Nile virus disease†
Neuroinvasive
Nonneuroinvasive§
Current week
Previous 52 weeks
Cum 2012
Cum 2011
Current week
Previous 52 weeks
Cum 2012
Cum 2011
Current week
Previous 52 weeks
Cum 2012
Cum 2011
Med
Max
Med
Max
Med
Max
United States
84
261
350
1,177
1,540
—
0
60
—
1
—
0
31
—
—
New England
13
23
50
124
157
—
0
3
—
—
—
0
1
—
—
Connecticut
—
5
16
27
30
—
0
2
—
—
—
0
1
—
—
Maine
7
4
11
31
28
—
0
0
—
—
—
0
0
—
—
Massachusetts
2
9
18
47
57
—
0
2
—
—
—
0
1
—
—
New Hampshire
—
2
10
—
13
—
0
0
—
—
—
0
0
—
—
Rhode Island
—
0
6
1
6
—
0
1
—
—
—
0
0
—
—
Vermont
4
1
9
18
23
—
0
1
—
—
—
0
0
—
—
Mid. Atlantic
11
22
54
227
109
—
0
11
—
—
—
0
6
—
—
New Jersey
—
0
44
142
—
—
0
1
—
—
—
0
2
—
—
New York (Upstate)
N
0
0
N
N
—
0
5
—
—
—
0
4
—
—
New York City
—
0
0
—
—
—
0
4
—
—
—
0
1
—
—
Pennsylvania
11
19
42
85
109
—
0
2
—
—
—
0
1
—
—
E.N. Central
26
63
114
340
449
—
0
13
—
—
—
0
6
—
—
Illinois
1
18
38
89
92
—
0
6
—
—
—
0
5
—
—
Indiana
—
5
20
38
33
—
0
2
—
—
—
0
1
—
—
Michigan
7
18
44
88
152
—
0
7
—
—
—
0
1
—
—
Ohio
18
21
47
125
172
—
0
3
—
—
—
0
3
—
—
Wisconsin
—
0
1
—
—
—
0
1
—
—
—
0
1
—
—
W.N. Central
2
11
32
48
93
—
0
9
—
1
—
0
7
—
—
Iowa
N
0
0
N
N
—
0
2
—
—
—
0
2
—
—
Kansas
—
7
21
28
45
—
0
1
—
—
—
0
0
—
—
Minnesota
—
0
1
—
—
—
0
1
—
—
—
0
1
—
—
Missouri
—
3
14
14
43
—
0
2
—
1
—
0
2
—
—
Nebraska
2
0
2
3
1
—
0
4
—
—
—
0
3
—
—
North Dakota
—
0
7
—
1
—
0
1
—
—
—
0
1
—
—
South Dakota
—
1
6
3
3
—
0
0
—
—
—
0
1
—
—
S. Atlantic
2
36
66
149
200
—
0
10
—
—
—
0
5
—
—
Delaware
—
0
2
—
1
—
0
1
—
—
—
0
0
—
—
District of Columbia
—
0
2
—
3
—
0
3
—
—
—
0
3
—
—
Florida
—
17
38
95
111
—
0
5
—
—
—
0
2
—
—
Georgia
N
0
0
N
N
—
0
2
—
—
—
0
1
—
—
Maryland
N
0
0
N
N
—
0
5
—
—
—
0
3
—
—
North Carolina
N
0
0
N
N
—
0
1
—
—
—
0
0
—
—
South Carolina
—
0
9
—
—
—
0
0
—
—
—
0
0
—
—
Virginia
2
10
27
25
38
—
0
2
—
—
—
0
0
—
—
West Virginia
—
6
32
29
47
—
0
1
—
—
—
0
0
—
—
E.S. Central
4
5
15
27
30
—
0
11
—
—
—
0
5
—
—
Alabama
3
5
14
24
26
—
0
2
—
—
—
0
0
—
—
Kentucky
N
0
0
N
N
—
0
2
—
—
—
0
1
—
—
Mississippi
1
0
2
3
4
—
0
5
—
—
—
0
4
—
—
Tennessee
N
0
0
N
N
—
0
3
—
—
—
0
1
—
—
W.S. Central
22
56
149
190
189
—
0
4
—
—
—
0
3
—
—
Arkansas
—
5
26
7
17
—
0
1
—
—
—
0
0
—
—
Louisiana
—
2
6
7
8
—
0
1
—
—
—
0
2
—
—
Oklahoma
N
0
0
N
N
—
0
1
—
—
—
0
0
—
—
Texas
22
48
144
176
164
—
0
3
—
—
—
0
3
—
—
Mountain
1
21
68
66
284
—
0
11
—
—
—
0
5
—
—
Arizona
—
4
50
13
84
—
0
7
—
—
—
0
4
—
—
Colorado
—
7
32
22
80
—
0
2
—
—
—
0
2
—
—
Idaho
N
0
0
N
N
—
0
1
—
—
—
0
1
—
—
Montana
—
1
15
—
65
—
0
1
—
—
—
0
0
—
—
Nevada
N
0
0
N
N
—
0
4
—
—
—
0
2
—
—
New Mexico
1
1
8
13
9
—
0
1
—
—
—
0
0
—
—
Utah
—
3
26
16
44
—
0
1
—
—
—
0
1
—
—
Wyoming
—
0
1
2
2
—
0
1
—
—
—
0
1
—
—
Pacific
3
2
9
6
29
—
0
18
—
—
—
0
7
—
—
Alaska
1
1
4
3
10
—
0
0
—
—
—
0
0
—
—
California
2
0
4
2
10
—
0
18
—
—
—
0
7
—
—
Hawaii
—
0
4
1
9
—
0
0
—
—
—
0
0
—
—
Oregon
N
0
0
N
N
—
0
0
—
—
—
0
0
—
—
Washington
N
0
0
N
N
—
0
0
—
—
—
0
0
—
—
Territories
American Samoa
N
0
0
N
N
—
0
0
—
—
—
0
0
—
—
C.N.M.I.
—
—
—
—
—
—
—
—
—
—
—
—
—
—
—
Guam
—
2
4
—
1
—
0
0
—
—
—
0
0
—
—
Puerto Rico
—
2
10
9
26
—
0
0
—
—
—
0
0
—
—
U.S. Virgin Islands
—
0
0
—
—
—
0
0
—
—
—
0
0
—
—
C.N.M.I.: Commonwealth of Northern Mariana Islands.
U: Unavailable. —: No reported cases. N: Not reportable. NN: Not Nationally Notifiable. Cum: Cumulative year-to-date counts. Med: Median. Max: Maximum.
† Updated weekly from reports to the Division of Vector-Borne Infectious Diseases, National Center for Zoonotic, Vector-Borne, and Enteric Diseases (ArboNET Surveillance). Data for California serogroup, eastern equine, Powassan, St. Louis, and western equine diseases are available in Table I.
§ Not reportable in all states. Data from states where the condition is not reportable are excluded from this table, except starting in 2007 for the domestic arboviral diseases and influenza-associated pediatric mortality, and in 2003 for SARS-CoV. Reporting exceptions are available at http://www.cdc.gov/ncphi/disss/nndss/phs/infdis.htm.
TABLE III. Deaths in 122 U.S. cities,* week ending February 11, 2012 (6th week)
Reporting area
All causes, by age (years)
P&I† Total
Reporting area (Continued)
All causes, by age (years)
P&I† Total
All Ages
=65
45–64
25–44
1–24
<1
All Ages
=65
45–64
25–44
1–24
<1
New England
574
423
102
31
5
12
46
S. Atlantic
1,049
660
281
58
22
28
52
Boston, MA
143
100
28
9
2
3
17
Atlanta, GA
161
88
54
11
2
6
10
Bridgeport, CT
37
23
10
2
1
1
2
Baltimore, MD
133
73
40
11
5
4
7
Cambridge, MA
22
16
5
1
—
—
2
Charlotte, NC
108
77
22
4
3
2
5
Fall River, MA
19
15
3
1
—
—
—
Jacksonville, FL
9
5
1
3
—
—
—
Hartford, CT
49
35
9
3
2
—
1
Miami, FL
108
81
23
3
1
—
6
Lowell, MA
22
13
4
5
—
—
1
Norfolk, VA
41
24
11
3
—
3
4
Lynn, MA
9
7
2
—
—
—
1
Richmond, VA
66
40
19
5
2
—
2
New Bedford, MA
27
24
2
1
—
—
3
Savannah, GA
74
50
16
5
2
1
4
New Haven, CT
38
24
7
3
—
4
2
St. Petersburg, FL
62
43
16
2
1
—
2
Providence, RI
59
51
5
—
—
3
2
Tampa, FL
161
113
35
7
3
3
6
Somerville, MA
4
3
1
—
—
—
—
Washington, D.C.
117
60
42
3
3
9
6
Springfield, MA
44
35
8
1
—
—
2
Wilmington, DE
9
6
2
1
—
—
—
Waterbury, CT
33
27
5
1
—
—
1
E.S. Central
930
589
246
61
20
14
85
Worcester, MA
68
50
13
4
—
1
12
Birmingham, AL
167
101
48
14
1
3
16
Mid. Atlantic
1,854
1,319
396
89
29
21
95
Chattanooga, TN
119
89
22
6
2
—
13
Albany, NY
54
39
10
3
—
2
7
Knoxville, TN
111
71
28
9
3
—
14
Allentown, PA
31
23
7
—
1
—
3
Lexington, KY
65
47
10
4
2
2
2
Buffalo, NY
72
43
22
6
—
1
7
Memphis, TN
182
108
46
16
4
8
23
Camden, NJ
27
16
6
1
1
3
3
Mobile, AL
122
76
37
7
2
—
7
Elizabeth, NJ
27
19
5
2
—
1
—
Montgomery, AL
21
15
4
1
1
—
2
Erie, PA
48
34
9
4
1
—
—
Nashville, TN
143
82
51
4
5
1
8
Jersey City, NJ
18
11
6
—
1
—
—
W.S. Central
1,083
679
251
78
45
30
76
New York City, NY
1,017
739
211
47
13
7
48
Austin, TX
96
65
22
3
2
4
11
Newark, NJ
32
14
15
3
—
—
1
Baton Rouge, LA
59
39
13
6
1
—
—
Paterson, NJ
21
14
5
1
1
—
—
Corpus Christi, TX
72
45
19
4
3
1
4
Philadelphia, PA
138
93
30
9
5
1
5
Dallas, TX
208
124
60
18
4
2
17
Pittsburgh, PA§
45
40
4
—
—
1
2
El Paso, TX
66
47
11
4
1
3
4
Reading, PA
38
31
5
1
1
—
2
Fort Worth, TX
U
U
U
U
U
U
U
Rochester, NY
93
64
23
1
3
2
2
Houston, TX
124
56
11
17
25
15
4
Schenectady, NY
28
21
5
2
—
—
1
Little Rock, AR
74
50
17
6
—
1
8
Scranton, PA
30
20
7
3
—
—
3
New Orleans, LA
U
U
U
U
U
U
U
Syracuse, NY
81
64
9
5
—
3
7
San Antonio, TX
208
132
53
12
7
4
16
Trenton, NJ
22
13
7
1
1
—
—
Shreveport, LA
61
43
14
4
—
—
5
Utica, NY
17
10
6
—
1
—
1
Tulsa, OK
115
78
31
4
2
—
7
Yonkers, NY
15
11
4
—
—
—
3
Mountain
1,227
819
287
73
30
18
68
E.N. Central
2,024
1,378
484
106
24
32
129
Albuquerque, NM
130
81
35
6
7
1
11
Akron, OH
59
41
14
1
2
1
5
Boise, ID
64
46
17
1
—
—
4
Canton, OH
42
32
8
2
—
—
2
Colorado Springs, CO
66
49
10
4
3
—
1
Chicago, IL
237
153
63
15
1
5
19
Denver, CO
95
66
21
4
1
3
5
Cincinnati, OH
100
60
26
8
2
4
8
Las Vegas, NV
324
221
79
17
5
2
21
Cleveland, OH
273
203
57
6
2
5
16
Ogden, UT
27
20
5
—
—
2
1
Columbus, OH
209
139
56
11
—
3
14
Phoenix, AZ
206
113
60
21
7
5
10
Dayton, OH
120
92
24
3
1
—
13
Pueblo, CO
34
22
8
3
1
—
1
Detroit, MI
137
72
49
10
3
3
4
Salt Lake City, UT
126
91
23
8
3
1
10
Evansville, IN
60
41
15
3
1
—
8
Tucson, AZ
155
110
29
9
3
4
4
Fort Wayne, IN
84
57
23
2
2
—
2
Pacific
1,865
1,302
415
80
40
28
167
Gary, IN
8
6
1
1
—
—
—
Berkeley, CA
15
9
5
1
—
—
2
Grand Rapids, MI
42
37
5
—
—
—
1
Fresno, CA
120
81
28
7
4
—
7
Indianapolis, IN
213
133
54
21
3
2
12
Glendale, CA
32
27
4
1
—
—
6
Lansing, MI
46
30
11
2
1
2
2
Honolulu, HI
88
66
17
3
—
2
12
Milwaukee, WI
94
61
24
7
1
1
5
Long Beach, CA
64
45
15
1
—
3
9
Peoria, IL
61
42
14
4
—
1
7
Los Angeles, CA
284
187
65
14
11
7
32
Rockford, IL
52
36
12
2
1
1
2
Pasadena, CA
21
17
3
1
—
—
2
South Bend, IN
45
34
6
2
3
—
4
Portland, OR
175
121
35
12
5
2
7
Toledo, OH
83
59
14
6
1
3
3
Sacramento, CA
222
148
61
7
3
3
18
Youngstown, OH
59
50
8
—
—
1
2
San Diego, CA
196
135
49
7
5
—
20
W.N. Central
601
404
142
36
10
9
36
San Francisco, CA
120
83
25
6
2
4
11
Des Moines, IA
119
76
29
11
1
2
7
San Jose, CA
241
182
48
4
4
3
25
Duluth, MN
31
18
6
1
2
4
2
Santa Cruz, CA
29
17
7
3
—
2
4
Kansas City, KS
17
11
6
—
—
—
2
Seattle, WA
101
63
24
8
4
2
2
Kansas City, MO
81
54
23
3
1
—
5
Spokane, WA
46
33
11
2
—
—
3
Lincoln, NE
51
44
7
—
—
—
2
Tacoma, WA
111
88
18
3
2
—
7
Minneapolis, MN
61
35
20
5
1
—
7
Total¶
11,207
7,573
2,604
612
225
192
754
Omaha, NE
83
65
14
2
1
1
7
St. Louis, MO
32
19
6
5
2
—
1
St. Paul, MN
44
26
13
3
1
1
1
Wichita, KS
82
56
18
6
1
1
2
U: Unavailable. —: No reported cases.
* Mortality data in this table are voluntarily reported from 122 cities in the United States, most of which have populations of >100,000. A death is reported by the place of its occurrence and by the week that the death certificate was filed. Fetal deaths are not included.
† Pneumonia and influenza.
§ Because of changes in reporting methods in this Pennsylvania city, these numbers are partial counts for the current week. Complete counts will be available in 4 to 6 weeks.