Persons using assistive technology might not be able to fully access information in this file. For assistance, please send e-mail to: mmwrq@cdc.gov. Type 508 Accommodation and the title of the report in the subject line of e-mail.
Notifiable Diseases and Mortality Tables
Table I Summary of provisional cases of selected notifiable diseases, United States, cumulative, week ending February 18. 2012 (7th Week)
Figure I Selected notifiable disease reports, United States, comparison of provisional 4-week totals ending February 18. 2012, with historical data
Table II Provisional cases of selected notifiable diseases, United States, weeks ending February 18. 2012 and February 19. 2011 (7th Week)
Table III Deaths in 122 U.S. cities, week ending February 18. 2012 (7th Week)
TABLE I. Provisional cases of infrequently reported notifiable diseases (<1,000 cases reported during the preceding year) — United States, week ending February 18, 2012 (7th week)*
TABLE I. (Continued) Provisional cases of infrequently reported notifiable diseases (<1,000 cases reported during the preceding year) — United States, week ending February 18, 2012 (7th week)*
—: No reported cases. N: Not reportable. NN: Not Nationally Notifiable. Cum: Cumulative year-to-date counts.
§ Not reportable in all states. Data from states where the condition is not reportable are excluded from this table except starting in 2007 for the arboviral diseases, STD data, TB data, and influenza-associated pediatric mortality, and in 2003 for SARS-CoV. Reporting exceptions are available at http://www.cdc.gov/osels/ph_surveillance/nndss/phs/infdis.htm.
¶ Includes both neuroinvasive and nonneuroinvasive. Updated weekly from reports to the Division of Vector-Borne Infectious Diseases, National Center for Zoonotic, Vector-Borne, and Enteric Diseases (ArboNET Surveillance). Data for West Nile virus are available in Table II.
** Data for H. influenzae (all ages, all serotypes) are available in Table II.
†† Updated weekly from reports to the Influenza Division, National Center for Immunization and Respiratory Diseases. Since October 2, 2011, three influenza-associated pediatric deaths occurring during the 2011-12 influenza season have been reported.
§§ No measles cases were reported for the current week.
¶¶ Data for meningococcal disease (all serogroups) are available in Table II.
*** CDC discontinued reporting of individual confirmed and probable cases of 2009 pandemic influenza A (H1N1) virus infections on July 24, 2009. During 2009, four cases of human infection with novel influenza A viruses, different from the 2009 pandemic influenza A (H1N1) strain, were reported to CDC. The four cases of novel influenza A virus infection reported to CDC during 2010, and the eight cases reported during 2011, were identified as swine influenza A (H3N2) virus and are unrelated to the 2009 pandemic influenza A (H1N1) virus. Total case counts are provided by the Influenza Division, National Center for Immunization and Respiratory Diseases (NCIRD).
††† No rubella cases were reported for the current week.
§§§ Updated weekly from reports to the Division of STD Prevention, National Center for HIV/AIDS, Viral Hepatitis, STD, and TB Prevention.
¶¶¶ There were no cases of viral hemorrhagic fever reported during the current week. See Table II for dengue hemorrhagic fever.
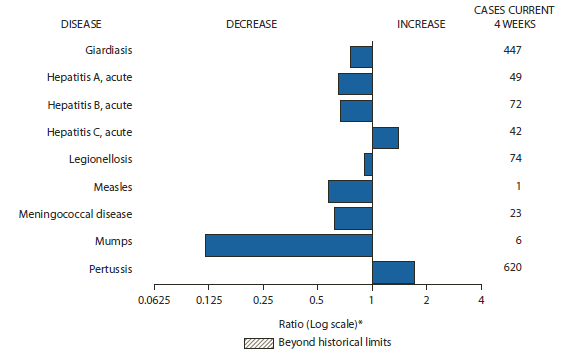
FIGURE I. Selected notifiable disease reports, United States, comparison of provisional 4-week totals February 18, 2012, with historical data
* Ratio of current 4-week total to mean of 15 4-week totals (from previous, comparable, and subsequent 4-week periods for the past 5 years). The point where the hatched area begins is based on the mean and two standard deviations of these 4-week totals.
Alternate Text: The figure above shows selected notifiable disease reports for the United States with comparison of provisional 4-week totals through Feb. 18, 2012. Reports of acute hepatitis C, and pertussis increased. Reports of giardiasis, acute hepatitis A, acute hepatitis B, legionellosis, measles, meningococcal disease, and mumps all decreased.
TABLE II. Provisional cases of selected notifiable diseases, United States, weeks ending February 18, 2012, and February 19, 2011 (7th week)*
Reporting area
Chlamydia trachomatis infection
Coccidioidomycosis
Cryptosporidiosis
Current week
Previous 52 weeks
Cum 2012
Cum 2011
Current week
Previous 52 weeks
Cum 2012
Cum 2011
Current week
Previous 52 weeks
Cum 2012
Cum 2011
Med
Max
Med
Max
Med
Max
United States
11,262
26,810
30,738
129,430
180,676
102
400
587
1,849
3,052
48
132
398
517
656
New England
605
892
1,593
4,005
4,719
—
0
1
—
—
—
6
22
30
35
Connecticut
—
240
869
—
206
N
0
0
N
N
—
1
9
5
9
Maine
66
59
100
447
410
N
0
0
N
N
—
1
4
2
4
Massachusetts
397
433
860
2,509
2,870
N
0
0
N
N
—
3
8
15
15
New Hampshire
2
58
90
167
417
—
0
1
—
—
—
1
5
3
3
Rhode Island
121
80
187
769
598
—
0
0
—
—
—
0
1
—
1
Vermont
19
27
84
113
218
N
0
0
N
N
—
1
5
5
3
Mid. Atlantic
1,717
3,176
3,954
18,672
21,714
—
0
0
—
—
2
15
43
59
78
New Jersey
150
540
1,004
2,835
3,121
N
0
0
N
N
—
0
1
1
—
New York (Upstate)
505
718
1,834
3,905
4,137
N
0
0
N
N
1
4
16
15
18
New York City
267
1,031
1,315
4,718
7,661
N
0
0
N
N
—
1
6
11
8
Pennsylvania
795
1,031
1,599
7,214
6,795
N
0
0
N
N
1
8
27
32
52
E.N. Central
953
4,130
4,621
19,147
30,601
1
1
5
6
5
5
32
148
117
145
Illinois
27
1,164
1,409
3,618
8,346
N
0
0
N
N
—
3
26
3
16
Indiana
135
552
728
2,731
4,215
N
0
0
N
N
—
3
14
—
21
Michigan
427
919
1,185
5,411
7,471
1
0
3
3
1
2
6
14
26
32
Ohio
244
1,022
1,185
4,901
7,307
—
0
2
3
4
3
11
95
62
49
Wisconsin
120
464
551
2,486
3,262
N
0
0
N
N
—
8
65
26
27
W.N. Central
17
1,501
1,818
2,303
10,164
—
0
2
—
—
9
16
85
44
77
Iowa
—
212
431
1,261
1,486
N
0
0
N
N
—
6
19
12
27
Kansas
—
208
281
112
1,341
N
0
0
N
N
—
0
11
3
—
Minnesota
—
316
401
—
2,333
—
0
0
—
—
—
0
0
—
—
Missouri
—
533
759
—
3,426
—
0
0
—
—
6
5
61
16
22
Nebraska
—
126
215
546
769
—
0
2
—
—
3
2
12
6
22
North Dakota
—
46
76
5
297
N
0
0
N
N
—
0
12
—
—
South Dakota
17
62
89
379
512
N
0
0
N
N
—
2
13
7
6
S. Atlantic
3,767
5,427
7,444
31,277
37,954
—
0
2
—
—
17
21
60
119
139
Delaware
67
86
182
503
516
—
0
0
—
—
—
0
1
1
2
District of Columbia
138
110
217
869
762
—
0
0
—
—
—
0
1
—
1
Florida
895
1,496
1,683
9,460
10,246
N
0
0
N
N
13
8
17
54
58
Georgia
825
1,083
1,563
6,650
5,778
N
0
0
N
N
4
5
12
26
36
Maryland
415
481
790
1,520
3,067
—
0
2
—
—
—
1
7
16
7
North Carolina
673
1,000
1,688
6,553
6,348
N
0
0
N
N
—
0
45
—
9
South Carolina
7
522
1,344
44
5,019
N
0
0
N
N
—
2
6
11
16
Virginia
683
659
1,779
5,002
5,617
N
0
0
N
N
—
2
8
10
10
West Virginia
64
81
146
676
601
N
0
0
N
N
—
0
5
1
—
E.S. Central
1,208
1,913
2,804
12,407
12,287
—
0
0
—
—
3
8
25
34
19
Alabama
—
533
1,566
2,362
3,744
N
0
0
N
N
1
3
7
15
10
Kentucky
320
303
557
1,963
1,304
N
0
0
N
N
1
2
17
4
6
Mississippi
664
424
792
4,211
3,088
N
0
0
N
N
—
1
4
4
2
Tennessee
224
600
797
3,871
4,151
N
0
0
N
N
1
2
6
11
1
W.S. Central
1,559
3,323
4,312
16,014
22,943
—
0
1
—
1
6
9
44
43
38
Arkansas
273
309
440
273
2,451
N
0
0
N
N
—
0
2
2
—
Louisiana
—
362
1,071
1,566
2,727
—
0
1
—
1
—
1
9
8
4
Oklahoma
87
128
675
630
1,514
N
0
0
N
N
2
2
6
8
6
Texas
1,199
2,393
3,108
13,545
16,251
N
0
0
N
N
4
5
40
25
28
Mountain
169
1,728
2,418
8,862
12,494
84
307
459
1,626
2,318
2
10
29
30
72
Arizona
74
559
812
3,341
3,792
83
304
456
1,611
2,284
—
1
4
1
4
Colorado
—
415
847
2,096
3,022
N
0
0
N
N
—
2
11
2
20
Idaho
—
85
274
439
552
N
0
0
N
N
—
1
9
11
8
Montana
71
68
88
520
446
N
0
0
N
N
2
1
6
9
5
Nevada
24
201
549
566
1,893
1
2
5
11
14
—
0
2
2
2
New Mexico
—
209
336
1,082
1,578
—
1
4
—
13
—
2
9
4
20
Utah
—
133
190
710
932
—
0
4
2
5
—
1
5
—
7
Wyoming
—
32
67
108
279
—
0
2
2
2
—
0
3
1
6
Pacific
1,267
4,015
5,438
16,743
27,800
17
94
168
217
728
4
10
20
41
53
Alaska
53
108
152
707
889
N
0
0
N
N
—
0
3
—
3
California
582
3,017
4,509
11,887
21,084
17
94
168
217
728
4
6
16
38
24
Hawaii
—
114
142
—
874
N
0
0
N
N
—
0
1
2
—
Oregon
272
276
412
1,839
1,757
N
0
0
N
N
—
2
8
1
20
Washington
360
436
611
2,310
3,196
N
0
0
N
N
—
1
15
—
6
Territories
American Samoa
—
0
0
—
—
N
0
0
N
N
N
0
0
N
N
C.N.M.I.
—
—
—
—
—
—
—
—
—
—
—
—
—
—
—
Guam
—
16
44
—
71
—
0
0
—
—
—
0
0
—
—
Puerto Rico
197
105
348
833
797
N
0
0
N
N
N
0
0
N
N
U.S. Virgin Islands
—
16
27
—
106
—
0
0
—
—
—
0
0
—
—
C.N.M.I.: Commonwealth of Northern Mariana Islands.
U: Unavailable. —: No reported cases. N: Not reportable. NN: Not Nationally Notifiable. Cum: Cumulative year-to-date counts. Med: Median. Max: Maximum.
TABLE II. (Continued) Provisional cases of selected notifiable diseases, United States, weeks ending February 18, 2012, and February 19, 2011 (7th week)*
Reporting area
Dengue Virus Infection
Dengue Fever†
Dengue Hemorrhagic Fever§
Current week
Previous 52 weeks
Cum 2012
Cum 2011
Current week
Previous 52 weeks
Cum 2012
Cum 2011
Med
Max
Med
Max
United States
—
3
16
—
31
—
0
1
—
—
New England
—
0
1
—
1
—
0
0
—
—
Connecticut
—
0
0
—
—
—
0
0
—
—
Maine
—
0
0
—
—
—
0
0
—
—
Massachusetts
—
0
0
—
—
—
0
0
—
—
New Hampshire
—
0
0
—
—
—
0
0
—
—
Rhode Island
—
0
0
—
—
—
0
0
—
—
Vermont
—
0
1
—
1
—
0
0
—
—
Mid. Atlantic
—
1
6
—
9
—
0
0
—
—
New Jersey
—
0
0
—
—
—
0
0
—
—
New York (Upstate)
—
0
2
—
1
—
0
0
—
—
New York City
—
0
4
—
4
—
0
0
—
—
Pennsylvania
—
0
2
—
4
—
0
0
—
—
E.N. Central
—
0
2
—
5
—
0
1
—
—
Illinois
—
0
1
—
1
—
0
1
—
—
Indiana
—
0
1
—
1
—
0
0
—
—
Michigan
—
0
1
—
1
—
0
0
—
—
Ohio
—
0
1
—
—
—
0
0
—
—
Wisconsin
—
0
1
—
2
—
0
0
—
—
W.N. Central
—
0
2
—
1
—
0
0
—
—
Iowa
—
0
1
—
—
—
0
0
—
—
Kansas
—
0
1
—
—
—
0
0
—
—
Minnesota
—
0
1
—
1
—
0
0
—
—
Missouri
—
0
0
—
—
—
0
0
—
—
Nebraska
—
0
0
—
—
—
0
0
—
—
North Dakota
—
0
1
—
—
—
0
0
—
—
South Dakota
—
0
0
—
—
—
0
0
—
—
S. Atlantic
—
1
8
—
8
—
0
1
—
—
Delaware
—
0
2
—
—
—
0
0
—
—
District of Columbia
—
0
0
—
—
—
0
0
—
—
Florida
—
1
7
—
5
—
0
0
—
—
Georgia
—
0
1
—
1
—
0
0
—
—
Maryland
—
0
2
—
—
—
0
0
—
—
North Carolina
—
0
1
—
1
—
0
0
—
—
South Carolina
—
0
1
—
—
—
0
0
—
—
Virginia
—
0
1
—
1
—
0
1
—
—
West Virginia
—
0
0
—
—
—
0
0
—
—
E.S. Central
—
0
3
—
—
—
0
0
—
—
Alabama
—
0
1
—
—
—
0
0
—
—
Kentucky
—
0
1
—
—
—
0
0
—
—
Mississippi
—
0
0
—
—
—
0
0
—
—
Tennessee
—
0
2
—
—
—
0
0
—
—
W.S. Central
—
0
2
—
—
—
0
0
—
—
Arkansas
—
0
0
—
—
—
0
0
—
—
Louisiana
—
0
1
—
—
—
0
0
—
—
Oklahoma
—
0
0
—
—
—
0
0
—
—
Texas
—
0
1
—
—
—
0
0
—
—
Mountain
—
0
1
—
2
—
0
0
—
—
Arizona
—
0
1
—
1
—
0
0
—
—
Colorado
—
0
0
—
—
—
0
0
—
—
Idaho
—
0
0
—
—
—
0
0
—
—
Montana
—
0
0
—
—
—
0
0
—
—
Nevada
—
0
1
—
—
—
0
0
—
—
New Mexico
—
0
1
—
1
—
0
0
—
—
Utah
—
0
1
—
—
—
0
0
—
—
Wyoming
—
0
0
—
—
—
0
0
—
—
Pacific
—
0
4
—
5
—
0
0
—
—
Alaska
—
0
0
—
—
—
0
0
—
—
California
—
0
2
—
3
—
0
0
—
—
Hawaii
—
0
4
—
—
—
0
0
—
—
Oregon
—
0
0
—
—
—
0
0
—
—
Washington
—
0
1
—
2
—
0
0
—
—
Territories
American Samoa
—
0
0
—
—
—
0
0
—
—
C.N.M.I.
—
—
—
—
—
—
—
—
—
—
Guam
—
0
0
—
—
—
0
0
—
—
Puerto Rico
—
13
83
—
140
—
0
3
—
1
U.S. Virgin Islands
—
0
0
—
—
—
0
0
—
—
C.N.M.I.: Commonwealth of Northern Mariana Islands.
U: Unavailable. —: No reported cases. N: Not reportable. NN: Not Nationally Notifiable. Cum: Cumulative year-to-date counts. Med: Median. Max: Maximum.
† Dengue Fever includes cases that meet criteria for Dengue Fever with hemorrhage, other clinical and unknown case classifications.
§ DHF includes cases that meet criteria for dengue shock syndrome (DSS), a more severe form of DHF.
TABLE II. (Continued) Provisional cases of selected notifiable diseases, United States, weeks ending February 18, 2012, and February 19, 2011 (7th week)*
Reporting area
Ehrlichiosis/Anaplasmosis†
Ehrlichia chaffeensis
Anaplasma phagocytophilum
Undetermined
Current week
Previous 52 weeks
Cum 2012
Cum 2011
Current week
Previous 52 weeks
Cum 2012
Cum 2011
Current week
Previous 52 weeks
Cum 2012
Cum 2011
Med
Max
Med
Max
Med
Max
United States
—
9
90
8
10
1
16
58
10
14
—
2
8
2
2
New England
—
0
1
—
—
—
3
28
1
7
—
0
1
—
—
Connecticut
—
0
0
—
—
—
0
0
—
—
—
0
0
—
—
Maine
—
0
1
—
—
—
0
3
1
1
—
0
0
—
—
Massachusetts
—
0
0
—
—
—
1
18
—
—
—
0
0
—
—
New Hampshire
—
0
1
—
—
—
0
4
—
—
—
0
1
—
—
Rhode Island
—
0
1
—
—
—
0
15
—
6
—
0
1
—
—
Vermont
—
0
0
—
—
—
0
1
—
—
—
0
0
—
—
Mid. Atlantic
—
1
5
—
1
1
6
36
8
3
—
0
2
—
—
New Jersey
—
0
0
—
—
—
0
0
—
—
—
0
0
—
—
New York (Upstate)
—
0
4
—
—
1
3
36
6
2
—
0
2
—
—
New York City
—
0
2
—
1
—
1
5
2
1
—
0
0
—
—
Pennsylvania
—
0
0
—
—
—
0
1
—
—
—
0
0
—
—
E.N. Central
—
0
5
—
1
—
0
2
—
1
—
0
6
—
2
Illinois
—
0
4
—
—
—
0
2
—
—
—
0
1
—
1
Indiana
—
0
0
—
—
—
0
0
—
—
—
0
4
—
1
Michigan
—
0
2
—
—
—
0
0
—
—
—
0
2
—
—
Ohio
—
0
1
—
1
—
0
1
—
—
—
0
1
—
—
Wisconsin
—
0
0
—
—
—
0
1
—
1
—
0
1
—
—
W.N. Central
—
1
16
1
—
—
0
6
—
—
—
0
6
—
—
Iowa
N
0
0
N
N
N
0
0
N
N
N
0
0
N
N
Kansas
—
0
2
—
—
—
0
1
—
—
—
0
1
—
—
Minnesota
—
0
0
—
—
—
0
1
—
—
—
0
0
—
—
Missouri
—
1
16
1
—
—
0
5
—
—
—
0
6
—
—
Nebraska
—
0
1
—
—
—
0
1
—
—
—
0
1
—
—
North Dakota
N
0
0
N
N
N
0
0
N
N
N
0
0
N
N
South Dakota
—
0
1
—
—
—
0
1
—
—
—
0
0
—
—
S. Atlantic
—
3
33
7
8
—
1
8
1
2
—
0
2
2
—
Delaware
—
0
2
—
1
—
0
1
—
—
—
0
0
—
—
District of Columbia
N
0
0
N
N
N
0
0
N
N
N
0
0
N
N
Florida
—
0
3
—
1
—
0
3
—
—
—
0
0
—
—
Georgia
—
0
3
4
1
—
0
2
1
—
—
0
1
1
—
Maryland
—
0
3
—
3
—
0
2
—
—
—
0
1
1
—
North Carolina
—
0
17
1
2
—
0
6
—
2
—
0
0
—
—
South Carolina
—
0
1
—
—
—
0
0
—
—
—
0
1
—
—
Virginia
—
1
13
2
—
—
0
3
—
—
—
0
1
—
—
West Virginia
—
0
1
—
—
—
0
0
—
—
—
0
1
—
—
E.S. Central
—
1
8
—
—
—
0
2
—
1
—
0
3
—
—
Alabama
—
0
2
—
—
—
0
1
—
1
N
0
0
N
N
Kentucky
—
0
3
—
—
—
0
0
—
—
—
0
0
—
—
Mississippi
—
0
1
—
—
—
0
1
—
—
—
0
0
—
—
Tennessee
—
0
5
—
—
—
0
1
—
—
—
0
3
—
—
W.S. Central
—
0
30
—
—
—
0
3
—
—
—
0
0
—
—
Arkansas
—
0
13
—
—
—
0
3
—
—
—
0
0
—
—
Louisiana
—
0
0
—
—
—
0
0
—
—
—
0
0
—
—
Oklahoma
—
0
25
—
—
—
0
1
—
—
—
0
0
—
—
Texas
—
0
1
—
—
—
0
1
—
—
—
0
0
—
—
Mountain
—
0
0
—
—
—
0
0
—
—
—
0
1
—
—
Arizona
—
0
0
—
—
—
0
0
—
—
—
0
1
—
—
Colorado
N
0
0
N
N
N
0
0
N
N
N
0
0
N
N
Idaho
N
0
0
N
N
N
0
0
N
N
N
0
0
N
N
Montana
N
0
0
N
N
N
0
0
N
N
N
0
0
N
N
Nevada
N
0
0
N
N
N
0
0
N
N
N
0
0
N
N
New Mexico
N
0
0
N
N
N
0
0
N
N
N
0
0
N
N
Utah
—
0
0
—
—
—
0
0
—
—
—
0
1
—
—
Wyoming
—
0
0
—
—
—
0
0
—
—
—
0
0
—
—
Pacific
—
0
0
—
—
—
0
1
—
—
—
0
2
—
—
Alaska
N
0
0
N
N
N
0
0
N
N
N
0
0
N
N
California
—
0
0
—
—
—
0
0
—
—
—
0
2
—
—
Hawaii
N
0
0
N
N
N
0
0
N
N
N
0
0
N
N
Oregon
—
0
0
—
—
—
0
1
—
—
—
0
0
—
—
Washington
—
0
0
—
—
—
0
0
—
—
—
0
0
—
—
Territories
American Samoa
N
0
0
N
N
N
0
0
N
N
N
0
0
N
N
C.N.M.I.
—
—
—
—
—
—
—
—
—
—
—
—
—
—
—
Guam
N
0
0
N
N
N
0
0
N
N
N
0
0
N
N
Puerto Rico
N
0
0
N
N
N
0
0
N
N
N
0
0
N
N
U.S. Virgin Islands
—
0
0
—
—
—
0
0
—
—
—
0
0
—
—
C.N.M.I.: Commonwealth of Northern Mariana Islands.
U: Unavailable. —: No reported cases. N: Not reportable. NN: Not Nationally Notifiable. Cum: Cumulative year-to-date counts. Med: Median. Max: Maximum.
† Cumulative total E. ewingii cases reported for year 2011 = 13, and 0 case reports for 2012.
TABLE II. (Continued) Provisional cases of selected notifiable diseases, United States, weeks ending February 18, 2012, and February 19, 2011 (7th week)*
Reporting area
Giardiasis
Gonorrhea
Haemophilus influenzae, invasive† All ages, all serotypes
Current week
Previous 52 weeks
Cum 2012
Cum 2011
Current week
Previous 52 weeks
Cum 2012
Cum 2011
Current week
Previous 52 weeks
Cum 2012
Cum 2011
Med
Max
Med
Max
Med
Max
United States
120
281
451
1,263
1,723
2,627
6,026
6,796
30,985
41,531
35
65
103
410
484
New England
2
27
64
86
166
67
109
178
426
633
—
4
9
33
30
Connecticut
—
4
10
15
35
—
45
101
—
260
—
1
5
10
8
Maine
1
3
10
9
14
5
5
18
52
19
—
0
2
4
5
Massachusetts
—
12
29
47
86
50
47
80
284
296
—
2
7
16
13
New Hampshire
—
2
8
6
9
1
2
8
15
14
—
0
2
2
1
Rhode Island
—
0
10
2
8
11
7
35
71
39
—
0
2
1
2
Vermont
1
3
19
7
14
—
0
6
4
5
—
0
2
—
1
Mid. Atlantic
29
54
90
225
332
393
744
916
4,571
4,961
8
15
28
103
91
New Jersey
—
0
0
—
—
30
151
232
793
859
—
1
6
3
15
New York (Upstate)
13
20
50
74
103
92
116
351
684
633
5
3
14
26
18
New York City
4
16
29
91
130
55
240
315
1,083
1,718
1
4
10
31
17
Pennsylvania
12
15
30
60
99
216
267
492
2,011
1,751
2
5
15
43
41
E.N. Central
19
50
91
224
309
239
1,057
1,275
4,951
8,046
2
11
22
43
89
Illinois
—
11
20
40
69
8
295
396
875
2,081
—
3
11
1
25
Indiana
—
6
13
11
42
33
132
172
660
1,118
—
2
6
2
11
Michigan
10
10
21
60
63
110
234
371
1,444
1,971
—
1
4
10
13
Ohio
7
15
30
81
85
59
313
403
1,416
2,275
2
4
7
25
28
Wisconsin
2
8
21
32
50
29
92
118
556
601
—
1
4
5
12
W.N. Central
3
18
50
97
123
—
313
382
430
1,995
4
2
9
15
12
Iowa
—
4
15
22
29
—
37
108
244
247
—
0
1
—
—
Kansas
—
2
9
10
14
—
42
65
34
253
—
0
2
2
—
Minnesota
—
0
0
—
—
—
44
61
—
282
—
0
0
—
—
Missouri
1
6
17
39
45
—
149
204
—
943
4
1
5
10
7
Nebraska
2
3
11
20
23
—
27
52
124
153
—
0
2
3
5
North Dakota
—
0
12
—
—
—
5
14
—
30
—
0
6
—
—
South Dakota
—
1
8
6
12
—
11
20
28
87
—
0
1
—
—
S. Atlantic
23
53
105
299
322
948
1,499
1,946
8,274
10,151
13
14
31
112
119
Delaware
—
0
3
1
4
11
15
35
108
121
—
0
2
—
1
District of Columbia
—
1
5
2
7
60
38
105
338
300
—
0
1
—
—
Florida
12
23
69
122
171
223
374
472
2,363
2,659
6
4
12
29
38
Georgia
5
12
51
105
52
209
322
456
1,869
1,799
—
2
6
19
30
Maryland
5
6
14
39
37
100
115
176
445
799
3
2
6
19
15
North Carolina
N
0
0
N
N
219
331
548
2,006
2,159
1
1
7
10
9
South Carolina
1
2
8
14
10
2
148
421
13
1,370
1
1
5
16
7
Virginia
—
5
12
16
41
115
123
353
1,040
826
1
2
8
12
19
West Virginia
—
0
8
—
—
9
14
29
92
118
1
0
5
7
—
E.S. Central
—
3
9
19
12
296
522
789
3,338
3,309
4
4
12
31
27
Alabama
—
3
9
19
12
—
167
408
673
1,138
—
1
3
5
9
Kentucky
N
0
0
N
N
69
79
151
491
337
2
1
4
8
6
Mississippi
N
0
0
N
N
174
116
242
1,167
838
—
0
3
5
2
Tennessee
N
0
0
N
N
53
148
224
1,007
996
2
2
8
13
10
W.S. Central
—
5
15
30
31
407
871
1,173
4,182
6,173
1
2
10
21
33
Arkansas
—
3
8
12
11
72
86
138
72
706
—
0
3
2
6
Louisiana
—
2
10
18
20
—
113
255
453
811
—
0
4
7
16
Oklahoma
—
0
0
—
—
21
32
196
157
507
1
1
9
12
11
Texas
N
0
0
N
N
314
589
828
3,500
4,149
—
0
1
—
—
Mountain
8
22
41
59
139
34
208
325
1,133
1,557
1
5
10
29
54
Arizona
1
2
6
9
14
29
89
137
643
514
—
1
6
9
21
Colorado
—
7
23
23
38
—
39
77
229
364
—
1
4
1
16
Idaho
2
3
9
8
22
—
2
15
3
17
1
0
2
4
2
Montana
4
2
5
7
3
2
1
4
12
14
—
0
1
2
2
Nevada
1
1
4
7
15
3
38
136
80
375
—
0
2
3
2
New Mexico
—
1
6
2
11
—
33
73
134
226
—
1
3
7
8
Utah
—
2
9
2
29
—
5
10
28
34
—
0
3
2
3
Wyoming
—
0
2
1
7
—
0
3
4
13
—
0
1
1
—
Pacific
36
47
170
224
289
243
633
758
3,680
4,706
2
4
9
23
29
Alaska
1
2
7
7
9
4
18
31
91
131
—
0
3
1
5
California
20
32
51
161
197
184
522
610
3,164
3,915
1
1
5
8
8
Hawaii
—
0
4
2
4
—
12
24
—
101
—
0
3
3
4
Oregon
9
6
20
33
60
19
26
60
146
175
1
1
6
11
12
Washington
6
6
136
21
19
36
50
79
279
384
—
0
1
—
—
Territories
American Samoa
—
0
0
—
—
—
0
0
—
—
—
0
0
—
—
C.N.M.I.
—
—
—
—
—
—
—
—
—
—
—
—
—
—
—
Guam
—
0
0
—
—
—
0
5
—
1
—
0
0
—
—
Puerto Rico
—
0
4
—
8
12
6
14
31
45
—
0
0
—
—
U.S. Virgin Islands
—
0
0
—
—
—
2
10
—
20
—
0
0
—
—
C.N.M.I.: Commonwealth of Northern Mariana Islands.
U: Unavailable. —: No reported cases. N: Not reportable. NN: Not Nationally Notifiable. Cum: Cumulative year-to-date counts. Med: Median. Max: Maximum.
† Data for H. influenzae (age <5 yrs for serotype b, nonserotype b, and unknown serotype) are available in Table I.
TABLE II. (Continued) Provisional cases of selected notifiable diseases, United States, weeks ending February 18, 2012, and February 19, 2011 (7th week)*
Reporting area
Hepatitis (viral, acute), by type
A
B
C
Current week
Previous 52 weeks
Cum 2012
Cum 2011
Current week
Previous 52 weeks
Cum 2012
Cum 2011
Current week
Previous 52 weeks
Cum 2012
Cum 2011
Med
Max
Med
Max
Med
Max
United States
20
22
41
107
165
19
47
97
236
358
14
19
38
109
103
New England
1
1
5
3
13
1
1
8
1
20
—
1
5
2
9
Connecticut
—
0
3
2
5
—
0
4
—
5
—
0
4
2
8
Maine
1
0
2
1
—
1
0
2
1
1
—
0
3
—
—
Massachusetts
—
0
3
—
4
—
0
6
—
13
—
0
2
—
1
New Hampshire
—
0
0
—
—
—
0
1
—
1
N
0
0
N
N
Rhode Island
—
0
1
—
2
U
0
0
U
U
U
0
0
U
U
Vermont
—
0
2
—
2
—
0
0
—
—
—
0
1
—
—
Mid. Atlantic
5
3
7
21
25
2
4
8
18
30
1
2
5
12
7
New Jersey
—
0
0
—
—
—
0
2
3
—
—
0
1
1
—
New York (Upstate)
3
1
4
8
4
2
1
4
4
8
1
1
4
4
5
New York City
1
1
4
5
12
—
1
5
7
10
—
0
1
—
—
Pennsylvania
1
1
5
8
9
—
1
4
4
12
—
1
3
7
2
E.N. Central
—
3
7
8
34
3
5
37
29
68
3
2
8
12
22
Illinois
—
1
5
2
6
—
1
3
1
17
—
0
2
—
1
Indiana
—
0
1
—
5
—
1
4
3
8
—
0
5
2
14
Michigan
—
1
6
5
10
—
1
6
3
18
3
1
4
10
6
Ohio
—
0
2
1
11
3
1
30
21
20
—
0
1
—
—
Wisconsin
—
0
1
—
2
—
0
3
1
5
—
0
1
—
1
W.N. Central
2
1
7
7
8
1
2
9
10
15
—
0
4
1
—
Iowa
—
0
1
—
1
—
0
1
—
1
—
0
0
—
—
Kansas
—
0
1
—
1
—
0
2
—
3
—
0
1
1
—
Minnesota
—
0
7
—
—
—
0
7
—
—
—
0
2
—
—
Missouri
2
0
1
4
3
1
1
4
9
6
—
0
0
—
—
Nebraska
—
0
1
3
1
—
0
2
1
4
—
0
1
—
—
North Dakota
—
0
0
—
—
—
0
0
—
—
—
0
0
—
—
South Dakota
—
0
0
—
2
—
0
0
—
1
—
0
0
—
—
S. Atlantic
4
4
11
20
33
7
12
57
71
77
6
5
14
38
22
Delaware
—
0
1
1
1
—
0
2
2
—
U
0
0
U
U
District of Columbia
—
0
0
—
—
—
0
0
—
—
—
0
0
—
—
Florida
3
1
8
9
9
4
4
7
23
28
4
1
5
17
6
Georgia
—
1
5
2
9
1
2
7
12
18
—
1
3
1
6
Maryland
1
0
4
2
4
—
1
4
13
8
—
1
3
3
2
North Carolina
—
0
3
3
3
1
1
9
7
11
—
1
7
4
5
South Carolina
—
0
2
—
2
1
1
3
4
5
—
0
1
—
—
Virginia
—
0
3
2
5
—
2
5
10
7
—
0
3
3
3
West Virginia
—
0
2
1
—
—
0
43
—
—
2
0
7
10
—
E.S. Central
1
1
6
4
5
2
10
20
63
65
2
5
10
25
18
Alabama
—
0
2
2
—
—
2
6
10
10
—
0
3
2
—
Kentucky
—
0
2
—
2
—
3
10
22
24
—
2
8
11
11
Mississippi
—
0
1
—
1
—
1
4
2
4
U
0
0
U
U
Tennessee
1
0
5
2
2
2
4
9
29
27
2
1
5
12
7
W.S. Central
2
3
7
18
7
3
6
14
24
32
—
1
5
5
10
Arkansas
—
0
2
1
—
—
1
4
3
4
—
0
0
—
—
Louisiana
—
0
2
—
1
—
0
2
3
10
—
0
1
—
4
Oklahoma
—
0
2
—
—
—
1
9
2
3
—
1
4
—
3
Texas
2
3
7
17
6
3
3
11
16
15
—
0
3
5
3
Mountain
2
1
5
10
11
—
1
4
8
19
—
1
5
2
9
Arizona
1
0
2
3
4
—
0
3
1
2
U
0
0
U
U
Colorado
—
0
2
3
5
—
0
2
—
3
—
0
2
—
2
Idaho
—
0
1
2
—
—
0
0
—
2
—
0
2
—
5
Montana
—
0
1
—
1
—
0
0
—
—
—
0
2
—
—
Nevada
1
0
3
2
—
—
0
3
7
7
—
0
2
2
—
New Mexico
—
0
1
—
1
—
0
2
—
2
—
0
2
—
—
Utah
—
0
1
—
—
—
0
1
—
3
—
0
2
—
2
Wyoming
—
0
1
—
—
—
0
0
—
—
—
0
1
—
—
Pacific
3
3
12
16
29
—
3
8
12
32
2
2
10
12
6
Alaska
—
0
1
—
—
—
0
1
—
1
U
0
0
U
U
California
—
3
7
10
25
—
2
7
7
23
—
1
5
5
2
Hawaii
2
0
2
2
1
—
0
1
1
2
U
0
0
U
U
Oregon
—
0
2
1
1
—
0
4
3
5
—
0
2
4
3
Washington
1
0
4
3
2
—
0
3
1
1
2
0
8
3
1
Territories
American Samoa
—
0
0
—
—
—
0
0
—
—
—
0
0
—
—
C.N.M.I.
—
—
—
—
—
—
—
—
—
—
—
—
—
—
—
Guam
—
0
5
—
1
—
2
8
—
7
—
0
3
—
3
Puerto Rico
—
0
1
—
—
—
0
2
—
—
N
0
0
N
N
U.S. Virgin Islands
—
0
0
—
—
—
0
0
—
—
—
0
0
—
—
C.N.M.I.: Commonwealth of Northern Mariana Islands.
U: Unavailable. —: No reported cases. N: Not reportable. NN: Not Nationally Notifiable. Cum: Cumulative year-to-date counts. Med: Median. Max: Maximum.
TABLE II. (Continued) Provisional cases of selected notifiable diseases, United States, weeks ending February 18, 2012, and February 19, 2011 (7th week)*
Reporting area
Legionellosis
Lyme disease
Malaria
Current week
Previous 52 weeks
Cum 2012
Cum 2011
Current week
Previous 52 weeks
Cum 2012
Cum 2011
Current week
Previous 52 weeks
Cum 2012
Cum 2011
Med
Max
Med
Max
Med
Max
United States
19
68
168
210
250
72
417
1,646
1,294
1,120
1
25
49
102
167
New England
1
4
40
10
23
1
85
503
77
376
—
1
7
6
11
Connecticut
—
1
11
3
4
—
38
236
10
155
—
0
2
—
1
Maine
—
0
3
—
1
—
13
67
25
26
—
0
2
—
—
Massachusetts
—
3
24
4
14
—
17
106
16
121
—
0
6
5
8
New Hampshire
—
0
3
—
1
—
10
90
8
52
—
0
1
—
—
Rhode Island
1
0
9
3
2
—
1
31
1
3
—
0
2
—
—
Vermont
—
0
2
—
1
1
6
70
17
19
—
0
1
1
2
Mid. Atlantic
8
15
77
52
56
55
202
770
1,002
441
—
6
13
14
43
New Jersey
—
0
1
1
—
30
2
142
599
1
—
0
0
—
—
New York (Upstate)
4
6
27
17
18
10
56
211
89
58
—
1
4
2
5
New York City
—
3
14
8
18
—
2
20
—
20
—
4
11
10
30
Pennsylvania
4
5
42
26
20
15
112
539
314
362
—
1
5
2
8
E.N. Central
2
13
51
38
45
—
23
301
13
94
—
3
10
10
19
Illinois
—
2
11
3
7
—
1
21
—
4
—
1
5
2
7
Indiana
—
2
8
7
7
—
1
12
—
—
—
0
2
1
2
Michigan
—
2
15
—
10
—
1
12
7
—
—
0
4
2
2
Ohio
2
7
34
28
21
—
1
6
5
3
—
0
4
4
7
Wisconsin
—
0
1
—
—
—
20
259
1
87
—
0
2
1
1
W.N. Central
1
1
8
5
4
—
1
16
3
2
—
1
5
6
3
Iowa
—
0
2
—
—
—
0
13
1
1
—
0
3
1
—
Kansas
—
0
2
—
—
—
0
2
—
—
—
0
2
2
1
Minnesota
—
0
0
—
—
—
0
0
—
—
—
0
0
—
—
Missouri
1
1
5
5
3
—
0
2
—
1
—
0
2
3
1
Nebraska
—
0
2
—
—
—
0
2
2
—
—
0
1
—
1
North Dakota
—
0
1
—
—
—
0
9
—
—
—
0
0
—
—
South Dakota
—
0
1
—
1
—
0
2
—
—
—
0
1
—
—
S. Atlantic
4
11
30
56
35
14
65
180
179
199
—
8
26
39
61
Delaware
—
0
4
3
—
3
13
48
47
57
—
0
3
1
—
District of Columbia
—
0
3
1
—
—
0
3
1
3
—
0
2
—
3
Florida
1
4
13
27
17
3
3
8
15
4
—
2
6
13
12
Georgia
—
1
4
5
3
—
0
5
5
1
—
1
6
5
10
Maryland
2
2
15
7
5
1
20
115
57
78
—
2
16
12
18
North Carolina
—
1
7
4
5
—
0
12
1
6
—
0
7
1
7
South Carolina
1
0
5
3
—
—
0
6
3
1
—
0
1
2
—
Virginia
—
1
7
6
5
7
17
75
44
46
—
1
8
5
11
West Virginia
—
0
5
—
—
—
0
13
6
3
—
0
1
—
—
E.S. Central
—
2
11
4
9
—
1
5
1
—
—
1
4
—
2
Alabama
—
0
2
1
1
—
0
2
—
—
—
0
3
—
1
Kentucky
—
1
4
—
4
—
0
1
1
—
—
0
2
—
—
Mississippi
—
0
3
—
1
—
0
1
—
—
—
0
1
—
—
Tennessee
—
1
8
3
3
—
0
4
—
—
—
0
3
—
1
W.S. Central
1
2
8
4
9
—
1
4
2
2
—
1
5
6
5
Arkansas
—
0
2
—
—
—
0
0
—
—
—
0
1
—
—
Louisiana
—
0
2
—
5
—
0
1
1
—
—
0
1
—
—
Oklahoma
—
0
3
—
1
—
0
0
—
—
—
0
3
4
1
Texas
1
2
7
4
3
—
1
4
1
2
—
0
5
2
4
Mountain
—
2
9
9
17
—
1
5
5
1
—
1
5
4
9
Arizona
—
1
4
3
5
—
0
4
1
—
—
0
4
—
3
Colorado
—
0
4
—
6
—
0
1
—
—
—
0
3
—
3
Idaho
—
0
1
1
1
—
0
2
2
—
—
0
1
—
—
Montana
—
0
1
—
—
—
0
3
—
—
—
0
1
—
—
Nevada
—
0
2
3
1
—
0
1
—
—
—
0
2
4
2
New Mexico
—
0
2
—
—
—
0
2
—
1
—
0
1
—
1
Utah
—
0
2
1
4
—
0
1
1
—
—
0
1
—
—
Wyoming
—
0
2
1
—
—
0
1
1
—
—
0
0
—
—
Pacific
2
6
17
32
52
2
2
8
12
5
1
3
11
17
14
Alaska
—
0
0
—
—
1
0
3
1
—
—
0
1
1
2
California
2
4
11
27
45
1
1
8
11
3
1
3
7
15
8
Hawaii
—
0
2
—
1
N
0
0
N
N
—
0
1
—
—
Oregon
—
0
3
5
1
—
0
2
—
2
—
0
4
1
3
Washington
—
0
13
—
5
—
0
5
—
—
—
0
2
—
1
Territories
American Samoa
N
0
0
N
N
N
0
0
N
N
—
0
1
—
—
C.N.M.I.
—
—
—
—
—
—
—
—
—
—
—
—
—
—
—
Guam
—
0
0
—
—
—
0
0
—
—
—
0
0
—
—
Puerto Rico
—
0
0
—
—
N
0
0
N
N
—
0
0
—
—
U.S. Virgin Islands
—
0
0
—
—
—
0
0
—
—
—
0
0
—
—
C.N.M.I.: Commonwealth of Northern Mariana Islands.
U: Unavailable. —: No reported cases. N: Not reportable. NN: Not Nationally Notifiable. Cum: Cumulative year-to-date counts. Med: Median. Max: Maximum.
TABLE II. (Continued) Provisional cases of selected notifiable diseases, United States, weeks ending February 18, 2012, and February 19, 2011 (7th week)*
Reporting area
Meningococcal disease, invasive† All serogroups
Mumps
Pertussis
Current week
Previous 52 weeks
Cum 2012
Cum 2011
Current week
Previous 52 weeks
Cum 2012
Cum 2011
Current week
Previous 52 weeks
Cum 2012
Cum 2011
Med
Max
Med
Max
Med
Max
United States
3
12
26
65
128
1
7
20
22
59
179
308
793
1,984
2,441
New England
—
0
3
1
3
—
0
2
—
1
6
17
33
137
65
Connecticut
—
0
1
—
1
—
0
0
—
—
—
1
7
4
12
Maine
—
0
1
—
—
—
0
2
—
—
2
3
19
20
12
Massachusetts
—
0
2
1
2
—
0
1
—
1
—
4
10
24
26
New Hampshire
—
0
1
—
—
—
0
0
—
—
—
2
13
4
8
Rhode Island
—
0
1
—
—
—
0
2
—
—
—
0
10
15
6
Vermont
—
0
3
—
—
—
0
1
—
—
4
1
17
70
1
Mid. Atlantic
1
1
4
10
15
—
0
7
—
5
56
41
175
464
211
New Jersey
—
0
0
—
—
—
0
1
—
5
—
4
10
16
19
New York (Upstate)
—
0
4
1
2
—
0
3
—
—
41
14
138
247
60
New York City
1
0
2
4
7
—
0
6
—
—
—
4
42
41
—
Pennsylvania
—
0
2
5
6
—
0
1
—
—
15
13
30
160
132
E.N. Central
—
2
6
6
17
—
2
12
4
13
20
67
217
540
601
Illinois
—
0
3
—
6
—
1
10
—
5
—
21
123
119
113
Indiana
—
0
2
—
2
—
0
2
1
—
—
4
21
10
59
Michigan
—
0
1
—
3
—
0
2
2
2
8
10
38
71
154
Ohio
—
0
2
5
4
—
0
2
1
5
9
13
22
91
202
Wisconsin
—
0
2
1
2
—
0
1
—
1
3
14
67
249
73
W.N. Central
1
1
3
4
10
—
0
3
2
5
5
22
119
125
141
Iowa
—
0
1
—
1
—
0
2
—
—
—
4
9
16
39
Kansas
1
0
1
1
1
—
0
1
—
1
—
2
6
12
20
Minnesota
—
0
0
—
—
—
0
1
—
—
—
0
110
—
—
Missouri
—
0
2
3
4
—
0
2
2
3
4
8
33
91
62
Nebraska
—
0
2
—
3
—
0
1
—
1
1
1
5
4
15
North Dakota
—
0
1
—
—
—
0
3
—
—
—
0
10
—
3
South Dakota
—
0
1
—
1
—
0
0
—
—
—
0
7
2
2
S. Atlantic
—
2
8
9
17
—
1
4
4
2
12
27
52
170
260
Delaware
—
0
1
—
—
—
0
0
—
—
—
0
5
6
4
District of Columbia
—
0
1
—
—
—
0
1
—
—
—
0
2
1
1
Florida
—
1
5
7
6
—
0
2
2
—
5
6
17
57
38
Georgia
—
0
1
—
2
—
0
2
—
—
—
3
7
10
40
Maryland
—
0
2
2
1
—
0
1
1
—
1
2
10
23
22
North Carolina
—
0
3
—
4
—
0
2
—
—
—
3
13
8
63
South Carolina
—
0
1
—
2
—
0
1
—
—
1
2
9
8
29
Virginia
—
0
2
—
2
—
0
4
—
2
3
6
25
35
63
West Virginia
—
0
3
—
—
—
0
1
1
—
2
0
15
22
—
E.S. Central
—
0
3
—
8
—
0
1
—
3
2
9
18
76
85
Alabama
—
0
2
—
5
—
0
1
—
1
2
2
11
11
22
Kentucky
—
0
2
—
—
—
0
0
—
—
—
3
10
38
38
Mississippi
—
0
1
—
1
—
0
1
—
2
—
0
4
5
4
Tennessee
—
0
2
—
2
—
0
1
—
—
—
2
7
22
21
W.S. Central
—
1
5
3
10
1
1
13
6
24
13
19
107
69
94
Arkansas
—
0
2
—
2
—
0
2
—
—
—
1
5
1
6
Louisiana
—
0
2
1
3
—
0
0
—
—
—
0
3
2
8
Oklahoma
—
0
2
1
1
—
0
2
—
—
—
0
11
—
2
Texas
—
0
2
1
4
1
1
13
6
24
13
17
104
66
78
Mountain
1
1
4
6
10
—
0
2
2
1
4
39
82
201
354
Arizona
—
0
1
1
3
—
0
0
—
—
—
12
56
120
137
Colorado
—
0
1
—
2
—
0
1
1
—
—
7
25
28
79
Idaho
—
0
1
1
2
—
0
2
—
—
4
3
12
16
18
Montana
—
0
2
1
—
—
0
1
1
—
—
1
32
11
34
Nevada
1
0
1
2
—
—
0
0
—
—
—
0
5
10
7
New Mexico
—
0
1
1
—
—
0
1
—
1
—
4
24
11
16
Utah
—
0
2
—
3
—
0
0
—
—
—
6
15
2
61
Wyoming
—
0
0
—
—
—
0
1
—
—
—
0
3
3
2
Pacific
—
2
11
26
38
—
0
11
4
5
61
60
254
202
630
Alaska
—
0
1
—
1
—
0
1
—
—
—
0
3
10
13
California
—
2
7
17
30
—
0
11
3
—
—
35
78
21
559
Hawaii
—
0
1
1
1
—
0
1
—
2
3
2
10
32
6
Oregon
—
0
4
8
4
—
0
1
—
3
1
5
23
17
26
Washington
—
0
3
—
2
—
0
1
1
—
57
12
202
122
26
Territories
American Samoa
—
0
0
—
—
—
0
0
—
—
—
0
0
—
—
C.N.M.I.
—
—
—
—
—
—
—
—
—
—
—
—
—
—
—
Guam
—
0
0
—
—
—
1
3
—
4
—
2
14
—
4
Puerto Rico
—
0
0
—
—
—
0
1
1
—
—
0
1
—
1
U.S. Virgin Islands
—
0
0
—
—
—
0
0
—
—
—
0
0
—
—
C.N.M.I.: Commonwealth of Northern Mariana Islands.
U: Unavailable. —: No reported cases. N: Not reportable. NN: Not Nationally Notifiable. Cum: Cumulative year-to-date counts. Med: Median. Max: Maximum.
† Data for meningococcal disease, invasive caused by serogroups A, C, Y, and W-135; serogroup B; other serogroup; and unknown serogroup are available in Table I.
TABLE II. (Continued) Provisional cases of selected notifiable diseases, United States, weeks ending February 18, 2012, and February 19, 2011 (7th week)*
Reporting area
Rabies, animal
Salmonellosis
Shiga toxin-producing E. coli(STEC)†
Current week
Previous 52 weeks
Cum 2012
Cum 2011
Current week
Previous 52 weeks
Cum 2012
Cum 2011
Current week
Previous 52 weeks
Cum 2012
Cum 2011
Med
Max
Med
Max
Med
Max
United States
33
60
105
255
341
247
870
1,860
2,561
3,315
20
90
206
240
259
New England
2
5
16
44
16
2
36
107
97
163
—
4
13
10
11
Connecticut
—
3
10
19
4
—
8
30
25
45
—
1
4
5
7
Maine
1
1
6
15
4
2
2
7
9
17
—
0
3
—
—
Massachusetts
—
0
0
—
—
—
19
44
46
74
—
1
9
5
2
New Hampshire
—
0
3
3
1
—
3
8
5
16
—
0
3
—
2
Rhode Island
1
0
6
5
2
—
1
62
2
6
—
0
2
—
—
Vermont
—
0
2
2
5
—
1
8
10
5
—
0
3
—
—
Mid. Atlantic
1
16
36
23
89
16
75
173
255
282
—
8
28
32
38
New Jersey
—
0
0
—
—
1
0
6
24
—
—
0
1
1
—
New York (Upstate)
1
7
20
23
30
13
25
67
68
61
—
3
13
6
10
New York City
—
0
3
—
1
1
19
42
74
94
—
2
6
9
9
Pennsylvania
—
8
21
—
58
1
31
114
89
127
—
3
16
16
19
E.N. Central
—
2
17
3
5
11
88
184
186
396
4
16
54
36
59
Illinois
—
0
6
—
3
—
27
80
37
132
—
4
14
5
9
Indiana
—
0
7
—
—
—
8
27
10
39
—
2
10
1
10
Michigan
—
1
6
2
2
3
14
42
51
72
2
3
19
23
14
Ohio
—
1
5
1
—
8
20
46
81
101
2
3
9
7
11
Wisconsin
N
0
0
N
N
—
11
46
7
52
—
3
21
—
15
W.N. Central
—
1
8
13
3
16
39
99
144
150
1
11
40
34
21
Iowa
—
0
0
—
—
—
8
19
16
37
—
2
15
5
5
Kansas
—
1
4
7
1
5
8
27
43
26
—
2
8
4
4
Minnesota
—
0
0
—
—
—
0
0
—
—
—
0
0
—
—
Missouri
—
0
4
2
—
10
15
42
64
63
—
5
32
16
6
Nebraska
—
0
3
—
2
1
4
13
15
14
1
1
8
6
6
North Dakota
—
0
4
4
—
—
0
15
—
—
—
0
4
—
—
South Dakota
—
0
0
—
—
—
3
10
6
10
—
1
4
3
—
S. Atlantic
13
17
48
94
203
134
276
739
1,021
1,015
11
12
31
61
48
Delaware
—
0
0
—
—
—
3
12
8
16
—
0
2
1
1
District of Columbia
—
0
0
—
—
—
1
6
—
5
—
0
1
1
1
Florida
13
0
2
15
120
60
107
203
440
382
4
3
9
27
6
Georgia
—
0
0
—
—
11
45
138
133
201
—
2
8
4
7
Maryland
—
6
13
25
21
7
19
46
78
79
—
1
4
2
9
North Carolina
—
0
0
—
—
52
32
251
210
147
6
2
26
14
16
South Carolina
N
0
0
N
N
1
27
71
74
87
1
0
4
3
—
Virginia
—
11
27
47
62
3
19
54
70
98
—
2
8
9
8
West Virginia
—
0
30
7
—
—
0
18
8
—
—
0
2
—
—
E.S. Central
1
3
11
9
15
16
64
190
202
244
1
4
18
16
13
Alabama
1
2
7
8
9
2
18
70
57
82
—
1
15
4
2
Kentucky
—
0
2
1
1
7
11
30
40
38
—
1
5
5
4
Mississippi
—
0
1
—
—
—
22
66
51
46
—
0
4
4
1
Tennessee
—
1
4
—
5
7
15
51
54
78
1
1
11
3
6
W.S. Central
16
1
21
54
—
9
132
250
169
287
1
10
56
16
18
Arkansas
8
0
10
9
—
1
13
52
27
43
—
1
6
3
1
Louisiana
—
0
0
—
—
—
14
44
48
52
—
0
1
—
—
Oklahoma
3
0
21
7
—
8
14
31
45
26
—
1
10
5
4
Texas
5
0
8
38
—
—
93
158
49
166
1
7
56
8
13
Mountain
—
1
4
14
—
7
45
93
137
273
1
11
27
18
26
Arizona
N
0
0
N
N
3
15
35
63
90
—
2
7
3
2
Colorado
—
0
0
—
—
—
9
23
18
60
—
3
9
2
12
Idaho
—
0
1
—
—
1
2
8
8
27
—
1
8
3
4
Montana
N
0
0
N
N
1
2
10
8
7
1
1
4
1
—
Nevada
—
0
3
—
—
2
3
7
10
22
—
1
7
1
2
New Mexico
—
0
4
14
—
—
5
22
13
35
—
1
3
3
3
Utah
—
0
2
—
—
—
6
15
15
29
—
1
7
2
3
Wyoming
—
0
0
—
—
—
1
9
2
3
—
0
7
3
—
Pacific
—
4
15
1
10
36
92
173
350
505
1
9
28
17
25
Alaska
—
0
2
1
4
—
1
6
7
9
—
0
1
—
—
California
—
3
13
—
3
28
73
141
273
384
—
4
14
6
15
Hawaii
—
0
0
—
—
—
7
14
12
47
—
0
2
—
—
Oregon
—
0
2
—
3
—
5
12
21
44
—
1
11
5
5
Washington
—
0
0
—
—
8
9
40
37
21
1
2
20
6
5
Territories
American Samoa
N
0
0
N
N
—
0
0
—
—
—
0
0
—
—
C.N.M.I.
—
—
—
—
—
—
—
—
—
—
—
—
—
—
—
Guam
—
0
0
—
—
—
0
2
—
3
—
0
0
—
—
Puerto Rico
—
0
6
6
4
—
3
12
4
20
—
0
0
—
—
U.S. Virgin Islands
—
0
0
—
—
—
0
0
—
—
—
0
0
—
—
C.N.M.I.: Commonwealth of Northern Mariana Islands.
U: Unavailable. —: No reported cases. N: Not reportable. NN: Not Nationally Notifiable. Cum: Cumulative year-to-date counts. Med: Median. Max: Maximum.
† Includes E. coli O157:H7; Shiga toxin-positive, serogroup non-O157; and Shiga toxin-positive, not serogrouped.
TABLE II. (Continued) Provisional cases of selected notifiable diseases, United States, weeks ending February 18, 2012, and February 19, 2011 (7th week)*
Reporting area
Shigellosis
Spotted Fever Rickettsiosis (including RMSF)†
Confirmed
Probable
Current week
Previous 52 weeks
Cum 2012
Cum 2011
Current week
Previous 52 weeks
Cum 2012
Cum 2011
Current week
Previous 52 weeks
Cum 2012
Cum 2011
Med
Max
Med
Max
Med
Max
United States
141
246
355
1,137
1,058
—
3
15
11
8
1
29
138
51
35
New England
—
4
21
12
23
—
0
1
—
—
—
0
1
—
—
Connecticut
—
1
4
4
4
—
0
0
—
—
—
0
0
—
—
Maine
—
0
8
—
1
—
0
0
—
—
—
0
1
—
—
Massachusetts
—
3
20
8
17
—
0
0
—
—
—
0
1
—
—
New Hampshire
—
0
1
—
—
—
0
1
—
—
—
0
1
—
—
Rhode Island
—
0
3
—
—
—
0
0
—
—
—
0
1
—
—
Vermont
—
0
1
—
1
—
0
0
—
—
—
0
0
—
—
Mid. Atlantic
5
19
54
173
56
—
0
2
3
—
—
1
7
7
2
New Jersey
—
0
24
49
—
—
0
0
—
—
—
0
0
—
—
New York (Upstate)
1
6
40
47
16
—
0
1
—
—
—
0
2
—
—
New York City
3
8
28
65
29
—
0
0
—
—
—
0
3
2
2
Pennsylvania
1
2
13
12
11
—
0
2
3
—
—
0
3
5
—
E.N. Central
14
14
40
152
97
—
0
2
1
—
—
2
10
3
3
Illinois
—
4
16
10
35
—
0
1
—
—
—
1
4
1
2
Indiana
—
1
6
—
9
—
0
1
1
—
—
1
5
1
—
Michigan
1
3
11
25
20
—
0
1
—
—
—
0
1
—
—
Ohio
13
6
27
117
33
—
0
2
—
—
—
0
2
1
1
Wisconsin
—
0
0
—
—
—
0
0
—
—
—
0
0
—
—
W.N. Central
5
5
18
46
64
—
0
4
—
—
—
4
24
3
5
Iowa
—
0
3
2
4
—
0
0
—
—
—
0
2
—
1
Kansas
2
1
6
26
13
—
0
0
—
—
—
0
0
—
—
Minnesota
—
0
0
—
—
—
0
0
—
—
—
0
0
—
—
Missouri
2
3
14
15
45
—
0
2
—
—
—
4
22
3
4
Nebraska
1
0
2
3
1
—
0
3
—
—
—
0
1
—
—
North Dakota
—
0
0
—
—
—
0
1
—
—
—
0
0
—
—
South Dakota
—
0
2
—
1
—
0
1
—
—
—
0
0
—
—
S. Atlantic
43
75
134
268
358
—
1
9
6
4
—
7
58
22
15
Delaware
—
0
2
—
—
—
0
1
—
—
—
0
4
2
—
District of Columbia
—
0
5
1
5
—
0
1
—
—
—
0
1
—
—
Florida
27
50
98
153
210
—
0
1
—
1
—
0
2
4
—
Georgia
8
13
26
69
68
—
1
8
6
1
—
0
0
—
—
Maryland
3
2
10
20
15
—
0
1
—
1
—
0
3
2
1
North Carolina
4
3
19
14
41
—
0
4
—
1
—
0
49
5
9
South Carolina
—
1
54
2
8
—
0
2
—
—
—
0
2
—
1
Virginia
1
2
7
9
11
—
0
1
—
—
—
3
14
9
4
West Virginia
—
0
2
—
—
—
0
0
—
—
—
0
1
—
—
E.S. Central
26
19
51
185
64
—
0
2
—
—
1
4
25
7
5
Alabama
1
6
21
47
29
—
0
1
—
—
—
1
8
2
3
Kentucky
21
5
22
93
5
—
0
1
—
—
—
0
2
—
—
Mississippi
—
4
24
27
11
—
0
0
—
—
—
0
2
—
1
Tennessee
4
4
11
18
19
—
0
2
—
—
1
4
20
5
1
W.S. Central
31
54
131
184
140
—
0
3
—
—
—
2
52
4
1
Arkansas
—
2
7
10
4
—
0
3
—
—
—
1
52
3
—
Louisiana
—
4
21
12
21
—
0
0
—
—
—
0
2
1
—
Oklahoma
6
4
28
38
9
—
0
1
—
—
—
0
25
—
—
Texas
25
43
101
124
106
—
0
1
—
—
—
0
4
—
1
Mountain
1
13
41
36
100
—
0
3
—
4
—
1
7
4
4
Arizona
1
6
27
25
39
—
0
3
—
4
—
0
6
1
4
Colorado
—
1
8
2
15
—
0
0
—
—
—
0
1
—
—
Idaho
—
0
3
1
4
—
0
0
—
—
—
0
2
2
—
Montana
—
1
15
3
7
—
0
0
—
—
—
0
1
—
—
Nevada
—
0
4
1
6
—
0
0
—
—
—
0
1
—
—
New Mexico
—
2
6
3
23
—
0
0
—
—
—
0
0
—
—
Utah
—
1
4
1
6
—
0
0
—
—
—
0
1
1
—
Wyoming
—
0
1
—
—
—
0
0
—
—
—
0
2
—
—
Pacific
16
19
44
81
156
—
0
2
1
—
—
0
1
1
—
Alaska
—
0
2
2
1
N
0
0
N
N
N
0
0
N
N
California
15
14
41
68
132
—
0
2
1
—
—
0
1
1
—
Hawaii
—
1
3
1
12
N
0
0
N
N
N
0
0
N
N
Oregon
—
1
4
7
7
—
0
0
—
—
—
0
0
—
—
Washington
1
1
9
3
4
—
0
0
—
—
—
0
0
—
—
Territories
American Samoa
—
0
0
—
1
N
0
0
N
N
N
0
0
N
N
C.N.M.I.
—
—
—
—
—
—
—
—
—
—
—
—
—
—
—
Guam
—
0
1
—
—
N
0
0
N
N
N
0
0
N
N
Puerto Rico
—
0
0
—
—
N
0
0
N
N
N
0
0
N
N
U.S. Virgin Islands
—
0
0
—
—
—
0
0
—
—
—
0
0
—
—
C.N.M.I.: Commonwealth of Northern Mariana Islands.
U: Unavailable. —: No reported cases. N: Not reportable. NN: Not Nationally Notifiable. Cum: Cumulative year-to-date counts. Med: Median. Max: Maximum.
† Illnesses with similar clinical presentation that result from Spotted fever group rickettsia infections are reported as Spotted fever rickettsioses. Rocky Mountain spotted fever (RMSF) caused by Rickettsia rickettsii, is the most common and well-known spotted fever.
TABLE II. (Continued) Provisional cases of selected notifiable diseases, United States, weeks ending February 18, 2012, and February 19, 2011 (7th week)*
Reporting area
Streptococcus pneumoniae,† invasive disease
Syphilis, primary and secondary
All ages
Age <5
Current week
Previous 52 weeks
Cum 2012
Cum 2011
Current week
Previous 52 weeks
Cum 2012
Cum 2011
Current week
Previous 52 weeks
Cum 2012
Cum 2011
Med
Max
Med
Max
Med
Max
United States
196
252
464
1,903
2,566
15
20
41
134
149
82
263
312
1,069
1,739
New England
4
13
31
77
158
—
1
4
6
5
4
7
23
31
48
Connecticut
—
6
20
40
72
—
0
3
2
1
—
0
12
—
5
Maine
2
2
8
16
25
—
0
1
1
1
—
0
2
—
2
Massachusetts
—
0
3
5
6
—
0
2
2
2
2
5
10
24
29
New Hampshire
—
1
8
8
23
—
0
1
1
—
—
0
3
2
3
Rhode Island
—
1
6
—
28
—
0
1
—
1
2
0
7
5
8
Vermont
2
1
6
8
4
—
0
2
—
—
—
0
2
—
1
Mid. Atlantic
22
16
55
287
165
1
2
10
15
8
5
29
53
117
224
New Jersey
—
0
16
55
—
—
0
2
4
—
—
3
13
4
28
New York (Upstate)
15
2
33
146
15
1
1
10
8
8
2
4
9
14
18
New York City
7
12
24
86
150
—
0
9
3
—
—
14
24
44
128
Pennsylvania
N
0
0
N
N
N
0
0
N
N
3
7
17
55
50
E.N. Central
37
63
122
402
536
2
3
10
19
26
2
30
48
74
218
Illinois
N
0
0
N
N
—
0
0
—
—
—
11
24
25
83
Indiana
—
12
36
42
128
—
1
4
1
3
1
3
8
17
25
Michigan
7
13
26
96
104
1
0
2
6
7
1
4
12
8
35
Ohio
24
27
43
201
225
—
1
7
7
12
—
7
17
22
64
Wisconsin
6
8
23
63
79
1
0
2
5
4
—
1
6
2
11
W.N. Central
4
3
28
29
27
—
0
2
1
1
—
6
13
3
55
Iowa
N
0
0
N
N
N
0
0
N
N
—
0
3
2
1
Kansas
N
0
0
N
N
N
0
0
N
N
—
0
4
—
1
Minnesota
—
0
0
—
—
—
0
0
—
—
—
2
8
—
27
Missouri
N
0
0
N
N
—
0
0
—
—
—
2
8
—
24
Nebraska
4
2
9
29
27
—
0
2
1
1
—
0
2
1
2
North Dakota
—
0
25
—
—
—
0
1
—
—
—
0
1
—
—
South Dakota
N
0
0
N
N
—
0
0
—
—
—
0
0
—
—
S. Atlantic
70
65
143
533
788
7
6
15
45
49
40
66
92
314
412
Delaware
—
1
5
6
16
—
0
0
—
—
—
0
4
7
3
District of Columbia
—
1
5
1
12
—
0
1
1
1
3
3
8
29
27
Florida
32
21
55
200
329
1
2
8
15
23
2
24
36
112
167
Georgia
24
19
38
157
218
6
1
5
16
17
8
12
40
56
39
Maryland
5
9
29
53
111
—
1
3
3
5
2
8
20
26
46
North Carolina
N
0
0
N
N
N
0
0
N
N
21
8
21
55
57
South Carolina
8
8
22
78
102
—
0
3
4
3
—
4
11
1
44
Virginia
N
0
0
N
N
—
0
0
—
—
4
4
13
28
29
West Virginia
1
1
48
38
—
—
0
4
6
—
—
0
2
—
—
E.S. Central
19
23
45
170
231
1
2
4
9
19
1
15
31
56
92
Alabama
N
0
0
N
N
N
0
0
N
N
—
4
10
12
33
Kentucky
3
4
12
34
40
—
0
3
—
5
—
2
8
10
16
Mississippi
N
0
0
N
N
—
0
0
—
—
1
3
22
19
13
Tennessee
16
19
42
136
191
1
1
4
9
14
—
5
11
15
30
W.S. Central
23
31
137
208
277
3
3
10
19
16
20
36
51
201
206
Arkansas
7
4
14
32
44
—
0
3
2
3
5
3
10
5
27
Louisiana
—
2
13
26
53
—
0
2
2
3
—
7
25
17
28
Oklahoma
N
0
0
N
N
—
0
0
—
—
1
1
6
6
7
Texas
16
24
123
150
180
3
3
10
15
10
14
23
39
173
144
Mountain
15
26
72
180
350
1
2
8
13
23
—
12
20
26
79
Arizona
15
12
45
132
176
1
1
5
9
9
—
5
11
9
25
Colorado
—
8
23
18
78
—
0
4
1
4
—
2
6
7
16
Idaho
N
0
0
N
N
—
0
0
—
—
—
0
4
2
3
Montana
N
0
0
N
N
N
0
0
N
N
—
0
1
—
3
Nevada
N
0
0
N
N
N
0
0
N
N
—
2
9
2
21
New Mexico
—
4
12
26
54
—
0
2
3
3
—
1
4
3
7
Utah
—
1
8
—
37
—
0
3
—
7
—
0
2
3
4
Wyoming
—
0
3
4
5
—
0
0
—
—
—
0
0
—
—
Pacific
2
2
11
17
34
—
0
2
7
2
10
56
74
247
405
Alaska
2
2
11
17
34
—
0
2
7
2
—
0
2
2
—
California
N
0
0
N
N
N
0
0
N
N
9
45
62
203
327
Hawaii
—
0
1
—
—
—
0
1
—
—
—
0
3
—
—
Oregon
N
0
0
N
N
N
0
0
N
N
—
4
14
20
25
Washington
N
0
0
N
N
N
0
0
N
N
1
5
11
22
53
Territories
American Samoa
N
0
0
N
N
—
0
0
—
—
—
0
0
—
—
C.N.M.I.
—
—
—
—
—
—
—
—
—
—
—
—
—
—
—
Guam
—
0
0
—
—
—
0
0
—
—
—
0
0
—
—
Puerto Rico
—
0
0
—
—
—
0
0
—
—
3
5
15
28
24
U.S. Virgin Islands
—
0
0
—
—
—
0
0
—
—
—
0
0
—
—
C.N.M.I.: Commonwealth of Northern Mariana Islands.
U: Unavailable. —: No reported cases. N: Not reportable. NN: Not Nationally Notifiable. Cum: Cumulative year-to-date counts. Med: Median. Max: Maximum.
† Includes drug resistant and susceptible cases of invasive Streptococcus pneumoniae disease among children <5 years and among all ages. Case definition: Isolation of S. pneumoniae from a normally sterile body site (e.g., blood or cerebrospinal fluid).
TABLE II. (Continued) Provisional cases of selected notifiable diseases, United States, weeks ending February 18, 2012, and February 19, 2011 (7th week)*
Reporting area
Varicella (chickenpox)
West Nile virus disease†
Neuroinvasive
Nonneuroinvasive§
Current week
Previous 52 weeks
Cum 2012
Cum 2011
Current week
Previous 52 weeks
Cum 2012
Cum 2011
Current week
Previous 52 weeks
Cum 2012
Cum 2011
Med
Max
Med
Max
Med
Max
United States
164
262
353
1,414
1,806
—
0
60
—
1
—
0
31
—
—
New England
5
23
54
134
177
—
0
3
—
—
—
0
1
—
—
Connecticut
1
6
20
30
35
—
0
2
—
—
—
0
1
—
—
Maine
1
4
11
35
33
—
0
0
—
—
—
0
0
—
—
Massachusetts
—
9
18
47
61
—
0
2
—
—
—
0
1
—
—
New Hampshire
—
2
10
—
17
—
0
0
—
—
—
0
0
—
—
Rhode Island
—
0
6
1
8
—
0
1
—
—
—
0
0
—
—
Vermont
3
1
9
21
23
—
0
1
—
—
—
0
0
—
—
Mid. Atlantic
51
22
55
303
125
—
0
11
—
—
—
0
6
—
—
New Jersey
22
0
44
186
—
—
0
1
—
—
—
0
2
—
—
New York (Upstate)
N
0
0
N
N
—
0
5
—
—
—
0
4
—
—
New York City
—
0
0
—
—
—
0
4
—
—
—
0
1
—
—
Pennsylvania
29
19
42
117
125
—
0
2
—
—
—
0
1
—
—
E.N. Central
27
64
114
395
518
—
0
13
—
—
—
0
6
—
—
Illinois
1
18
38
100
106
—
0
6
—
—
—
0
5
—
—
Indiana
—
5
20
38
40
—
0
2
—
—
—
0
1
—
—
Michigan
9
18
44
115
180
—
0
7
—
—
—
0
1
—
—
Ohio
17
21
47
142
191
—
0
3
—
—
—
0
3
—
—
Wisconsin
—
0
1
—
1
—
0
1
—
—
—
0
1
—
—
W.N. Central
—
11
32
53
107
—
0
9
—
1
—
0
7
—
—
Iowa
N
0
0
N
N
—
0
2
—
—
—
0
2
—
—
Kansas
—
7
21
28
55
—
0
1
—
—
—
0
0
—
—
Minnesota
—
0
1
—
—
—
0
1
—
—
—
0
1
—
—
Missouri
—
3
18
19
46
—
0
2
—
1
—
0
2
—
—
Nebraska
—
0
2
3
1
—
0
4
—
—
—
0
3
—
—
North Dakota
—
0
7
—
1
—
0
1
—
—
—
0
1
—
—
South Dakota
—
1
6
3
4
—
0
0
—
—
—
0
1
—
—
S. Atlantic
4
36
66
156
248
—
0
9
—
—
—
0
5
—
—
Delaware
—
0
2
—
2
—
0
1
—
—
—
0
0
—
—
District of Columbia
—
0
2
—
4
—
0
3
—
—
—
0
3
—
—
Florida
—
16
38
95
126
—
0
4
—
—
—
0
2
—
—
Georgia
N
0
0
N
N
—
0
2
—
—
—
0
1
—
—
Maryland
N
0
0
N
N
—
0
5
—
—
—
0
3
—
—
North Carolina
N
0
0
N
N
—
0
1
—
—
—
0
0
—
—
South Carolina
—
0
9
—
—
—
0
0
—
—
—
0
0
—
—
Virginia
4
9
27
32
52
—
0
2
—
—
—
0
0
—
—
West Virginia
—
6
32
29
64
—
0
1
—
—
—
0
0
—
—
E.S. Central
1
5
15
28
40
—
0
11
—
—
—
0
5
—
—
Alabama
1
5
14
25
36
—
0
2
—
—
—
0
0
—
—
Kentucky
N
0
0
N
N
—
0
2
—
—
—
0
1
—
—
Mississippi
—
0
2
3
4
—
0
5
—
—
—
0
4
—
—
Tennessee
N
0
0
N
N
—
0
3
—
—
—
0
1
—
—
W.S. Central
72
56
154
263
245
—
0
4
—
—
—
0
3
—
—
Arkansas
1
5
26
9
27
—
0
1
—
—
—
0
0
—
—
Louisiana
—
2
6
7
12
—
0
1
—
—
—
0
2
—
—
Oklahoma
N
0
0
N
N
—
0
1
—
—
—
0
0
—
—
Texas
71
48
149
247
206
—
0
3
—
—
—
0
3
—
—
Mountain
1
20
68
71
310
—
0
11
—
—
—
0
5
—
—
Arizona
1
4
50
14
95
—
0
7
—
—
—
0
4
—
—
Colorado
—
7
32
22
87
—
0
2
—
—
—
0
2
—
—
Idaho
N
0
0
N
N
—
0
1
—
—
—
0
1
—
—
Montana
—
1
7
3
68
—
0
1
—
—
—
0
0
—
—
Nevada
N
0
0
N
N
—
0
4
—
—
—
0
2
—
—
New Mexico
—
1
8
14
9
—
0
1
—
—
—
0
0
—
—
Utah
—
3
26
16
49
—
0
1
—
—
—
0
1
—
—
Wyoming
—
0
1
2
2
—
0
1
—
—
—
0
1
—
—
Pacific
3
2
9
11
36
—
0
18
—
—
—
0
7
—
—
Alaska
1
1
4
5
14
—
0
0
—
—
—
0
0
—
—
California
—
0
4
3
13
—
0
18
—
—
—
0
7
—
—
Hawaii
2
0
4
3
9
—
0
0
—
—
—
0
0
—
—
Oregon
N
0
0
N
N
—
0
0
—
—
—
0
0
—
—
Washington
N
0
0
N
N
—
0
0
—
—
—
0
0
—
—
Territories
American Samoa
N
0
0
N
N
—
0
0
—
—
—
0
0
—
—
C.N.M.I.
—
—
—
—
—
—
—
—
—
—
—
—
—
—
—
Guam
—
2
4
—
1
—
0
0
—
—
—
0
0
—
—
Puerto Rico
—
2
10
12
33
—
0
0
—
—
—
0
0
—
—
U.S. Virgin Islands
—
0
0
—
—
—
0
0
—
—
—
0
0
—
—
C.N.M.I.: Commonwealth of Northern Mariana Islands.
U: Unavailable. —: No reported cases. N: Not reportable. NN: Not Nationally Notifiable. Cum: Cumulative year-to-date counts. Med: Median. Max: Maximum.
† Updated weekly from reports to the Division of Vector-Borne Infectious Diseases, National Center for Zoonotic, Vector-Borne, and Enteric Diseases (ArboNET Surveillance). Data for California serogroup, eastern equine, Powassan, St. Louis, and western equine diseases are available in Table I.
§ Not reportable in all states. Data from states where the condition is not reportable are excluded from this table, except starting in 2007 for the domestic arboviral diseases and influenza-associated pediatric mortality, and in 2003 for SARS-CoV. Reporting exceptions are available at http://www.cdc.gov/ncphi/disss/nndss/phs/infdis.htm.
TABLE III. Deaths in 122 U.S. cities,* week ending February 18, 2012 (7th week)
Reporting area
All causes, by age (years)
P&I† Total
Reporting area (Continued)
All causes, by age (years)
P&I† Total
All Ages
=65
45–64
25–44
1–24
<1
All Ages
=65
45–64
25–44
1–24
<1
New England
629
430
136
33
13
17
65
S. Atlantic
1,093
706
274
66
23
24
77
Boston, MA
156
98
40
8
4
6
17
Atlanta, GA
146
87
40
11
4
4
17
Bridgeport, CT
44
28
13
3
—
—
2
Baltimore, MD
132
74
46
10
2
—
11
Cambridge, MA
16
11
5
—
—
—
1
Charlotte, NC
143
96
35
7
3
2
7
Fall River, MA
33
25
8
—
—
—
4
Jacksonville, FL
7
5
2
—
—
—
4
Hartford, CT
70
49
16
2
3
—
9
Miami, FL
105
74
18
7
3
3
2
Lowell, MA
24
18
5
1
—
—
1
Norfolk, VA
59
37
12
6
3
1
3
Lynn, MA
9
4
4
1
—
—
—
Richmond, VA
67
44
14
7
2
—
1
New Bedford, MA
23
17
3
1
1
1
1
Savannah, GA
57
36
15
2
1
3
5
New Haven, CT
49
31
10
4
2
2
7
St. Petersburg, FL
61
45
11
1
1
3
6
Providence, RI
73
49
17
3
2
2
2
Tampa, FL
188
132
42
9
3
2
13
Somerville, MA
1
1
—
—
—
—
—
Washington, D.C.
116
66
38
6
1
5
8
Springfield, MA
43
33
2
4
—
4
8
Wilmington, DE
12
10
1
—
—
1
—
Waterbury, CT
27
23
3
—
1
—
2
E.S. Central
891
582
233
42
18
16
71
Worcester, MA
61
43
10
6
—
2
11
Birmingham, AL
216
130
67
12
4
3
16
Mid. Atlantic
1,943
1,351
437
95
38
22
105
Chattanooga, TN
105
78
21
3
2
1
6
Albany, NY
60
43
9
2
5
1
2
Knoxville, TN
107
72
26
7
2
—
10
Allentown, PA
35
29
5
—
—
1
2
Lexington, KY
63
39
15
3
3
3
4
Buffalo, NY
85
58
20
3
4
—
6
Memphis, TN
174
109
51
7
2
5
17
Camden, NJ
16
8
7
1
—
—
—
Mobile, AL
36
28
7
—
—
1
3
Elizabeth, NJ
15
10
3
1
1
—
—
Montgomery, AL
28
21
3
3
1
—
2
Erie, PA
57
40
14
1
2
—
4
Nashville, TN
162
105
43
7
4
3
13
Jersey City, NJ
15
13
1
—
1
—
2
W.S. Central
1,191
798
256
84
28
25
87
New York City, NY
1,089
755
249
54
18
13
63
Austin, TX
112
74
32
3
2
1
10
Newark, NJ
37
17
16
2
2
—
—
Baton Rouge, LA
61
41
9
8
3
—
—
Paterson, NJ
15
10
3
2
—
—
1
Corpus Christi, TX
61
50
8
3
—
—
7
Philadelphia, PA
172
110
37
19
2
4
10
Dallas, TX
213
128
59
14
7
5
15
Pittsburgh, PA§
47
36
9
2
—
—
2
El Paso, TX
106
76
19
6
2
3
3
Reading, PA
47
39
5
2
1
—
1
Fort Worth, TX
U
U
U
U
U
U
U
Rochester, NY
82
53
24
2
1
2
2
Houston, TX
109
71
6
20
7
5
7
Schenectady, NY
31
23
7
—
—
1
1
Little Rock, AR
82
50
25
3
1
3
4
Scranton, PA
25
18
7
—
—
—
2
New Orleans, LA
U
U
U
U
U
U
U
Syracuse, NY
57
43
13
1
—
—
5
San Antonio, TX
253
179
57
12
3
2
26
Trenton, NJ
32
23
5
3
1
—
—
Shreveport, LA
31
16
7
1
2
5
2
Utica, NY
6
6
—
—
—
—
1
Tulsa, OK
163
113
34
14
1
1
13
Yonkers, NY
20
17
3
—
—
—
1
Mountain
1,289
893
291
66
25
14
83
E.N. Central
2,254
1,491
552
118
39
54
149
Albuquerque, NM
133
94
26
11
1
1
16
Akron, OH
54
35
16
1
—
2
2
Boise, ID
71
54
11
4
—
2
7
Canton, OH
20
13
7
—
—
—
4
Colorado Springs, CO
73
50
15
5
1
2
1
Chicago, IL
259
158
76
15
7
3
16
Denver, CO
97
68
22
4
1
2
2
Cincinnati, OH
92
44
27
8
3
10
3
Las Vegas, NV
306
208
70
20
6
2
19
Cleveland, OH
307
210
77
8
3
9
14
Ogden, UT
43
28
11
2
1
1
3
Columbus, OH
386
260
91
18
8
9
32
Phoenix, AZ
191
125
51
8
4
3
9
Dayton, OH
158
113
30
12
2
1
14
Pueblo, CO
35
23
8
2
2
—
3
Detroit, MI
160
85
50
15
5
5
3
Salt Lake City, UT
138
97
29
4
7
1
8
Evansville, IN
47
34
12
—
—
1
5
Tucson, AZ
202
146
48
6
2
—
15
Fort Wayne, IN
65
48
11
4
2
—
4
Pacific
1,830
1,287
389
94
36
24
181
Gary, IN
8
4
4
—
—
—
1
Berkeley, CA
12
9
2
—
—
1
1
Grand Rapids, MI
59
42
10
4
—
3
6
Fresno, CA
170
111
42
13
2
2
15
Indianapolis, IN
189
116
51
14
4
4
18
Glendale, CA
30
21
9
—
—
—
4
Lansing, MI
43
32
8
2
1
—
5
Honolulu, HI
72
53
13
5
—
1
13
Milwaukee, WI
78
55
19
3
—
1
3
Long Beach, CA
59
40
15
1
2
1
8
Peoria, IL
54
45
6
1
—
2
7
Los Angeles, CA
275
186
63
14
8
4
37
Rockford, IL
69
51
11
5
1
1
5
Pasadena, CA
20
18
2
—
—
—
2
South Bend, IN
40
29
9
2
—
—
3
Portland, OR
124
90
22
7
3
2
6
Toledo, OH
102
73
21
5
1
2
2
Sacramento, CA
216
151
46
15
4
—
30
Youngstown, OH
64
44
16
1
2
1
2
San Diego, CA
164
112
42
7
3
—
8
W.N. Central
679
455
144
47
13
20
39
San Francisco, CA
123
81
28
10
2
2
19
Des Moines, IA
64
53
10
—
—
1
4
San Jose, CA
218
171
38
4
1
4
14
Duluth, MN
31
23
6
2
—
—
2
Santa Cruz, CA
38
28
9
—
1
—
5
Kansas City, KS
27
17
7
3
—
—
1
Seattle, WA
110
75
21
6
2
6
6
Kansas City, MO
113
76
15
13
9
—
2
Spokane, WA
82
54
18
5
4
1
6
Lincoln, NE
51
39
9
2
1
—
3
Tacoma, WA
117
87
19
7
4
—
7
Minneapolis, MN
64
42
17
3
—
2
7
Total¶
11,799
7,993
2,712
645
233
216
857
Omaha, NE
87
50
25
7
—
5
9
St. Louis, MO
97
56
25
7
2
7
3
St. Paul, MN
55
36
14
4
—
1
3
Wichita, KS
90
63
16
6
1
4
5
U: Unavailable. —: No reported cases.
* Mortality data in this table are voluntarily reported from 122 cities in the United States, most of which have populations of >100,000. A death is reported by the place of its occurrence and by the week that the death certificate was filed. Fetal deaths are not included.
† Pneumonia and influenza.
§ Because of changes in reporting methods in this Pennsylvania city, these numbers are partial counts for the current week. Complete counts will be available in 4 to 6 weeks.