Persons using assistive technology might not be able to fully access information in this file. For assistance, please send e-mail to: mmwrq@cdc.gov. Type 508 Accommodation and the title of the report in the subject line of e-mail.
Notifiable Diseases and Mortality Tables
Table I Summary of provisional cases of selected notifiable diseases, United States, cumulative, week ending February 15, 2012 (8th Week)
Figure I Selected notifiable disease reports, United States, comparison of provisional 4-week totals ending February 15, 2012, with historical data
Table II Provisional cases of selected notifiable diseases, United States, weeks ending February 15, 2012 and February 16, 2011 (8th Week)
Table III Deaths in 122 U.S. cities, week ending February 15, 2012 (8th Week)
TABLE I. Provisional cases of infrequently reported notifiable diseases (<1,000 cases reported during the preceding year) — United States, week ending February 25, 2012 (8th week)*
TABLE I. (Continued) Provisional cases of infrequently reported notifiable diseases (<1,000 cases reported during the preceding year) — United States, week ending February 25, 2012 (8th week)*
—: No reported cases. N: Not reportable. NN: Not Nationally Notifiable. Cum: Cumulative year-to-date counts.
§ Not reportable in all states. Data from states where the condition is not reportable are excluded from this table except starting in 2007 for the arboviral diseases, STD data, TB data, and influenza-associated pediatric mortality, and in 2003 for SARS-CoV. Reporting exceptions are available at http://www.cdc.gov/osels/ph_surveillance/nndss/phs/infdis.htm.
¶ Includes both neuroinvasive and nonneuroinvasive. Updated weekly from reports to the Division of Vector-Borne Infectious Diseases, National Center for Zoonotic, Vector-Borne, and Enteric Diseases (ArboNET Surveillance). Data for West Nile virus are available in Table II.
** Data for H. influenzae (all ages, all serotypes) are available in Table II.
†† Updated weekly from reports to the Influenza Division, National Center for Immunization and Respiratory Diseases. Since October 2, 2011, four influenza-associated pediatric deaths occurring during the 2011-12 influenza season have been reported.
§§ No measles cases were reported for the current week.
¶¶ Data for meningococcal disease (all serogroups) are available in Table II.
*** CDC discontinued reporting of individual confirmed and probable cases of 2009 pandemic influenza A (H1N1) virus infections on July 24, 2009. During 2009, four cases of human infection with novel influenza A viruses, different from the 2009 pandemic influenza A (H1N1) strain, were reported to CDC. The four cases of novel influenza A virus infection reported to CDC during 2010, and the eight cases reported during 2011, were identified as swine influenza A (H3N2) virus and are unrelated to the 2009 pandemic influenza A (H1N1) virus. Total case counts are provided by the Influenza Division, National Center for Immunization and Respiratory Diseases (NCIRD).
††† No rubella cases were reported for the current week.
§§§ Updated weekly from reports to the Division of STD Prevention, National Center for HIV/AIDS, Viral Hepatitis, STD, and TB Prevention.
¶¶¶ There were no cases of viral hemorrhagic fever reported during the current week. See Table II for dengue hemorrhagic fever.
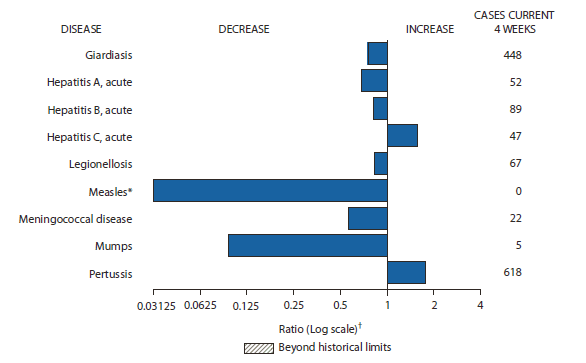
FIGURE I. Selected notifiable disease reports, United States, comparison of provisional 4-week totals February 25, 2012, with historical data
* No measles cases were reported for the current 4-week period yielding a ratio for week 8 of zero (0).
† Ratio of current 4-week total to mean of 15 4-week totals (from previous, comparable, and subsequent 4-week periods for the past 5 years). The point where the hatched area begins is based on the mean and two standard deviations of these 4-week totals.
Alternate Text: The figure above shows selected notifiable disease reports for the United States, with comparison of provisional 4-week totals through February 25, 2012, with historical data. Reports of acute hepatitis C and pertussis increased. Reports of giardiasis, acute hepatitis A, acute hepatitis B, legionellosis, measles, meningococcal disease, and mumps all decreased.
TABLE II. Provisional cases of selected notifiable diseases, United States, weeks ending February 25, 2012, and February 26, 2011 (8th week)*
Reporting area
Chlamydia trachomatis infection
Coccidioidomycosis
Cryptosporidiosis
Current week
Previous 52 weeks
Cum 2012
Cum 2011
Current week
Previous 52 weeks
Cum 2012
Cum 2011
Current week
Previous 52 weeks
Cum 2012
Cum 2011
Med
Max
Med
Max
Med
Max
United States
10,634
26,782
30,750
153,380
204,705
55
400
587
2,149
3,542
31
133
399
584
745
New England
611
900
1,593
4,725
5,314
—
0
1
—
—
—
6
22
30
39
Connecticut
—
240
869
—
271
N
0
0
N
N
—
1
9
5
10
Maine
—
59
100
447
466
N
0
0
N
N
—
1
4
2
4
Massachusetts
497
424
860
3,029
3,103
N
0
0
N
N
—
3
8
15
18
New Hampshire
1
59
90
254
483
—
0
1
—
—
—
1
5
3
3
Rhode Island
90
80
187
859
752
—
0
0
—
—
—
0
1
—
1
Vermont
23
27
62
136
239
N
0
0
N
N
—
1
5
5
3
Mid. Atlantic
1,733
3,158
3,975
21,676
24,781
—
0
0
—
—
2
15
44
64
105
New Jersey
151
539
898
3,393
3,629
N
0
0
N
N
—
1
4
1
8
New York (Upstate)
754
715
1,903
4,659
4,880
N
0
0
N
N
1
4
16
17
26
New York City
159
1,023
1,315
5,412
8,570
N
0
0
N
N
—
1
6
12
11
Pennsylvania
669
1,043
1,599
8,212
7,702
N
0
0
N
N
1
8
27
34
60
E.N. Central
865
4,178
4,646
22,089
34,634
1
1
5
9
5
7
32
148
127
160
Illinois
17
1,186
1,434
4,277
9,705
N
0
0
N
N
—
3
26
3
17
Indiana
223
557
730
3,437
4,710
N
0
0
N
N
—
3
14
—
25
Michigan
488
935
1,210
6,275
8,277
—
1
3
5
1
1
7
14
30
32
Ohio
137
1,028
1,184
5,614
8,200
1
0
2
4
4
6
11
95
68
52
Wisconsin
—
461
551
2,486
3,742
N
0
0
N
N
—
8
65
26
34
W.N. Central
31
1,501
1,818
2,676
11,627
—
0
2
—
—
1
15
85
52
81
Iowa
13
212
433
1,526
1,707
N
0
0
N
N
—
6
19
16
30
Kansas
—
208
281
114
1,516
N
0
0
N
N
—
0
11
3
—
Minnesota
—
319
404
—
2,662
—
0
0
—
—
—
0
0
—
—
Missouri
—
529
759
—
3,970
—
0
0
—
—
—
5
61
17
23
Nebraska
—
124
213
546
859
—
0
2
—
—
—
2
12
6
22
North Dakota
—
46
76
5
344
N
0
0
N
N
—
0
12
—
—
South Dakota
18
62
89
485
569
N
0
0
N
N
1
2
13
10
6
S. Atlantic
4,045
5,464
7,444
40,760
43,174
—
0
2
—
—
16
21
61
139
157
Delaware
82
86
182
585
605
—
0
0
—
—
—
0
3
4
2
District of Columbia
134
110
217
1,006
838
—
0
0
—
—
—
0
1
—
2
Florida
789
1,504
1,687
10,943
11,580
N
0
0
N
N
12
8
17
66
66
Georgia
875
1,099
1,563
7,903
6,785
N
0
0
N
N
2
5
12
29
39
Maryland
217
478
769
1,806
3,504
—
0
2
—
—
—
1
7
16
8
North Carolina
628
997
1,688
7,299
7,426
N
0
0
N
N
—
0
46
—
9
South Carolina
478
535
1,344
4,691
5,498
N
0
0
N
N
2
2
6
13
20
Virginia
764
659
1,779
5,766
6,220
N
0
0
N
N
—
2
8
10
11
West Virginia
78
81
146
761
718
N
0
0
N
N
—
0
5
1
—
E.S. Central
1,612
1,918
2,804
15,188
13,917
—
0
0
—
—
1
8
25
39
22
Alabama
498
539
1,566
3,483
4,246
N
0
0
N
N
1
3
7
17
13
Kentucky
475
307
557
2,438
1,457
N
0
0
N
N
—
2
17
4
6
Mississippi
419
440
792
4,630
3,540
N
0
0
N
N
—
1
4
6
2
Tennessee
220
605
810
4,637
4,674
N
0
0
N
N
—
2
6
12
1
W.S. Central
333
3,295
4,311
18,411
25,594
—
0
1
—
1
2
9
44
50
44
Arkansas
272
317
439
2,609
2,147
N
0
0
N
N
—
0
2
3
1
Louisiana
—
356
1,071
1,566
3,059
—
0
1
—
1
—
1
9
11
5
Oklahoma
61
113
675
691
1,705
N
0
0
N
N
2
2
6
10
8
Texas
—
2,385
3,108
13,545
18,683
N
0
0
N
N
—
5
40
26
30
Mountain
849
1,715
2,419
10,459
14,244
54
308
459
1,923
2,722
1
10
29
41
77
Arizona
140
546
791
3,527
4,267
49
304
456
1,900
2,684
—
1
4
2
4
Colorado
394
408
847
2,575
3,591
N
0
0
N
N
—
2
11
4
22
Idaho
107
85
274
550
611
N
0
0
N
N
—
1
9
12
8
Montana
55
68
87
578
521
N
0
0
N
N
—
1
6
9
6
Nevada
—
200
319
566
2,064
5
2
5
17
15
—
0
2
2
2
New Mexico
152
220
336
1,598
1,797
—
1
4
—
15
—
2
9
8
20
Utah
1
135
190
957
1,064
—
0
4
4
6
—
1
5
1
7
Wyoming
—
31
67
108
329
—
0
2
2
2
1
0
3
3
8
Pacific
555
4,016
5,438
17,396
31,420
—
93
168
217
814
1
9
21
42
60
Alaska
40
108
152
812
971
N
0
0
N
N
—
0
3
—
3
California
—
3,017
4,509
11,887
23,893
—
93
168
217
814
—
6
16
38
29
Hawaii
—
113
142
—
962
N
0
0
N
N
—
0
1
2
—
Oregon
190
276
412
2,062
1,926
N
0
0
N
N
—
2
8
1
21
Washington
325
437
612
2,635
3,668
N
0
0
N
N
1
1
16
1
7
Territories
American Samoa
—
0
0
—
—
N
0
0
N
N
N
0
0
N
N
C.N.M.I.
—
—
—
—
—
—
—
—
—
—
—
—
—
—
—
Guam
—
15
44
—
88
—
0
0
—
—
—
0
0
—
—
Puerto Rico
176
105
348
1,009
889
N
0
0
N
N
N
0
0
N
N
U.S. Virgin Islands
—
16
27
—
112
—
0
0
—
—
—
0
0
—
—
C.N.M.I.: Commonwealth of Northern Mariana Islands.
U: Unavailable. —: No reported cases. N: Not reportable. NN: Not Nationally Notifiable. Cum: Cumulative year-to-date counts. Med: Median. Max: Maximum.
TABLE II. (Continued) Provisional cases of selected notifiable diseases, United States, weeks ending February 25, 2012, and February 26, 2011 (8th week)*
Reporting area
Dengue Virus Infection
Dengue Fever†
Dengue Hemorrhagic Fever§
Current week
Previous 52 weeks
Cum 2012
Cum 2011
Current week
Previous 52 weeks
Cum 2012
Cum 2011
Med
Max
Med
Max
United States
—
2
17
—
36
—
0
1
—
—
New England
—
0
1
—
1
—
0
0
—
—
Connecticut
—
0
0
—
—
—
0
0
—
—
Maine
—
0
0
—
—
—
0
0
—
—
Massachusetts
—
0
0
—
—
—
0
0
—
—
New Hampshire
—
0
0
—
—
—
0
0
—
—
Rhode Island
—
0
0
—
—
—
0
0
—
—
Vermont
—
0
1
—
1
—
0
0
—
—
Mid. Atlantic
—
1
6
—
10
—
0
0
—
—
New Jersey
—
0
0
—
—
—
0
0
—
—
New York (Upstate)
—
0
2
—
1
—
0
0
—
—
New York City
—
0
4
—
5
—
0
0
—
—
Pennsylvania
—
0
2
—
4
—
0
0
—
—
E.N. Central
—
0
2
—
5
—
0
1
—
—
Illinois
—
0
1
—
1
—
0
1
—
—
Indiana
—
0
1
—
1
—
0
0
—
—
Michigan
—
0
2
—
1
—
0
0
—
—
Ohio
—
0
1
—
—
—
0
0
—
—
Wisconsin
—
0
1
—
2
—
0
0
—
—
W.N. Central
—
0
2
—
1
—
0
0
—
—
Iowa
—
0
1
—
—
—
0
0
—
—
Kansas
—
0
1
—
—
—
0
0
—
—
Minnesota
—
0
1
—
1
—
0
0
—
—
Missouri
—
0
0
—
—
—
0
0
—
—
Nebraska
—
0
0
—
—
—
0
0
—
—
North Dakota
—
0
1
—
—
—
0
0
—
—
South Dakota
—
0
0
—
—
—
0
0
—
—
S. Atlantic
—
1
9
—
8
—
0
1
—
—
Delaware
—
0
2
—
—
—
0
0
—
—
District of Columbia
—
0
0
—
—
—
0
0
—
—
Florida
—
1
7
—
5
—
0
0
—
—
Georgia
—
0
1
—
1
—
0
0
—
—
Maryland
—
0
2
—
—
—
0
0
—
—
North Carolina
—
0
1
—
1
—
0
0
—
—
South Carolina
—
0
1
—
—
—
0
0
—
—
Virginia
—
0
1
—
1
—
0
1
—
—
West Virginia
—
0
0
—
—
—
0
0
—
—
E.S. Central
—
0
3
—
—
—
0
0
—
—
Alabama
—
0
1
—
—
—
0
0
—
—
Kentucky
—
0
1
—
—
—
0
0
—
—
Mississippi
—
0
0
—
—
—
0
0
—
—
Tennessee
—
0
2
—
—
—
0
0
—
—
W.S. Central
—
0
2
—
—
—
0
0
—
—
Arkansas
—
0
0
—
—
—
0
0
—
—
Louisiana
—
0
1
—
—
—
0
0
—
—
Oklahoma
—
0
0
—
—
—
0
0
—
—
Texas
—
0
1
—
—
—
0
0
—
—
Mountain
—
0
1
—
2
—
0
0
—
—
Arizona
—
0
1
—
1
—
0
0
—
—
Colorado
—
0
0
—
—
—
0
0
—
—
Idaho
—
0
0
—
—
—
0
0
—
—
Montana
—
0
0
—
—
—
0
0
—
—
Nevada
—
0
1
—
—
—
0
0
—
—
New Mexico
—
0
1
—
1
—
0
0
—
—
Utah
—
0
1
—
—
—
0
0
—
—
Wyoming
—
0
0
—
—
—
0
0
—
—
Pacific
—
0
4
—
9
—
0
0
—
—
Alaska
—
0
0
—
—
—
0
0
—
—
California
—
0
2
—
3
—
0
0
—
—
Hawaii
—
0
4
—
4
—
0
0
—
—
Oregon
—
0
0
—
—
—
0
0
—
—
Washington
—
0
1
—
2
—
0
0
—
—
Territories
American Samoa
—
0
0
—
—
—
0
0
—
—
C.N.M.I.
—
—
—
—
—
—
—
—
—
—
Guam
—
0
0
—
—
—
0
0
—
—
Puerto Rico
—
10
83
—
159
—
0
3
—
1
U.S. Virgin Islands
—
0
0
—
—
—
0
0
—
—
C.N.M.I.: Commonwealth of Northern Mariana Islands.
U: Unavailable. —: No reported cases. N: Not reportable. NN: Not Nationally Notifiable. Cum: Cumulative year-to-date counts. Med: Median. Max: Maximum.
† Dengue Fever includes cases that meet criteria for Dengue Fever with hemorrhage, other clinical and unknown case classifications.
§ DHF includes cases that meet criteria for dengue shock syndrome (DSS), a more severe form of DHF.
TABLE II. (Continued) Provisional cases of selected notifiable diseases, United States, weeks ending February 25, 2012, and February 26, 2011 (8th week)*
Reporting area
Ehrlichiosis/Anaplasmosis†
Ehrlichia chaffeensis
Anaplasma phagocytophilum
Undetermined
Current week
Previous 52 weeks
Cum 2012
Cum 2011
Current week
Previous 52 weeks
Cum 2012
Cum 2011
Current week
Previous 52 weeks
Cum 2012
Cum 2011
Med
Max
Med
Max
Med
Max
United States
1
9
90
9
11
2
16
58
15
19
1
2
8
3
2
New England
1
0
1
1
—
—
3
28
2
12
—
0
1
—
—
Connecticut
—
0
0
—
—
—
0
0
—
—
—
0
0
—
—
Maine
—
0
1
—
—
—
0
3
1
1
—
0
0
—
—
Massachusetts
—
0
0
—
—
—
1
18
—
1
—
0
0
—
—
New Hampshire
—
0
1
—
—
—
0
4
—
—
—
0
1
—
—
Rhode Island
1
0
1
1
—
—
0
15
1
10
—
0
1
—
—
Vermont
—
0
0
—
—
—
0
1
—
—
—
0
0
—
—
Mid. Atlantic
—
1
5
—
1
2
6
43
11
3
1
0
2
1
—
New Jersey
—
0
0
—
—
—
0
0
—
—
—
0
0
—
—
New York (Upstate)
—
0
4
—
—
2
3
43
8
2
1
0
2
1
—
New York City
—
0
2
—
1
—
1
5
3
1
—
0
0
—
—
Pennsylvania
—
0
0
—
—
—
0
1
—
—
—
0
0
—
—
E.N. Central
—
0
5
—
2
—
0
2
—
1
—
0
6
—
2
Illinois
—
0
4
—
1
—
0
2
—
—
—
0
1
—
1
Indiana
—
0
0
—
—
—
0
0
—
—
—
0
4
—
1
Michigan
—
0
2
—
—
—
0
0
—
—
—
0
2
—
—
Ohio
—
0
1
—
1
—
0
1
—
—
—
0
1
—
—
Wisconsin
—
0
0
—
—
—
0
1
—
1
—
0
1
—
—
W.N. Central
—
1
16
1
—
—
0
6
—
—
—
0
6
—
—
Iowa
N
0
0
N
N
N
0
0
N
N
N
0
0
N
N
Kansas
—
0
2
—
—
—
0
1
—
—
—
0
1
—
—
Minnesota
—
0
0
—
—
—
0
1
—
—
—
0
0
—
—
Missouri
—
1
16
1
—
—
0
5
—
—
—
0
6
—
—
Nebraska
—
0
1
—
—
—
0
1
—
—
—
0
1
—
—
North Dakota
N
0
0
N
N
N
0
0
N
N
N
0
0
N
N
South Dakota
—
0
1
—
—
—
0
1
—
—
—
0
0
—
—
S. Atlantic
—
3
33
7
8
—
1
8
2
2
—
0
2
2
—
Delaware
—
0
2
—
1
—
0
1
—
—
—
0
0
—
—
District of Columbia
N
0
0
N
N
N
0
0
N
N
N
0
0
N
N
Florida
—
0
3
—
1
—
0
3
—
—
—
0
0
—
—
Georgia
—
0
3
4
1
—
0
2
2
—
—
0
1
1
—
Maryland
—
0
3
—
3
—
0
2
—
—
—
0
1
1
—
North Carolina
—
0
17
1
2
—
0
6
—
2
—
0
0
—
—
South Carolina
—
0
1
—
—
—
0
0
—
—
—
0
1
—
—
Virginia
—
1
13
2
—
—
0
3
—
—
—
0
1
—
—
West Virginia
—
0
1
—
—
—
0
0
—
—
—
0
1
—
—
E.S. Central
—
1
8
—
—
—
0
2
—
1
—
0
3
—
—
Alabama
—
0
2
—
—
—
0
1
—
1
N
0
0
N
N
Kentucky
—
0
3
—
—
—
0
0
—
—
—
0
0
—
—
Mississippi
—
0
1
—
—
—
0
1
—
—
—
0
0
—
—
Tennessee
—
0
5
—
—
—
0
1
—
—
—
0
3
—
—
W.S. Central
—
0
30
—
—
—
0
3
—
—
—
0
0
—
—
Arkansas
—
0
13
—
—
—
0
3
—
—
—
0
0
—
—
Louisiana
—
0
0
—
—
—
0
0
—
—
—
0
0
—
—
Oklahoma
—
0
25
—
—
—
0
1
—
—
—
0
0
—
—
Texas
—
0
1
—
—
—
0
1
—
—
—
0
0
—
—
Mountain
—
0
0
—
—
—
0
0
—
—
—
0
1
—
—
Arizona
—
0
0
—
—
—
0
0
—
—
—
0
1
—
—
Colorado
N
0
0
N
N
N
0
0
N
N
N
0
0
N
N
Idaho
N
0
0
N
N
N
0
0
N
N
N
0
0
N
N
Montana
N
0
0
N
N
N
0
0
N
N
N
0
0
N
N
Nevada
N
0
0
N
N
N
0
0
N
N
N
0
0
N
N
New Mexico
N
0
0
N
N
N
0
0
N
N
N
0
0
N
N
Utah
—
0
0
—
—
—
0
0
—
—
—
0
1
—
—
Wyoming
—
0
0
—
—
—
0
0
—
—
—
0
0
—
—
Pacific
—
0
0
—
—
—
0
1
—
—
—
0
2
—
—
Alaska
N
0
0
N
N
N
0
0
N
N
N
0
0
N
N
California
—
0
0
—
—
—
0
0
—
—
—
0
2
—
—
Hawaii
N
0
0
N
N
N
0
0
N
N
N
0
0
N
N
Oregon
—
0
0
—
—
—
0
1
—
—
—
0
0
—
—
Washington
—
0
0
—
—
—
0
0
—
—
—
0
0
—
—
Territories
American Samoa
N
0
0
N
N
N
0
0
N
N
N
0
0
N
N
C.N.M.I.
—
—
—
—
—
—
—
—
—
—
—
—
—
—
—
Guam
N
0
0
N
N
N
0
0
N
N
N
0
0
N
N
Puerto Rico
N
0
0
N
N
N
0
0
N
N
N
0
0
N
N
U.S. Virgin Islands
—
0
0
—
—
—
0
0
—
—
—
0
0
—
—
C.N.M.I.: Commonwealth of Northern Mariana Islands.
U: Unavailable. —: No reported cases. N: Not reportable. NN: Not Nationally Notifiable. Cum: Cumulative year-to-date counts. Med: Median. Max: Maximum.
† Cumulative total E. ewingii cases reported for year 2011 = 13, and 0 case reports for 2012.
TABLE II. (Continued) Provisional cases of selected notifiable diseases, United States, weeks ending February 25, 2012, and February 26, 2011 (8th week)*
Reporting area
Giardiasis
Gonorrhea
Haemophilus influenzae, invasive† All ages, all serotypes
Current week
Previous 52 weeks
Cum 2012
Cum 2011
Current week
Previous 52 weeks
Cum 2012
Cum 2011
Current week
Previous 52 weeks
Cum 2012
Cum 2011
Med
Max
Med
Max
Med
Max
United States
100
283
451
1,469
1,998
2,350
5,996
6,805
36,639
46,950
28
65
108
472
548
New England
3
26
64
100
186
71
109
178
500
746
—
4
9
34
35
Connecticut
—
4
10
24
37
—
44
101
—
337
—
1
5
11
8
Maine
1
3
10
12
16
—
5
18
52
22
—
0
2
4
5
Massachusetts
—
12
29
47
97
59
47
80
345
318
—
2
7
16
16
New Hampshire
—
2
8
6
11
1
2
8
17
17
—
0
2
2
2
Rhode Island
—
0
10
2
10
10
7
35
81
47
—
0
2
1
3
Vermont
2
3
19
9
15
1
0
6
5
5
—
0
2
—
1
Mid. Atlantic
29
56
91
268
429
410
735
988
5,297
5,594
5
15
30
117
100
New Jersey
—
1
14
—
57
31
149
217
921
960
—
2
6
6
20
New York (Upstate)
19
20
50
92
112
117
116
369
800
747
3
3
15
30
19
New York City
5
16
29
108
144
50
240
315
1,247
1,921
—
4
10
36
17
Pennsylvania
5
15
30
68
116
212
268
492
2,329
1,966
2
5
15
45
44
E.N. Central
20
50
92
263
356
251
1,074
1,279
5,708
9,106
5
11
22
54
98
Illinois
—
11
20
42
79
7
302
397
1,038
2,445
—
3
11
1
28
Indiana
—
6
13
16
45
65
135
172
841
1,220
—
2
6
7
11
Michigan
5
10
22
77
73
133
237
375
1,659
2,177
1
1
5
12
15
Ohio
15
15
30
96
100
46
313
403
1,614
2,574
4
4
7
29
29
Wisconsin
—
8
21
32
59
—
92
118
556
690
—
1
4
5
15
W.N. Central
3
18
50
106
136
7
313
382
498
2,285
2
2
9
18
18
Iowa
1
4
15
27
31
4
37
108
280
292
—
0
1
—
—
Kansas
—
2
9
10
14
—
42
65
35
288
—
0
2
2
1
Minnesota
—
0
0
—
—
—
44
61
—
331
—
0
0
—
—
Missouri
1
6
17
40
53
—
149
204
—
1,081
1
1
5
11
10
Nebraska
1
3
11
21
26
—
26
52
124
167
1
0
2
5
7
North Dakota
—
0
12
—
—
—
5
14
—
32
—
0
6
—
—
South Dakota
—
1
8
8
12
3
11
20
59
94
—
0
1
—
—
S. Atlantic
25
53
105
342
354
1,011
1,500
1,946
10,720
11,634
10
14
31
127
138
Delaware
—
0
3
1
4
13
15
35
121
146
—
0
2
—
1
District of Columbia
—
1
5
2
8
46
38
105
384
324
—
0
1
—
—
Florida
20
23
69
142
183
203
373
473
2,714
2,968
7
4
12
36
44
Georgia
—
13
51
117
61
242
322
456
2,202
2,111
—
2
6
20
32
Maryland
2
6
14
41
41
49
113
176
511
894
1
2
6
20
17
North Carolina
N
0
0
N
N
199
325
548
2,231
2,609
1
1
7
12
14
South Carolina
—
2
8
16
13
113
156
421
1,276
1,505
—
1
5
18
7
Virginia
3
5
12
23
44
136
123
353
1,176
938
1
2
8
14
23
West Virginia
—
0
8
—
—
10
14
29
105
139
—
0
5
7
—
E.S. Central
—
4
9
25
17
377
523
789
4,015
3,759
3
4
12
34
30
Alabama
—
4
9
25
17
112
167
408
948
1,290
—
1
3
5
10
Kentucky
N
0
0
N
N
97
79
151
588
381
1
1
4
9
6
Mississippi
N
0
0
N
N
113
118
242
1,280
952
—
0
3
5
3
Tennessee
N
0
0
N
N
55
148
243
1,199
1,136
2
2
8
15
11
W.S. Central
1
4
15
35
32
94
865
1,173
4,825
6,815
2
2
10
27
34
Arkansas
1
3
8
14
11
70
89
138
690
672
—
0
3
3
6
Louisiana
—
2
10
21
21
—
106
255
453
893
—
1
4
10
16
Oklahoma
—
0
0
—
—
24
31
196
182
570
2
1
9
14
12
Texas
N
0
0
N
N
—
587
828
3,500
4,680
—
0
1
—
—
Mountain
5
22
41
86
154
79
209
325
1,326
1,744
1
5
10
37
61
Arizona
—
2
6
10
17
29
91
131
681
575
—
1
6
9
23
Colorado
—
7
23
30
43
44
39
77
289
413
—
1
3
3
17
Idaho
—
3
9
10
24
—
2
15
3
22
—
0
2
4
2
Montana
—
2
5
7
5
3
1
4
17
14
—
0
1
2
2
Nevada
3
1
4
10
16
—
38
77
80
415
—
0
2
3
3
New Mexico
—
1
6
3
11
3
35
73
211
253
1
1
3
11
9
Utah
—
3
9
10
31
—
6
10
41
38
—
0
3
4
5
Wyoming
2
0
2
6
7
—
0
3
4
14
—
0
1
1
—
Pacific
14
47
181
244
334
50
635
758
3,750
5,267
—
4
9
24
34
Alaska
1
2
7
9
11
2
18
31
98
142
—
0
3
2
5
California
—
32
51
161
231
—
520
610
3,164
4,370
—
1
5
8
11
Hawaii
—
0
4
2
4
—
12
24
—
112
—
0
3
3
5
Oregon
2
6
20
40
66
13
27
60
174
196
—
1
6
11
13
Washington
11
6
147
32
22
35
50
79
314
447
—
0
1
—
—
Territories
American Samoa
—
0
0
—
—
—
0
0
—
—
—
0
0
—
—
C.N.M.I.
—
—
—
—
—
—
—
—
—
—
—
—
—
—
—
Guam
—
0
0
—
—
—
0
5
—
1
—
0
0
—
—
Puerto Rico
—
0
4
—
12
7
6
14
38
57
—
0
0
—
—
U.S. Virgin Islands
—
0
0
—
—
—
2
10
—
22
—
0
0
—
—
C.N.M.I.: Commonwealth of Northern Mariana Islands.
U: Unavailable. —: No reported cases. N: Not reportable. NN: Not Nationally Notifiable. Cum: Cumulative year-to-date counts. Med: Median. Max: Maximum.
† Data for H. influenzae (age <5 yrs for serotype b, nonserotype b, and unknown serotype) are available in Table I.
TABLE II. (Continued) Provisional cases of selected notifiable diseases, United States, weeks ending February 25, 2012, and February 26, 2011 (8th week)*
Reporting area
Hepatitis (viral, acute), by type
A
B
C
Current week
Previous 52 weeks
Cum 2012
Cum 2011
Current week
Previous 52 weeks
Cum 2012
Cum 2011
Current week
Previous 52 weeks
Cum 2012
Cum 2011
Med
Max
Med
Max
Med
Max
United States
10
22
41
122
190
34
49
101
296
413
10
21
42
126
125
New England
—
1
5
3
13
—
1
8
1
20
—
1
5
2
9
Connecticut
—
0
3
2
5
—
0
2
—
5
—
0
4
2
8
Maine
—
0
2
1
—
—
0
2
1
1
—
0
3
—
—
Massachusetts
—
0
3
—
4
—
0
6
—
13
—
0
2
—
1
New Hampshire
—
0
0
—
—
—
0
1
—
1
N
0
0
N
N
Rhode Island
—
0
1
—
2
U
0
0
U
U
U
0
0
U
U
Vermont
—
0
2
—
2
—
0
0
—
—
—
0
1
—
—
Mid. Atlantic
2
4
8
24
37
1
5
11
23
44
2
2
5
15
8
New Jersey
—
1
3
—
5
—
1
4
6
9
—
0
2
2
—
New York (Upstate)
1
1
4
9
4
—
1
4
4
9
1
1
4
5
5
New York City
—
1
4
6
16
—
1
5
8
14
—
0
1
—
1
Pennsylvania
1
1
5
9
12
1
1
4
5
12
1
1
3
8
2
E.N. Central
—
3
7
10
37
5
5
37
37
72
3
2
8
17
24
Illinois
—
1
5
3
7
—
1
3
1
17
—
0
2
—
1
Indiana
—
0
1
1
6
—
1
4
4
9
—
0
5
3
15
Michigan
—
1
6
5
11
2
1
6
7
19
2
1
5
13
7
Ohio
—
0
2
1
11
3
1
30
24
21
1
0
1
1
—
Wisconsin
—
0
1
—
2
—
0
3
1
6
—
0
1
—
1
W.N. Central
—
1
7
8
8
1
2
9
13
15
—
0
4
1
—
Iowa
—
0
1
—
1
—
0
1
1
1
—
0
0
—
—
Kansas
—
0
1
—
1
—
0
2
—
3
—
0
1
1
—
Minnesota
—
0
7
—
—
—
0
7
—
—
—
0
2
—
—
Missouri
—
0
3
5
3
1
1
4
11
6
—
0
0
—
—
Nebraska
—
0
1
3
1
—
0
2
1
4
—
0
1
—
—
North Dakota
—
0
0
—
—
—
0
0
—
—
—
0
0
—
—
South Dakota
—
0
0
—
2
—
0
0
—
1
—
0
0
—
—
S. Atlantic
5
4
11
25
37
21
13
57
99
96
4
5
14
45
28
Delaware
—
0
1
1
1
—
0
2
3
—
U
0
0
U
U
District of Columbia
—
0
0
—
—
—
0
0
—
—
—
0
0
—
—
Florida
3
1
8
12
11
6
4
7
30
31
2
1
5
20
7
Georgia
—
1
5
2
11
1
2
7
16
21
—
1
3
2
9
Maryland
—
0
4
2
4
—
1
4
13
8
—
1
3
4
3
North Carolina
1
0
3
4
3
2
1
9
9
20
2
1
7
6
6
South Carolina
1
0
2
1
2
1
1
3
7
5
—
0
1
—
—
Virginia
—
0
3
2
5
—
2
5
10
11
—
0
3
3
3
West Virginia
—
0
2
1
—
11
0
43
11
—
—
0
7
10
—
E.S. Central
—
1
6
4
5
3
10
20
69
76
—
5
10
26
24
Alabama
—
0
2
2
—
1
2
6
11
13
—
0
3
2
—
Kentucky
—
0
2
—
2
1
3
10
23
28
—
2
8
12
12
Mississippi
—
0
1
—
1
1
1
4
6
4
U
0
0
U
U
Tennessee
—
0
5
2
2
—
4
9
29
31
—
1
5
12
12
W.S. Central
2
3
7
20
7
3
6
14
32
36
—
1
5
5
13
Arkansas
—
0
2
1
—
—
1
4
5
4
—
0
0
—
—
Louisiana
—
0
2
—
1
—
0
2
6
11
—
0
1
—
4
Oklahoma
—
0
2
—
—
3
1
9
5
4
—
1
4
—
5
Texas
2
3
7
19
6
—
3
11
16
17
—
0
3
5
4
Mountain
1
1
5
12
14
—
1
4
8
21
1
1
5
3
12
Arizona
—
0
2
4
4
—
0
3
1
2
U
0
0
U
U
Colorado
—
0
2
3
6
—
0
2
—
5
—
0
2
—
4
Idaho
1
0
1
3
1
—
0
0
—
2
1
0
1
1
5
Montana
—
0
1
—
1
—
0
0
—
—
—
0
2
—
—
Nevada
—
0
3
2
—
—
0
3
7
7
—
0
2
2
—
New Mexico
—
0
1
—
1
—
0
2
—
2
—
0
2
—
1
Utah
—
0
1
—
—
—
0
1
—
3
—
0
2
—
2
Wyoming
—
0
1
—
1
—
0
0
—
—
—
0
1
—
—
Pacific
—
3
12
16
32
—
3
8
14
33
—
2
11
12
7
Alaska
—
0
1
—
—
—
0
1
—
1
U
0
0
U
U
California
—
3
7
10
27
—
2
7
7
23
—
1
5
5
2
Hawaii
—
0
2
2
1
—
0
1
1
2
U
0
0
U
U
Oregon
—
0
2
1
1
—
0
4
5
5
—
0
2
4
3
Washington
—
0
4
3
3
—
0
3
1
2
—
0
9
3
2
Territories
American Samoa
—
0
0
—
—
—
0
0
—
—
—
0
0
—
—
C.N.M.I.
—
—
—
—
—
—
—
—
—
—
—
—
—
—
—
Guam
—
0
5
—
6
—
2
8
—
15
—
0
3
—
6
Puerto Rico
—
0
1
—
—
—
0
2
—
—
N
0
0
N
N
U.S. Virgin Islands
—
0
0
—
—
—
0
0
—
—
—
0
0
—
—
C.N.M.I.: Commonwealth of Northern Mariana Islands.
U: Unavailable. —: No reported cases. N: Not reportable. NN: Not Nationally Notifiable. Cum: Cumulative year-to-date counts. Med: Median. Max: Maximum.
TABLE II. (Continued) Provisional cases of selected notifiable diseases, United States, weeks ending February 25, 2012, and February 26, 2011 (8th week)*
Reporting area
Legionellosis
Lyme disease
Malaria
Current week
Previous 52 weeks
Cum 2012
Cum 2011
Current week
Previous 52 weeks
Cum 2012
Cum 2011
Current week
Previous 52 weeks
Cum 2012
Cum 2011
Med
Max
Med
Max
Med
Max
United States
12
72
178
238
305
83
541
2,124
1,469
1,534
4
26
51
116
188
New England
—
4
40
11
25
—
85
503
79
414
—
1
7
6
13
Connecticut
—
1
11
3
4
—
38
236
10
168
—
0
2
—
1
Maine
—
0
3
—
1
—
13
67
26
27
—
0
2
—
—
Massachusetts
—
3
24
4
16
—
16
106
16
138
—
0
6
5
10
New Hampshire
—
0
3
—
1
—
10
90
8
59
—
0
1
—
—
Rhode Island
—
0
9
4
2
—
1
31
2
3
—
0
2
—
—
Vermont
—
0
2
—
1
—
6
70
17
19
—
0
1
1
2
Mid. Atlantic
3
18
87
60
78
73
344
1,215
1,133
786
—
6
13
17
48
New Jersey
—
2
16
1
17
44
159
543
678
272
—
0
2
—
5
New York (Upstate)
2
6
27
19
21
17
57
212
106
67
—
1
4
2
5
New York City
—
3
14
11
19
—
3
23
—
24
—
4
11
12
30
Pennsylvania
1
5
42
29
21
12
113
539
349
423
—
1
5
3
8
E.N. Central
1
14
51
43
54
1
22
301
14
101
1
3
10
12
20
Illinois
—
2
11
6
7
—
1
21
—
5
—
1
5
2
7
Indiana
—
2
8
8
10
—
1
12
1
—
—
0
2
2
2
Michigan
—
2
15
—
12
—
1
13
7
—
—
0
4
2
3
Ohio
1
7
34
29
25
1
1
6
5
3
1
0
4
5
7
Wisconsin
—
0
1
—
—
—
20
259
1
93
—
0
2
1
1
W.N. Central
—
1
8
5
6
—
1
16
3
2
—
1
5
6
4
Iowa
—
0
2
—
—
—
0
13
1
1
—
0
3
1
—
Kansas
—
0
2
—
1
—
0
2
—
—
—
0
2
2
1
Minnesota
—
0
0
—
—
—
0
0
—
—
—
0
0
—
—
Missouri
—
1
5
5
4
—
0
2
—
1
—
0
2
3
2
Nebraska
—
0
2
—
—
—
0
2
2
—
—
0
1
—
1
North Dakota
—
0
1
—
—
—
0
9
—
—
—
0
0
—
—
South Dakota
—
0
1
—
1
—
0
2
—
—
—
0
1
—
—
S. Atlantic
2
11
30
61
44
8
66
180
219
218
3
9
26
45
67
Delaware
—
0
4
4
1
—
13
48
54
63
—
0
3
1
—
District of Columbia
—
0
3
1
—
—
0
3
1
3
—
0
2
—
3
Florida
1
4
13
28
22
1
3
8
18
4
—
2
6
13
14
Georgia
—
1
4
5
3
—
0
5
5
1
1
1
6
6
11
Maryland
1
2
15
8
6
4
20
115
77
82
—
2
16
12
18
North Carolina
—
1
7
5
6
—
0
13
1
6
—
0
7
1
8
South Carolina
—
0
5
3
1
—
0
6
3
1
—
0
1
2
—
Virginia
—
1
7
7
5
3
17
75
54
55
2
1
8
10
13
West Virginia
—
0
5
—
—
—
0
20
6
3
—
0
1
—
—
E.S. Central
—
2
11
5
10
—
1
5
1
2
—
1
4
—
2
Alabama
—
0
2
2
1
—
0
2
—
1
—
0
3
—
1
Kentucky
—
1
4
—
4
—
0
1
1
—
—
0
2
—
—
Mississippi
—
0
3
—
1
—
0
1
—
—
—
0
1
—
—
Tennessee
—
1
8
3
4
—
0
4
—
1
—
0
3
—
1
W.S. Central
4
2
8
9
12
—
1
6
2
2
—
1
5
6
6
Arkansas
—
0
2
—
—
—
0
0
—
—
—
0
1
—
—
Louisiana
—
0
2
1
7
—
0
1
1
—
—
0
1
—
—
Oklahoma
—
0
3
—
1
—
0
0
—
—
—
0
3
4
1
Texas
4
2
7
8
4
—
1
6
1
2
—
0
5
2
5
Mountain
1
2
9
11
20
1
1
5
6
3
—
1
5
7
10
Arizona
1
1
4
4
5
—
0
4
1
1
—
0
4
1
3
Colorado
—
0
4
—
7
—
0
1
—
—
—
0
3
—
3
Idaho
—
0
1
1
1
—
0
2
2
—
—
0
1
1
—
Montana
—
0
1
—
—
—
0
3
—
—
—
0
1
—
—
Nevada
—
0
2
3
1
1
0
1
1
—
—
0
2
4
2
New Mexico
—
0
2
—
1
—
0
2
—
1
—
0
1
—
2
Utah
—
0
2
2
5
—
0
1
1
1
—
0
1
1
—
Wyoming
—
0
2
1
—
—
0
1
1
—
—
0
0
—
—
Pacific
1
5
17
33
56
—
2
8
12
6
—
3
11
17
18
Alaska
—
0
0
—
—
—
0
3
1
—
—
0
1
1
2
California
—
4
11
27
49
—
1
8
11
3
—
3
7
15
11
Hawaii
—
0
2
—
1
N
0
0
N
N
—
0
1
—
—
Oregon
1
0
3
6
1
—
0
2
—
3
—
0
4
1
4
Washington
—
0
13
—
5
—
0
5
—
—
—
0
2
—
1
Territories
American Samoa
N
0
0
N
N
N
0
0
N
N
—
0
1
—
—
C.N.M.I.
—
—
—
—
—
—
—
—
—
—
—
—
—
—
—
Guam
—
0
0
—
—
—
0
0
—
—
—
0
0
—
—
Puerto Rico
—
0
0
—
—
N
0
0
N
N
—
0
0
—
—
U.S. Virgin Islands
—
0
0
—
—
—
0
0
—
—
—
0
0
—
—
C.N.M.I.: Commonwealth of Northern Mariana Islands.
U: Unavailable. —: No reported cases. N: Not reportable. NN: Not Nationally Notifiable. Cum: Cumulative year-to-date counts. Med: Median. Max: Maximum.
TABLE II. (Continued) Provisional cases of selected notifiable diseases, United States, weeks ending February 25, 2012, and February 26, 2011 (8th week)*
Reporting area
Meningococcal disease, invasive† All serogroups
Mumps
Pertussis
Current week
Previous 52 weeks
Cum 2012
Cum 2011
Current week
Previous 52 weeks
Cum 2012
Cum 2011
Current week
Previous 52 weeks
Cum 2012
Cum 2011
Med
Max
Med
Max
Med
Max
United States
5
12
26
72
143
—
6
20
23
67
128
306
817
2,231
2,736
New England
—
0
3
1
4
—
0
2
—
1
3
17
33
146
82
Connecticut
—
0
1
—
1
—
0
0
—
—
—
1
7
4
13
Maine
—
0
1
—
—
—
0
2
—
—
—
3
19
20
18
Massachusetts
—
0
2
1
3
—
0
1
—
1
—
4
10
24
36
New Hampshire
—
0
1
—
—
—
0
0
—
—
—
2
13
7
8
Rhode Island
—
0
1
—
—
—
0
2
—
—
—
1
10
16
6
Vermont
—
0
3
—
—
—
0
1
—
—
3
1
17
75
1
Mid. Atlantic
2
2
4
12
17
—
0
7
—
7
63
42
184
539
237
New Jersey
—
0
2
—
2
—
0
1
—
6
—
4
12
19
23
New York (Upstate)
2
0
4
3
2
—
0
3
—
1
44
15
139
292
69
New York City
—
0
2
4
7
—
0
6
—
—
—
4
42
41
—
Pennsylvania
—
0
2
5
6
—
0
1
—
—
19
13
30
187
145
E.N. Central
—
2
6
7
17
—
1
12
4
13
9
67
218
575
656
Illinois
—
0
3
—
6
—
1
10
—
6
—
21
123
119
125
Indiana
—
0
2
—
2
—
0
2
1
—
—
4
21
10
65
Michigan
—
0
2
1
3
—
0
2
2
1
1
11
38
98
168
Ohio
—
0
2
5
4
—
0
2
1
5
8
12
22
99
217
Wisconsin
—
0
2
1
2
—
0
1
—
1
—
14
67
249
81
W.N. Central
—
1
3
4
11
—
0
3
2
6
3
21
119
135
154
Iowa
—
0
1
—
2
—
0
2
—
—
—
4
9
18
42
Kansas
—
0
1
1
1
—
0
1
—
2
—
2
6
12
22
Minnesota
—
0
0
—
—
—
0
1
—
—
—
0
110
—
—
Missouri
—
0
2
3
4
—
0
2
2
3
3
8
33
99
67
Nebraska
—
0
2
—
3
—
0
1
—
1
—
1
5
3
18
North Dakota
—
0
1
—
—
—
0
3
—
—
—
0
10
—
3
South Dakota
—
0
1
—
1
—
0
0
—
—
—
0
7
3
2
S. Atlantic
2
2
8
11
22
—
1
4
4
2
21
27
55
198
285
Delaware
—
0
1
—
—
—
0
0
—
—
1
0
5
7
5
District of Columbia
—
0
1
—
—
—
0
1
—
—
—
0
2
1
1
Florida
1
1
5
8
7
—
0
2
2
—
8
6
17
65
44
Georgia
1
0
1
1
2
—
0
2
—
—
—
3
7
10
47
Maryland
—
0
2
2
1
—
0
1
1
—
3
2
10
28
23
North Carolina
—
0
3
—
7
—
0
2
—
—
3
3
20
13
64
South Carolina
—
0
1
—
3
—
0
1
—
—
—
2
9
8
36
Virginia
—
0
2
—
2
—
0
4
—
2
6
6
25
44
65
West Virginia
—
0
3
—
—
—
0
1
1
—
—
0
15
22
—
E.S. Central
—
0
3
—
9
—
0
1
1
3
—
9
19
84
88
Alabama
—
0
2
—
5
—
0
1
—
1
—
2
11
15
22
Kentucky
—
0
2
—
—
—
0
0
—
—
—
3
10
38
40
Mississippi
—
0
1
—
1
—
0
1
1
2
—
1
4
9
4
Tennessee
—
0
1
—
3
—
0
1
—
—
—
2
7
22
22
W.S. Central
1
1
5
4
13
—
1
5
6
29
8
19
107
95
114
Arkansas
—
0
2
—
3
—
0
2
—
—
—
1
5
2
7
Louisiana
—
0
2
1
3
—
0
0
—
—
—
0
3
2
8
Oklahoma
—
0
2
1
1
—
0
2
—
—
—
0
11
—
2
Texas
1
0
2
2
6
—
1
5
6
29
8
18
104
91
97
Mountain
—
1
4
7
11
—
0
2
2
1
6
39
86
236
408
Arizona
—
0
1
1
3
—
0
0
—
—
—
13
57
124
165
Colorado
—
0
1
—
2
—
0
1
1
—
—
7
25
47
92
Idaho
—
0
1
1
2
—
0
2
—
—
1
3
12
17
21
Montana
—
0
2
2
—
—
0
1
1
—
5
1
32
19
37
Nevada
—
0
1
2
—
—
0
0
—
—
—
0
5
10
7
New Mexico
—
0
1
1
—
—
0
1
—
1
—
3
24
14
20
Utah
—
0
1
—
4
—
0
0
—
—
—
6
15
2
64
Wyoming
—
0
0
—
—
—
0
1
—
—
—
0
3
3
2
Pacific
—
2
10
26
39
—
0
11
4
5
15
60
256
223
712
Alaska
—
0
1
—
1
—
0
1
—
—
1
0
3
11
13
California
—
1
7
17
31
—
0
11
3
—
—
33
78
21
625
Hawaii
—
0
1
1
1
—
0
1
—
2
—
2
10
32
6
Oregon
—
0
4
8
4
—
0
1
—
3
—
5
23
24
28
Washington
—
0
3
—
2
—
0
1
1
—
14
12
204
135
40
Territories
American Samoa
—
0
0
—
—
—
0
0
—
—
—
0
0
—
—
C.N.M.I.
—
—
—
—
—
—
—
—
—
—
—
—
—
—
—
Guam
—
0
0
—
—
—
1
3
—
4
—
2
14
—
6
Puerto Rico
—
0
0
—
—
—
0
1
1
—
—
0
1
—
1
U.S. Virgin Islands
—
0
0
—
—
—
0
0
—
—
—
0
0
—
—
C.N.M.I.: Commonwealth of Northern Mariana Islands.
U: Unavailable. —: No reported cases. N: Not reportable. NN: Not Nationally Notifiable. Cum: Cumulative year-to-date counts. Med: Median. Max: Maximum.
† Data for meningococcal disease, invasive caused by serogroups A, C, Y, and W-135; serogroup B; other serogroup; and unknown serogroup are available in Table I.
TABLE II. (Continued) Provisional cases of selected notifiable diseases, United States, weeks ending February 25, 2012, and February 26, 2011 (8th week)*
Reporting area
Rabies, animal
Salmonellosis
Shiga toxin-producing E. coli(STEC)†
Current week
Previous 52 weeks
Cum 2012
Cum 2011
Current week
Previous 52 weeks
Cum 2012
Cum 2011
Current week
Previous 52 weeks
Cum 2012
Cum 2011
Med
Max
Med
Max
Med
Max
United States
21
61
105
292
377
200
898
1,909
3,022
3,784
16
93
208
276
306
New England
—
5
16
44
17
—
37
107
103
183
—
3
13
10
14
Connecticut
—
3
10
19
4
—
8
30
29
53
—
1
4
5
7
Maine
—
1
6
15
4
—
2
7
9
20
—
0
3
—
—
Massachusetts
—
0
0
—
—
—
19
44
46
80
—
1
9
5
2
New Hampshire
—
0
3
3
1
—
3
8
5
16
—
0
3
—
5
Rhode Island
—
0
6
5
2
—
1
62
4
8
—
0
2
—
—
Vermont
—
0
2
2
6
—
1
8
10
6
—
0
3
—
—
Mid. Atlantic
3
16
36
26
107
19
96
209
315
406
2
10
34
35
54
New Jersey
—
0
0
—
—
—
21
48
35
83
—
2
7
1
14
New York (Upstate)
3
7
20
26
33
12
25
67
83
73
2
3
13
8
11
New York City
—
0
3
—
2
2
19
42
91
110
—
2
6
9
10
Pennsylvania
—
8
21
—
72
5
31
114
106
140
—
3
16
17
19
E.N. Central
—
2
20
3
7
11
88
184
225
451
4
16
54
44
63
Illinois
—
0
6
—
3
—
27
80
53
155
—
4
14
5
10
Indiana
—
0
7
—
—
—
8
27
18
45
—
2
10
2
10
Michigan
—
1
6
2
3
3
15
42
59
82
3
3
19
29
14
Ohio
—
1
5
1
1
8
20
46
88
112
1
3
9
8
14
Wisconsin
N
0
0
N
N
—
11
46
7
57
—
3
21
—
15
W.N. Central
1
1
8
14
4
5
39
99
167
176
3
11
40
42
25
Iowa
—
0
0
—
—
1
8
19
31
42
—
2
15
6
6
Kansas
—
1
4
7
1
—
8
27
43
34
—
2
8
4
5
Minnesota
—
0
0
—
—
—
0
0
—
—
—
0
0
—
—
Missouri
1
0
4
3
—
3
15
42
68
72
2
5
32
20
7
Nebraska
—
0
3
—
3
1
4
13
15
16
1
1
8
7
7
North Dakota
—
0
4
4
—
—
0
15
—
—
—
0
4
—
—
South Dakota
—
0
0
—
—
—
3
10
10
12
—
1
4
5
—
S. Atlantic
14
18
48
118
213
115
276
740
1,168
1,104
4
12
31
68
57
Delaware
—
0
0
—
—
1
2
12
11
16
1
0
2
2
1
District of Columbia
—
0
0
—
—
—
1
6
—
5
—
0
1
1
1
Florida
4
0
13
19
120
59
107
203
498
419
3
3
9
29
9
Georgia
—
0
0
—
—
9
43
139
149
214
—
2
8
6
12
Maryland
—
6
13
32
27
11
19
46
89
84
—
1
4
3
10
North Carolina
—
0
0
—
—
22
34
251
235
158
—
2
26
15
16
South Carolina
N
0
0
N
N
5
27
71
89
99
—
0
4
3
—
Virginia
10
11
27
60
66
8
19
54
89
109
—
2
8
9
8
West Virginia
—
0
30
7
—
—
0
18
8
—
—
0
2
—
—
E.S. Central
—
3
11
9
15
10
64
190
235
273
—
4
18
21
16
Alabama
—
2
7
8
9
—
18
70
62
88
—
1
15
8
2
Kentucky
—
0
2
1
1
2
11
30
45
47
—
1
5
5
4
Mississippi
—
0
1
—
—
1
22
66
59
53
—
0
4
5
1
Tennessee
—
1
4
—
5
7
15
51
69
85
—
1
11
3
9
W.S. Central
2
1
21
61
—
6
133
250
256
332
—
10
56
16
19
Arkansas
2
0
10
11
—
2
13
52
29
47
—
1
6
3
1
Louisiana
—
0
0
—
—
—
14
44
67
59
—
0
1
—
—
Oklahoma
—
0
21
7
—
4
13
31
47
30
—
1
10
5
4
Texas
—
0
11
43
—
—
93
159
113
196
—
7
56
8
14
Mountain
—
1
4
14
—
14
45
93
184
296
1
11
27
20
29
Arizona
N
0
0
N
N
10
15
35
81
97
—
2
7
4
3
Colorado
—
0
0
—
—
—
9
23
28
69
—
3
9
2
12
Idaho
—
0
1
—
—
1
2
8
10
29
—
1
8
3
4
Montana
N
0
0
N
N
2
2
10
10
7
—
1
4
1
1
Nevada
—
0
3
—
—
1
3
7
11
22
1
0
7
2
2
New Mexico
—
0
4
14
—
—
5
22
20
35
—
1
3
3
4
Utah
—
0
2
—
—
—
6
15
20
33
—
1
7
2
3
Wyoming
—
0
0
—
—
—
1
9
4
4
—
0
7
3
—
Pacific
1
4
15
3
14
20
92
173
369
563
2
9
28
20
29
Alaska
1
0
2
3
6
1
1
6
8
9
—
0
1
—
—
California
—
3
13
—
5
—
71
141
273
431
—
4
14
6
18
Hawaii
—
0
0
—
—
—
6
14
12
49
—
0
2
—
—
Oregon
—
0
2
—
3
1
5
12
25
47
—
1
11
6
6
Washington
—
0
0
—
—
18
9
42
51
27
2
2
22
8
5
Territories
American Samoa
N
0
0
N
N
—
0
0
—
—
—
0
0
—
—
C.N.M.I.
—
—
—
—
—
—
—
—
—
—
—
—
—
—
—
Guam
—
0
0
—
—
—
0
2
—
3
—
0
0
—
—
Puerto Rico
—
0
6
13
4
1
3
12
6
24
—
0
0
—
—
U.S. Virgin Islands
—
0
0
—
—
—
0
0
—
—
—
0
0
—
—
C.N.M.I.: Commonwealth of Northern Mariana Islands.
U: Unavailable. —: No reported cases. N: Not reportable. NN: Not Nationally Notifiable. Cum: Cumulative year-to-date counts. Med: Median. Max: Maximum.
† Includes E. coli O157:H7; Shiga toxin-positive, serogroup non-O157; and Shiga toxin-positive, not serogrouped.
TABLE II. (Continued) Provisional cases of selected notifiable diseases, United States, weeks ending February 25, 2012, and February 26, 2011 (8th week)*
Reporting area
Shigellosis
Spotted Fever Rickettsiosis (including RMSF)†
Confirmed
Probable
Current week
Previous 52 weeks
Cum 2012
Cum 2011
Current week
Previous 52 weeks
Cum 2012
Cum 2011
Current week
Previous 52 weeks
Cum 2012
Cum 2011
Med
Max
Med
Max
Med
Max
United States
136
258
379
1,350
1,246
1
3
15
13
8
2
30
138
57
44
New England
—
4
21
13
28
—
0
1
—
—
—
0
1
—
1
Connecticut
—
1
4
5
6
—
0
0
—
—
—
0
0
—
—
Maine
—
0
8
—
1
—
0
0
—
—
—
0
1
—
—
Massachusetts
—
3
20
8
20
—
0
0
—
—
—
0
1
—
—
New Hampshire
—
0
1
—
—
—
0
1
—
—
—
0
1
—
—
Rhode Island
—
0
3
—
—
—
0
0
—
—
—
0
1
—
1
Vermont
—
0
1
—
1
—
0
0
—
—
—
0
0
—
—
Mid. Atlantic
34
25
86
219
83
—
0
2
3
—
1
1
8
8
2
New Jersey
—
6
39
49
19
—
0
0
—
—
—
0
0
—
—
New York (Upstate)
34
6
41
81
16
—
0
1
—
—
1
0
3
1
—
New York City
—
8
28
76
34
—
0
0
—
—
—
0
3
2
2
Pennsylvania
—
2
13
13
14
—
0
2
3
—
—
0
3
5
—
E.N. Central
11
15
41
172
108
—
0
2
1
—
—
2
10
3
4
Illinois
—
4
16
10
37
—
0
1
—
—
—
1
4
1
3
Indiana
—
1
6
5
11
—
0
1
1
—
—
1
5
1
—
Michigan
—
3
11
29
22
—
0
1
—
—
—
0
1
—
—
Ohio
11
6
27
128
38
—
0
2
—
—
—
0
2
1
1
Wisconsin
—
0
0
—
—
—
0
0
—
—
—
0
0
—
—
W.N. Central
—
5
18
48
67
—
0
4
—
—
1
4
24
4
8
Iowa
—
0
3
4
4
—
0
0
—
—
—
0
2
—
1
Kansas
—
1
6
26
14
—
0
0
—
—
—
0
0
—
—
Minnesota
—
0
0
—
—
—
0
0
—
—
—
0
0
—
—
Missouri
—
3
14
15
46
—
0
2
—
—
1
4
22
4
7
Nebraska
—
0
2
3
2
—
0
3
—
—
—
0
1
—
—
North Dakota
—
0
0
—
—
—
0
1
—
—
—
0
0
—
—
South Dakota
—
0
2
—
1
—
0
1
—
—
—
0
0
—
—
S. Atlantic
40
75
134
314
428
—
1
9
7
4
—
7
58
23
18
Delaware
—
0
2
—
—
—
0
1
—
—
—
0
4
2
1
District of Columbia
—
0
5
1
5
—
0
1
—
—
—
0
1
—
—
Florida
30
50
98
183
265
—
0
1
—
1
—
0
2
4
1
Georgia
5
13
26
79
76
—
1
8
7
1
—
0
0
—
—
Maryland
2
2
10
22
18
—
0
1
—
1
—
0
3
2
1
North Carolina
2
3
19
16
41
—
0
4
—
1
—
0
49
5
9
South Carolina
—
1
54
3
10
—
0
2
—
—
—
0
2
—
1
Virginia
1
2
7
10
13
—
0
1
—
—
—
3
14
10
5
West Virginia
—
0
2
—
—
—
0
0
—
—
—
0
1
—
—
E.S. Central
11
20
51
220
74
1
0
2
1
—
—
4
25
8
6
Alabama
—
6
21
49
33
—
0
1
—
—
—
1
8
3
3
Kentucky
7
5
22
102
7
—
0
1
—
—
—
0
2
—
—
Mississippi
2
4
24
46
13
—
0
0
—
—
—
0
2
—
1
Tennessee
2
4
11
23
21
1
0
2
1
—
—
4
20
5
2
W.S. Central
36
54
134
238
173
—
0
3
—
—
—
2
52
5
1
Arkansas
—
2
7
10
4
—
0
3
—
—
—
2
52
4
—
Louisiana
—
4
21
21
25
—
0
0
—
—
—
0
2
1
—
Oklahoma
26
4
28
64
11
—
0
1
—
—
—
0
25
—
—
Texas
10
43
104
143
133
—
0
1
—
—
—
0
4
—
1
Mountain
3
13
41
43
110
—
0
3
—
4
—
1
7
5
4
Arizona
3
6
27
28
40
—
0
3
—
4
—
0
6
1
4
Colorado
—
1
8
2
16
—
0
0
—
—
—
0
1
—
—
Idaho
—
0
3
2
5
—
0
0
—
—
—
0
2
2
—
Montana
—
1
15
3
10
—
0
0
—
—
—
0
1
—
—
Nevada
—
0
4
1
6
—
0
0
—
—
—
0
1
—
—
New Mexico
—
2
6
6
27
—
0
0
—
—
—
0
0
—
—
Utah
—
1
4
1
6
—
0
0
—
—
—
0
1
2
—
Wyoming
—
0
1
—
—
—
0
0
—
—
—
0
2
—
—
Pacific
1
19
44
83
175
—
0
2
1
—
—
0
1
1
—
Alaska
—
0
2
2
1
N
0
0
N
N
N
0
0
N
N
California
—
15
41
68
147
—
0
2
1
—
—
0
1
1
—
Hawaii
—
1
3
1
14
N
0
0
N
N
N
0
0
N
N
Oregon
—
1
4
8
9
—
0
0
—
—
—
0
0
—
—
Washington
1
1
11
4
4
—
0
0
—
—
—
0
0
—
—
Territories
American Samoa
—
0
0
—
1
N
0
0
N
N
N
0
0
N
N
C.N.M.I.
—
—
—
—
—
—
—
—
—
—
—
—
—
—
—
Guam
—
0
1
—
—
N
0
0
N
N
N
0
0
N
N
Puerto Rico
—
0
0
—
—
N
0
0
N
N
N
0
0
N
N
U.S. Virgin Islands
—
0
0
—
—
—
0
0
—
—
—
0
0
—
—
C.N.M.I.: Commonwealth of Northern Mariana Islands.
U: Unavailable. —: No reported cases. N: Not reportable. NN: Not Nationally Notifiable. Cum: Cumulative year-to-date counts. Med: Median. Max: Maximum.
† Illnesses with similar clinical presentation that result from Spotted fever group rickettsia infections are reported as Spotted fever rickettsioses. Rocky Mountain spotted fever (RMSF) caused by Rickettsia rickettsii, is the most common and well-known spotted fever.
TABLE II. (Continued) Provisional cases of selected notifiable diseases, United States, weeks ending February 25, 2012, and February 26, 2011 (8th week)*
Reporting area
Streptococcus pneumoniae,† invasive disease
Syphilis, primary and secondary
All ages
Age <5
Current week
Previous 52 weeks
Cum 2012
Cum 2011
Current week
Previous 52 weeks
Cum 2012
Cum 2011
Current week
Previous 52 weeks
Cum 2012
Cum 2011
Med
Max
Med
Max
Med
Max
United States
199
261
506
2,251
3,208
15
21
43
160
188
56
267
305
1,283
1,988
New England
—
12
31
85
176
—
1
4
6
7
8
7
23
45
59
Connecticut
—
6
20
45
82
—
0
3
2
1
—
0
12
—
6
Maine
—
2
8
17
27
—
0
1
1
1
—
0
2
—
2
Massachusetts
—
0
3
5
7
—
0
2
2
3
2
5
10
30
37
New Hampshire
—
1
8
10
23
—
0
1
1
—
—
0
3
4
3
Rhode Island
—
1
5
—
31
—
0
1
—
1
6
0
7
11
9
Vermont
—
1
6
8
6
—
0
2
—
1
—
0
2
—
2
Mid. Atlantic
33
29
62
349
363
—
2
11
19
18
7
29
48
145
242
New Jersey
—
13
29
75
179
—
1
4
8
10
—
4
11
5
30
New York (Upstate)
31
2
33
179
15
—
1
10
8
8
1
4
9
15
20
New York City
2
12
23
95
169
—
0
9
3
—
1
14
24
62
140
Pennsylvania
N
0
0
N
N
N
0
0
N
N
5
7
17
63
52
E.N. Central
39
63
122
471
626
6
3
10
27
32
1
31
48
87
254
Illinois
N
0
0
N
N
—
0
0
—
—
—
13
24
30
100
Indiana
1
13
36
67
156
—
1
4
3
6
1
3
8
24
28
Michigan
4
14
26
106
122
1
1
2
7
9
—
5
12
9
41
Ohio
34
27
43
235
258
5
1
7
12
13
—
7
17
22
74
Wisconsin
—
8
23
63
90
—
0
2
5
4
—
1
6
2
11
W.N. Central
1
3
28
30
32
—
0
2
1
2
—
6
13
3
64
Iowa
N
0
0
N
N
N
0
0
N
N
—
0
3
2
3
Kansas
N
0
0
N
N
N
0
0
N
N
—
0
4
—
2
Minnesota
—
0
0
—
—
—
0
0
—
—
—
2
8
—
30
Missouri
N
0
0
N
N
—
0
0
—
—
—
2
8
—
26
Nebraska
1
2
5
30
32
—
0
2
1
2
—
0
2
1
3
North Dakota
—
0
25
—
—
—
0
1
—
—
—
0
1
—
—
South Dakota
N
0
0
N
N
—
0
0
—
—
—
0
0
—
—
S. Atlantic
63
65
143
616
926
3
6
15
49
56
28
67
85
408
475
Delaware
1
0
5
7
19
—
0
0
—
—
—
0
4
7
3
District of Columbia
—
0
5
1
13
—
0
1
1
1
1
3
8
29
34
Florida
23
21
55
223
384
2
2
8
17
27
2
24
36
139
189
Georgia
17
19
38
191
251
1
1
6
18
18
7
12
42
67
51
Maryland
10
9
29
65
140
—
1
3
3
7
4
8
20
34
53
North Carolina
N
0
0
N
N
N
0
0
N
N
11
8
21
66
67
South Carolina
12
8
22
91
119
—
0
3
4
3
1
4
11
36
46
Virginia
N
0
0
N
N
—
0
0
—
—
2
4
13
30
32
West Virginia
—
1
48
38
—
—
0
4
6
—
—
0
2
—
—
E.S. Central
16
23
45
198
276
—
2
4
9
19
8
15
31
70
109
Alabama
N
0
0
N
N
N
0
0
N
N
—
4
10
16
37
Kentucky
4
4
12
41
48
—
0
3
—
5
3
2
8
13
17
Mississippi
N
0
0
N
N
—
0
0
—
—
5
3
22
25
19
Tennessee
12
19
42
157
228
—
1
4
9
14
—
5
11
16
36
W.S. Central
28
31
139
254
350
4
3
10
24
24
2
38
51
244
237
Arkansas
5
4
14
37
49
3
0
3
5
5
1
4
15
47
24
Louisiana
1
2
14
33
62
—
0
2
2
3
—
7
25
17
40
Oklahoma
N
0
0
N
N
—
0
0
—
—
1
1
6
7
7
Texas
22
24
125
184
239
1
3
10
17
16
—
23
39
173
166
Mountain
19
26
72
231
422
2
2
8
18
28
1
12
20
29
98
Arizona
15
12
45
158
221
2
1
5
12
12
—
5
11
8
32
Colorado
—
8
23
31
95
—
0
4
2
4
—
2
6
9
21
Idaho
N
0
0
N
N
—
0
0
—
—
1
0
4
3
3
Montana
N
0
0
N
N
N
0
0
N
N
—
0
1
—
4
Nevada
N
0
0
N
N
N
0
0
N
N
—
2
9
2
24
New Mexico
4
4
12
38
58
—
0
2
4
4
—
1
4
4
10
Utah
—
1
7
—
43
—
0
1
—
8
—
0
2
3
4
Wyoming
—
0
3
4
5
—
0
0
—
—
—
0
0
—
—
Pacific
—
2
9
17
37
—
0
2
7
2
1
55
74
252
450
Alaska
—
2
9
17
36
—
0
2
7
2
—
0
2
2
—
California
N
0
0
N
N
N
0
0
N
N
—
45
62
203
361
Hawaii
—
0
1
—
1
—
0
1
—
—
—
0
3
—
—
Oregon
N
0
0
N
N
N
0
0
N
N
—
4
14
24
29
Washington
N
0
0
N
N
N
0
0
N
N
1
5
12
23
60
Territories
American Samoa
N
0
0
N
N
—
0
0
—
—
—
0
0
—
—
C.N.M.I.
—
—
—
—
—
—
—
—
—
—
—
—
—
—
—
Guam
—
0
0
—
—
—
0
0
—
—
—
0
0
—
—
Puerto Rico
—
0
0
—
—
—
0
0
—
—
5
5
15
33
30
U.S. Virgin Islands
—
0
0
—
—
—
0
0
—
—
—
0
0
—
—
C.N.M.I.: Commonwealth of Northern Mariana Islands.
U: Unavailable. —: No reported cases. N: Not reportable. NN: Not Nationally Notifiable. Cum: Cumulative year-to-date counts. Med: Median. Max: Maximum.
† Includes drug resistant and susceptible cases of invasive Streptococcus pneumoniae disease among children <5 years and among all ages. Case definition: Isolation of S. pneumoniae from a normally sterile body site (e.g., blood or cerebrospinal fluid).
TABLE II. (Continued) Provisional cases of selected notifiable diseases, United States, weeks ending February 25, 2012, and February 26, 2011 (8th week)*
Reporting area
Varicella (chickenpox)
West Nile virus disease†
Neuroinvasive
Nonneuroinvasive§
Current week
Previous 52 weeks
Cum 2012
Cum 2011
Current week
Previous 52 weeks
Cum 2012
Cum 2011
Current week
Previous 52 weeks
Cum 2012
Cum 2011
Med
Max
Med
Max
Med
Max
United States
175
290
399
1,687
2,136
—
0
62
—
1
—
0
32
—
—
New England
—
23
54
134
186
—
0
3
—
—
—
0
1
—
—
Connecticut
—
6
20
30
38
—
0
2
—
—
—
0
1
—
—
Maine
—
4
11
35
33
—
0
0
—
—
—
0
0
—
—
Massachusetts
—
9
18
47
67
—
0
2
—
—
—
0
1
—
—
New Hampshire
—
2
10
—
17
—
0
0
—
—
—
0
0
—
—
Rhode Island
—
0
6
1
8
—
0
1
—
—
—
0
0
—
—
Vermont
—
2
9
21
23
—
0
1
—
—
—
0
0
—
—
Mid. Atlantic
39
55
80
368
232
—
0
11
—
—
—
0
6
—
—
New Jersey
13
34
70
221
79
—
0
1
—
—
—
0
2
—
—
New York (Upstate)
N
0
0
N
N
—
0
5
—
—
—
0
4
—
—
New York City
—
0
0
—
—
—
0
4
—
—
—
0
1
—
—
Pennsylvania
26
20
42
147
153
—
0
2
—
—
—
0
1
—
—
E.N. Central
33
63
115
439
571
—
0
13
—
—
—
0
7
—
—
Illinois
—
18
38
100
124
—
0
6
—
—
—
0
5
—
—
Indiana
—
5
20
42
51
—
0
2
—
—
—
0
1
—
—
Michigan
14
18
45
136
195
—
0
7
—
—
—
0
2
—
—
Ohio
19
21
47
161
200
—
0
3
—
—
—
0
3
—
—
Wisconsin
—
0
1
—
1
—
0
1
—
—
—
0
1
—
—
W.N. Central
7
12
32
92
114
—
0
9
—
1
—
0
7
—
—
Iowa
N
0
0
N
N
—
0
2
—
—
—
0
2
—
—
Kansas
7
7
21
64
60
—
0
1
—
—
—
0
0
—
—
Minnesota
—
0
1
—
—
—
0
1
—
—
—
0
1
—
—
Missouri
—
3
18
22
48
—
0
2
—
1
—
0
2
—
—
Nebraska
—
0
2
3
1
—
0
4
—
—
—
0
3
—
—
North Dakota
—
0
7
—
1
—
0
1
—
—
—
0
1
—
—
South Dakota
—
1
6
3
4
—
0
0
—
—
—
0
1
—
—
S. Atlantic
21
35
66
188
290
—
0
11
—
—
—
0
6
—
—
Delaware
—
0
2
—
2
—
0
1
—
—
—
0
0
—
—
District of Columbia
—
0
2
—
4
—
0
3
—
—
—
0
3
—
—
Florida
15
16
38
115
145
—
0
4
—
—
—
0
2
—
—
Georgia
N
0
0
N
N
—
0
3
—
—
—
0
1
—
—
Maryland
N
0
0
N
N
—
0
5
—
—
—
0
3
—
—
North Carolina
N
0
0
N
N
—
0
1
—
—
—
0
0
—
—
South Carolina
—
0
9
—
—
—
0
0
—
—
—
0
0
—
—
Virginia
6
9
27
44
58
—
0
2
—
—
—
0
1
—
—
West Virginia
—
6
32
29
81
—
0
1
—
—
—
0
0
—
—
E.S. Central
4
5
15
34
45
—
0
11
—
—
—
0
5
—
—
Alabama
4
5
14
30
41
—
0
2
—
—
—
0
0
—
—
Kentucky
N
0
0
N
N
—
0
2
—
—
—
0
1
—
—
Mississippi
—
0
2
4
4
—
0
5
—
—
—
0
4
—
—
Tennessee
N
0
0
N
N
—
0
3
—
—
—
0
1
—
—
W.S. Central
49
56
158
326
315
—
0
4
—
—
—
0
3
—
—
Arkansas
—
4
26
9
44
—
0
1
—
—
—
0
0
—
—
Louisiana
—
2
6
9
14
—
0
1
—
—
—
0
2
—
—
Oklahoma
N
0
0
N
N
—
0
1
—
—
—
0
0
—
—
Texas
49
49
153
308
257
—
0
3
—
—
—
0
3
—
—
Mountain
20
21
68
93
342
—
0
11
—
—
—
0
5
—
—
Arizona
—
5
50
14
106
—
0
7
—
—
—
0
4
—
—
Colorado
16
6
32
38
98
—
0
2
—
—
—
0
2
—
—
Idaho
N
0
0
N
N
—
0
1
—
—
—
0
1
—
—
Montana
2
1
7
6
69
—
0
1
—
—
—
0
0
—
—
Nevada
N
0
0
N
N
—
0
4
—
—
—
0
2
—
—
New Mexico
2
1
8
17
10
—
0
1
—
—
—
0
0
—
—
Utah
—
3
26
16
57
—
0
1
—
—
—
0
1
—
—
Wyoming
—
0
1
2
2
—
0
1
—
—
—
0
1
—
—
Pacific
2
2
9
13
41
—
0
18
—
—
—
0
7
—
—
Alaska
2
1
4
7
17
—
0
0
—
—
—
0
0
—
—
California
—
0
4
3
14
—
0
18
—
—
—
0
7
—
—
Hawaii
—
0
4
3
10
—
0
0
—
—
—
0
0
—
—
Oregon
N
0
0
N
N
—
0
0
—
—
—
0
0
—
—
Washington
N
0
0
N
N
—
0
0
—
—
—
0
0
—
—
Territories
American Samoa
N
0
0
N
N
—
0
0
—
—
—
0
0
—
—
C.N.M.I.
—
—
—
—
—
—
—
—
—
—
—
—
—
—
—
Guam
—
2
4
—
3
—
0
0
—
—
—
0
0
—
—
Puerto Rico
6
2
10
22
34
—
0
0
—
—
—
0
0
—
—
U.S. Virgin Islands
—
0
0
—
—
—
0
0
—
—
—
0
0
—
—
C.N.M.I.: Commonwealth of Northern Mariana Islands.
U: Unavailable. —: No reported cases. N: Not reportable. NN: Not Nationally Notifiable. Cum: Cumulative year-to-date counts. Med: Median. Max: Maximum.
† Updated weekly from reports to the Division of Vector-Borne Infectious Diseases, National Center for Zoonotic, Vector-Borne, and Enteric Diseases (ArboNET Surveillance). Data for California serogroup, eastern equine, Powassan, St. Louis, and western equine diseases are available in Table I.
§ Not reportable in all states. Data from states where the condition is not reportable are excluded from this table, except starting in 2007 for the domestic arboviral diseases and influenza-associated pediatric mortality, and in 2003 for SARS-CoV. Reporting exceptions are available at http://www.cdc.gov/ncphi/disss/nndss/phs/infdis.htm.
TABLE III. Deaths in 122 U.S. cities,* week ending February 25, 2012 (8th week)
Reporting area
All causes, by age (years)
P&I† Total
Reporting area (Continued)
All causes, by age (years)
P&I† Total
All Ages
=65
45–64
25–44
1–24
<1
All Ages
=65
45–64
25–44
1–24
<1
New England
523
383
92
33
6
9
69
S. Atlantic
968
610
246
71
17
23
65
Boston, MA
118
70
29
12
2
5
13
Atlanta, GA
121
68
37
12
2
1
10
Bridgeport, CT
19
17
1
1
—
—
3
Baltimore, MD
155
88
42
17
5
3
14
Cambridge, MA
25
20
4
—
1
—
1
Charlotte, NC
196
134
48
5
4
5
7
Fall River, MA
19
16
2
—
1
—
5
Jacksonville, FL
6
5
—
1
—
—
1
Hartford, CT
56
41
11
4
—
—
6
Miami, FL
128
96
19
10
—
3
5
Lowell, MA
19
17
2
—
—
—
4
Norfolk, VA
50
35
11
4
—
—
4
Lynn, MA
5
3
1
1
—
—
—
Richmond, VA
48
29
16
1
1
1
1
New Bedford, MA
40
30
6
4
—
—
3
Savannah, GA
49
30
12
4
1
2
3
New Haven, CT
28
16
8
1
2
1
3
St. Petersburg, FL
54
28
16
6
2
2
6
Providence, RI
50
37
8
4
—
1
3
Tampa, FL
67
40
19
3
2
3
2
Somerville, MA
2
2
—
—
—
—
1
Washington, D.C.
81
46
24
8
—
3
11
Springfield, MA
33
26
7
—
—
—
5
Wilmington, DE
13
11
2
—
—
—
1
Waterbury, CT
30
24
5
1
—
—
4
E.S. Central
851
528
242
52
17
12
78
Worcester, MA
79
64
8
5
—
2
18
Birmingham, AL
169
107
41
13
5
3
13
Mid. Atlantic
1,768
1,246
395
84
27
16
94
Chattanooga, TN
78
48
29
1
—
—
4
Albany, NY
53
39
11
2
1
—
4
Knoxville, TN
122
81
29
8
3
1
10
Allentown, PA
21
19
2
—
—
—
2
Lexington, KY
41
29
12
—
—
—
3
Buffalo, NY
87
60
22
4
1
—
8
Memphis, TN
152
89
52
5
2
4
13
Camden, NJ
22
10
8
3
—
1
—
Mobile, AL
97
61
20
13
2
1
5
Elizabeth, NJ
9
7
2
—
—
—
—
Montgomery, AL
47
32
12
3
—
—
9
Erie, PA
50
37
8
3
2
—
3
Nashville, TN
145
81
47
9
5
3
21
Jersey City, NJ
26
19
3
2
2
—
2
W.S. Central
1,236
798
301
74
40
23
84
New York City, NY
878
622
201
40
11
4
38
Austin, TX
88
56
23
6
2
1
8
Newark, NJ
54
30
20
1
1
2
—
Baton Rouge, LA
65
41
12
6
4
2
2
Paterson, NJ
26
13
6
4
1
2
2
Corpus Christi, TX
64
41
18
3
—
2
2
Philadelphia, PA
162
103
42
12
3
2
11
Dallas, TX
208
108
72
19
5
4
11
Pittsburgh, PA§
42
34
8
—
—
—
2
El Paso, TX
100
78
16
3
1
2
1
Reading, PA
40
32
4
2
—
2
5
Fort Worth, TX
U
U
U
U
U
U
U
Rochester, NY
82
59
16
4
1
2
2
Houston, TX
116
63
19
11
17
6
5
Schenectady, NY
29
23
5
1
—
—
3
Little Rock, AR
81
54
22
1
2
2
5
Scranton, PA
32
29
3
—
—
—
4
New Orleans, LA
U
U
U
U
U
U
U
Syracuse, NY
97
72
18
4
2
1
4
San Antonio, TX
285
194
72
12
5
2
27
Trenton, NJ
27
14
10
2
1
—
—
Shreveport, LA
127
101
19
4
2
1
16
Utica, NY
17
14
3
—
—
—
1
Tulsa, OK
102
62
28
9
2
1
7
Yonkers, NY
14
10
3
—
1
—
3
Mountain
1,203
832
260
72
20
19
94
E.N. Central
2,074
1,410
480
109
40
35
158
Albuquerque, NM
121
86
30
3
2
—
16
Akron, OH
47
30
7
3
3
4
2
Boise, ID
57
38
14
3
—
2
6
Canton, OH
40
27
9
3
—
1
3
Colorado Springs, CO
92
69
18
4
1
—
4
Chicago, IL
234
149
54
21
8
2
20
Denver, CO
91
63
18
7
2
1
6
Cincinnati, OH
82
43
27
9
3
—
8
Las Vegas, NV
300
216
62
15
3
4
29
Cleveland, OH
295
215
70
6
2
2
12
Ogden, UT
34
24
5
3
2
—
4
Columbus, OH
270
181
58
18
1
12
20
Phoenix, AZ
182
108
55
11
5
3
9
Dayton, OH
117
80
28
5
2
2
12
Pueblo, CO
44
37
4
2
1
—
1
Detroit, MI
173
95
60
11
5
2
6
Salt Lake City, UT
134
85
28
13
2
6
9
Evansville, IN
54
38
13
3
—
—
4
Tucson, AZ
148
106
26
11
2
3
10
Fort Wayne, IN
72
54
15
2
1
—
8
Pacific
1,700
1,190
374
72
36
28
154
Gary, IN
14
10
2
1
1
—
2
Berkeley, CA
14
11
1
1
—
1
2
Grand Rapids, MI
49
37
9
—
2
1
8
Fresno, CA
134
92
31
5
2
4
12
Indianapolis, IN
193
128
51
5
4
5
14
Glendale, CA
45
37
7
—
1
—
7
Lansing, MI
43
32
5
3
3
—
1
Honolulu, HI
86
62
14
7
2
1
11
Milwaukee, WI
79
61
12
3
2
1
7
Long Beach, CA
62
40
19
2
1
—
3
Peoria, IL
54
38
12
2
2
—
7
Los Angeles, CA
247
164
54
14
7
8
27
Rockford, IL
59
41
10
8
—
—
7
Pasadena, CA
18
15
3
—
—
—
2
South Bend, IN
59
47
10
2
—
—
7
Portland, OR
97
67
25
3
—
2
8
Toledo, OH
75
54
16
3
—
2
2
Sacramento, CA
216
163
41
8
2
2
18
Youngstown, OH
65
50
12
1
1
1
8
San Diego, CA
159
112
30
10
5
2
11
W.N. Central
627
414
151
31
17
14
36
San Francisco, CA
114
81
25
6
1
1
12
Des Moines, IA
98
76
11
3
7
1
5
San Jose, CA
208
153
46
6
2
1
21
Duluth, MN
33
27
6
—
—
—
1
Santa Cruz, CA
36
26
7
1
2
—
2
Kansas City, KS
41
23
13
1
3
1
2
Seattle, WA
107
58
34
4
6
5
3
Kansas City, MO
62
43
12
2
3
2
5
Spokane, WA
67
57
7
—
2
1
7
Lincoln, NE
36
24
11
1
—
—
1
Tacoma, WA
90
52
30
5
3
—
8
Minneapolis, MN
74
42
23
4
1
4
8
Total¶
10,950
7,411
2,541
598
220
179
832
Omaha, NE
68
41
20
4
2
1
3
St. Louis, MO
57
29
22
5
—
1
—
St. Paul, MN
67
44
17
3
—
3
5
Wichita, KS
91
65
16
8
1
1
6
U: Unavailable. —: No reported cases.
* Mortality data in this table are voluntarily reported from 122 cities in the United States, most of which have populations of >100,000. A death is reported by the place of its occurrence and by the week that the death certificate was filed. Fetal deaths are not included.
† Pneumonia and influenza.
§ Because of changes in reporting methods in this Pennsylvania city, these numbers are partial counts for the current week. Complete counts will be available in 4 to 6 weeks.