Persons using assistive technology might not be able to fully access information in this file. For assistance, please send e-mail to: mmwrq@cdc.gov. Type 508 Accommodation and the title of the report in the subject line of e-mail.
Notifiable Diseases and Mortality Tables
Table I Summary of provisional cases of selected notifiable diseases, United States, cumulative, week ending March 12, 2011 (10th Week)
Figure I Selected notifiable disease reports, United States, comparison of provisional 4-week totals ending March 12, 2011, with historical data
Table II Provisional cases of selected notifiable diseases, United States, weeks ending March 12, 2011 and March 13, 2010 (10th Week)
Table III Deaths in 122 U.S. cities, week ending March 12, 2011 (10th Week)
TABLE I. Provisional cases of infrequently reported notifiable diseases (<1,000 cases reported during the preceding year) --- United States, week ending March 12, 2011 (10th week)*
IL (1), PA (1), FL (1), NC (1), OK (1), TX (4), OR (1), CA (1)
Listeriosis
6
70
10
764
851
759
808
884
FL (1), TX (1), CA (4)
Measles§§
---
21
1
34
71
140
43
55
Meningococcal disease, invasive¶¶:
A, C, Y, and W-135
1
26
10
248
301
330
325
318
OK (1)
serogroup B
---
16
5
115
174
188
167
193
other serogroup
---
1
1
10
23
38
35
32
unknown serogroup
6
66
15
415
482
616
550
651
NY (1), PA (1), OH (1), FL (1), OR (1), HI (1)
Novel influenza A virus infections***
---
1
0
4
43,774
2
4
NN
Plague
---
---
0
2
8
3
7
17
Poliomyelitis, paralytic
---
---
---
---
1
---
---
---
Polio virus Infection, nonparalytic§
---
---
---
---
---
---
---
NN
Psittacosis§
---
1
0
4
9
8
12
21
Q fever, total§
1
10
3
116
113
120
171
169
acute
---
6
1
92
93
106
---
---
chronic
1
4
0
24
20
14
---
---
MO (1)
Rabies, human
---
---
---
1
4
2
1
3
Rubella†††
---
1
0
5
3
16
12
11
Rubella, congenital syndrome
---
---
---
---
2
---
---
1
SARS-CoV§
---
---
---
---
---
---
---
---
Smallpox§
---
---
---
---
---
---
---
---
Streptococcal toxic-shock syndrome§
1
23
5
168
161
157
132
125
NC (1)
Syphilis, congenital (age <1 yr)§§§
---
17
7
262
423
431
430
349
Tetanus
---
---
0
11
18
19
28
41
Toxic-shock syndrome (staphylococcal)§
---
12
2
75
74
71
92
101
Trichinellosis
---
3
0
6
13
39
5
15
Tularemia
---
1
0
112
93
123
137
95
Typhoid fever
5
46
7
417
397
449
434
353
MD (2), AZ (1), CA (2)
Vancomycin-intermediate Staphylococcus aureus§
1
10
1
100
78
63
37
6
NY (1)
Vancomycin-resistant Staphylococcus aureus§
---
---
0
1
1
---
2
1
Vibriosis (noncholera Vibrio species infections)§
---
30
3
783
789
588
549
NN
Viral hemorrhagic fever¶¶¶
---
---
---
1
NN
NN
NN
NN
Yellow fever
---
---
---
---
---
---
---
---
See Table 1 footnotes on next page.
TABLE I. (Continued) Provisional cases of infrequently reported notifiable diseases (<1,000 cases reported during the preceding year) --- United States, week ending March 12, 2011 (10th week)*
---: No reported cases. N: Not reportable. NN: Not Nationally Notifiable. Cum: Cumulative year-to-date counts.
† Calculated by summing the incidence counts for the current week, the 2 weeks preceding the current week, and the 2 weeks following the current week, for a total of 5 preceding years. Additional information is available at http://www.cdc.gov/ncphi/disss/nndss/phs/files/5yearweeklyaverage.pdf.
§ Not reportable in all states. Data from states where the condition is not reportable are excluded from this table except starting in 2007 for the arboviral diseases, STD data, TB data, and influenza-associated pediatric mortality, and in 2003 for SARS-CoV. Reporting exceptions are available at http://www.cdc.gov/ncphi/disss/nndss/phs/infdis.htm.
¶ Includes both neuroinvasive and nonneuroinvasive. Updated weekly from reports to the Division of Vector-Borne Infectious Diseases, National Center for Zoonotic, Vector-Borne, and Enteric Diseases (ArboNET Surveillance). Data for West Nile virus are available in Table II.
** Data for H. influenzae (all ages, all serotypes) are available in Table II.
†† Updated weekly from reports to the Influenza Division, National Center for Immunization and Respiratory Diseases. Since October 3, 2010, 71 influenza-associated pediatric deaths occurring during the 2010-11 influenza season have been reported.
§§ No measles cases were reported for the current week.
¶¶ Data for meningococcal disease (all serogroups) are available in Table II.
*** CDC discontinued reporting of individual confirmed and probable cases of 2009 pandemic influenza A (H1N1) virus infections on July 24, 2009. During 2009, four cases of human infection with novel influenza A viruses, different from the 2009 pandemic influenza A (H1N1) strain, were reported to CDC. The four cases of novel influenza A virus infection reported to CDC during 2010 and the one case reported in 2011 were identified as swine influenza A (H3N2) virus and are unrelated to the 2009 pandemic influenza A (H1N1) virus. Total case counts for 2009 were provided by the Influenza Division, National Center for Immunization and Respiratory Diseases (NCIRD).
††† No rubella cases were reported for the current week.
§§§ Updated weekly from reports to the Division of STD Prevention, National Center for HIV/AIDS, Viral Hepatitis, STD, and TB Prevention.
¶¶¶ There was one case of viral hemorrhagic fever reported during week 12 of 2010. The one case report was confirmed as lassa fever. See Table II for dengue hemorrhagic fever.
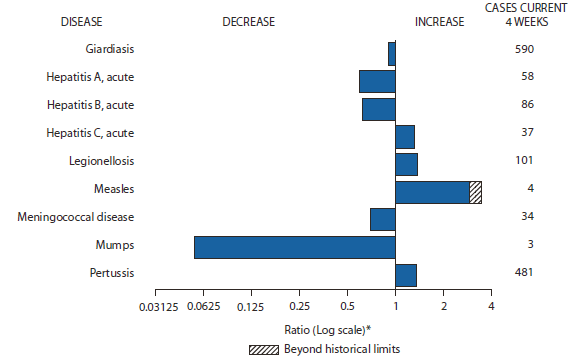
FIGURE I. Selected notifiable disease reports, United States, comparison of provisional 4-week totals March 12, 2011, with historical data
* Ratio of current 4-week total to mean of 15 4-week totals (from previous, comparable, and subsequent 4-week periods for the past 5 years). The point where the hatched area begins is based on the mean and two standard deviations of these 4-week totals.
Alternate Text: The figure above shows selected notifiable disease reports in the United States, with comparison of provisional 4-week totals through March 12, 2011, with historical data. Reports of acute hepatitis C, legionellosis, measles, and pertussis all increased, with measles increasing beyond historical limits. Reports of giardiasis, acute hepatitis A, acute hepatitis B, meningococcal disease, and mumps all decreased.
TABLE II. Provisional cases of selected notifiable diseases, United States, weeks ending March 12, 2011, and March 13, 2010 (10th week)*
Reporting area
Chlamydia trachomatis infection
Coccidioidomycosis
Cryptosporidiosis
Current week
Previous 52 weeks
Cum 2011
Cum 2010
Current week
Previous 52 weeks
Cum 2011
Cum 2010
Current week
Previous 52 weeks
Cum 2011
Cum 2010
Med
Max
Med
Max
Med
Max
United States
14,855
24,171
27,006
216,665
239,244
68
0
403
1,874
NN
62
118
352
658
1,023
New England
1,591
803
2,046
7,528
6,849
---
0
0
---
NN
---
7
19
32
122
Connecticut
474
171
1,558
796
1,331
N
0
0
N
NN
---
0
8
8
71
Maine†
52
54
100
578
492
N
0
0
N
NN
---
1
7
1
10
Massachusetts
890
402
694
4,296
3,814
N
0
0
N
NN
---
3
9
16
20
New Hampshire
40
52
113
589
355
---
0
0
---
NN
---
1
5
3
9
Rhode Island†
121
69
154
983
626
---
0
0
---
NN
---
0
2
1
4
Vermont†
14
23
84
286
231
N
0
0
N
NN
---
1
5
3
8
Mid. Atlantic
1,822
3,361
5,197
29,354
31,219
---
0
0
---
NN
11
15
38
98
86
New Jersey
479
514
701
4,921
5,000
N
0
0
N
NN
---
0
4
---
4
New York (Upstate)
687
706
2,028
6,332
5,169
N
0
0
N
NN
5
4
13
29
10
New York City
---
1,212
2,772
8,672
12,150
N
0
0
N
NN
---
2
6
10
8
Pennsylvania
656
954
1,189
9,429
8,900
N
0
0
N
NN
6
8
26
59
64
E.N. Central
945
3,653
4,381
29,729
37,418
---
0
3
5
NN
5
29
130
155
260
Illinois
22
900
1,046
5,802
10,093
N
0
0
N
NN
---
3
21
5
43
Indiana
---
400
1,042
3,182
2,593
N
0
0
N
NN
---
4
10
22
41
Michigan
600
941
1,370
9,082
10,360
---
0
1
1
NN
1
5
18
32
56
Ohio
130
997
1,131
7,829
9,955
---
0
3
4
NN
2
8
24
62
53
Wisconsin
193
425
518
3,834
4,417
N
0
0
N
NN
2
9
65
34
67
W.N. Central
310
1,366
1,600
10,894
14,225
---
0
0
---
NN
4
19
83
54
128
Iowa
18
200
237
1,734
2,149
N
0
0
N
NN
---
4
24
6
33
Kansas
41
183
286
1,687
1,927
N
0
0
N
NN
2
2
9
11
12
Minnesota
---
291
354
1,450
3,050
---
0
0
---
NN
---
0
16
---
35
Missouri
136
505
619
4,243
5,039
---
0
0
---
NN
2
4
30
18
23
Nebraska†
96
92
185
985
1,027
N
0
0
N
NN
---
3
26
18
15
North Dakota
---
40
88
188
407
N
0
0
N
NN
---
0
9
---
---
South Dakota
19
61
91
607
626
N
0
0
N
NN
---
1
6
1
10
S. Atlantic
3,037
4,782
5,792
45,676
47,849
---
0
0
---
NN
19
19
39
153
158
Delaware
117
84
220
850
809
---
0
0
---
NN
---
0
1
2
1
District of Columbia
35
98
161
772
933
---
0
0
---
NN
---
0
1
2
1
Florida
573
1,459
1,705
13,067
14,053
N
0
0
N
NN
3
7
19
50
63
Georgia
280
661
1,020
5,945
7,138
N
0
0
N
NN
3
5
11
41
52
Maryland†
---
489
1,101
2,908
3,858
---
0
0
---
NN
---
1
3
9
7
North Carolina
1,099
750
1,436
9,376
9,609
N
0
0
N
NN
12
0
12
21
13
South Carolina†
---
530
847
4,415
5,068
N
0
0
N
NN
---
2
8
22
6
Virginia†
815
649
970
7,446
5,714
N
0
0
N
NN
1
2
8
6
11
West Virginia
118
75
124
897
667
N
0
0
N
NN
---
0
3
---
4
E.S. Central
853
1,769
2,413
14,969
16,202
---
0
0
---
NN
4
4
19
17
38
Alabama†
---
538
780
4,049
4,565
N
0
0
N
NN
---
2
13
5
11
Kentucky
---
266
614
1,725
2,391
N
0
0
N
NN
1
1
6
7
12
Mississippi
612
384
780
3,964
3,820
N
0
0
N
NN
---
0
2
---
4
Tennessee†
241
581
799
5,231
5,426
N
0
0
N
NN
3
1
5
5
11
W.S. Central
1,926
3,096
4,243
29,995
33,794
---
0
1
1
NN
2
7
30
23
46
Arkansas†
439
275
436
3,018
2,114
N
0
0
N
NN
1
0
3
2
9
Louisiana
257
373
757
3,645
5,555
---
0
1
1
NN
1
1
6
4
9
Oklahoma
---
258
1,374
1,686
2,313
N
0
0
N
NN
---
1
8
---
6
Texas†
1,230
2,297
3,112
21,646
23,812
N
0
0
N
NN
---
5
23
17
22
Mountain
779
1,431
1,918
12,887
14,656
47
0
326
1,489
NN
7
10
30
71
92
Arizona
---
479
706
2,205
4,849
47
0
321
1,459
NN
---
1
3
4
5
Colorado
641
339
684
4,908
3,912
N
0
0
N
NN
4
3
6
26
20
Idaho†
69
66
199
567
862
N
0
0
N
NN
1
2
7
9
19
Montana†
---
63
81
585
548
N
0
0
N
NN
1
1
4
7
12
Nevada†
---
175
372
1,867
1,705
---
0
4
15
NN
---
0
7
2
2
New Mexico†
---
162
386
1,249
1,113
---
0
4
11
NN
1
2
12
15
17
Utah
54
122
157
1,177
1,264
---
0
2
2
NN
---
1
5
6
11
Wyoming†
15
38
90
329
403
---
0
2
2
NN
---
0
2
2
6
Pacific
3,592
3,762
5,414
35,633
37,032
21
0
77
379
NN
10
11
25
55
93
Alaska
---
112
156
1,035
1,162
N
0
0
N
NN
---
0
3
3
2
California
3,103
2,927
4,739
28,479
27,949
21
0
77
379
NN
5
6
16
27
52
Hawaii
---
107
158
726
1,219
N
0
0
N
NN
---
0
0
---
1
Oregon
190
212
496
2,257
2,595
N
0
0
N
NN
5
3
13
24
28
Washington
299
398
505
3,136
4,107
N
0
0
N
NN
---
1
7
1
10
Territories
American Samoa
---
0
0
---
---
N
0
0
N
NN
N
0
0
N
NN
C.N.M.I.
---
---
---
---
---
---
---
---
---
NN
---
---
---
---
---
Guam
---
9
31
71
4
---
0
0
---
NN
---
0
0
---
---
Puerto Rico
112
102
252
1,081
1,093
N
0
0
N
NN
N
0
0
N
NN
U.S. Virgin Islands
---
12
29
---
108
---
0
0
---
NN
---
0
0
---
---
C.N.M.I.: Commonwealth of Northern Mariana Islands.
U: Unavailable. ---: No reported cases. N: Not reportable. NN: Not Nationally Notifiable. Cum: Cumulative year-to-date counts. Med: Median. Max: Maximum.
† Data for meningococcal disease, invasive caused by serogroups A, C, Y, and W-135; serogroup B; other serogroup; and unknown serogroup are available in Table I.
§ Contains data reported through the National Electronic Disease Surveillance System (NEDSS).
TABLE II. (Continued) Provisional cases of selected notifiable diseases, United States, weeks ending March 12, 2011, and March 13, 2010 (10th week)*
Reporting area
Rabies, animal
Salmonellosis
Shiga toxin-producing E. coli(STEC)†
Current week
Previous 52 weeks
Cum 2011
Cum 2010
Current week
Previous 52 weeks
Cum 2011
Cum 2010
Current week
Previous 52 weeks
Cum 2011
Cum 2010
Med
Max
Med
Max
Med
Max
United States
24
62
143
237
522
274
917
1,756
3,965
5,554
32
92
216
427
428
New England
---
3
10
13
47
---
33
73
189
684
---
2
13
15
73
Connecticut
---
0
7
---
19
---
0
51
51
480
---
0
7
7
57
Maine§
---
1
3
4
15
---
3
8
22
13
---
0
3
1
---
Massachusetts
---
0
0
---
---
---
23
52
87
148
---
1
9
3
11
New Hampshire
---
0
5
1
3
---
3
12
14
22
---
0
2
4
5
Rhode Island§
---
0
4
2
1
---
2
18
9
16
---
0
1
---
---
Vermont§
---
1
3
6
9
---
2
5
6
5
---
0
2
---
---
Mid. Atlantic
1
18
41
41
159
26
95
218
393
629
2
9
32
51
39
New Jersey
---
0
0
---
---
---
16
57
35
120
---
1
9
7
7
New York (Upstate)
1
9
19
41
69
14
25
63
98
125
2
4
12
17
11
New York City
---
0
12
---
53
1
23
56
117
162
---
1
7
6
7
Pennsylvania
---
8
24
---
37
11
31
81
143
222
---
3
13
21
14
E.N. Central
---
2
27
7
6
18
91
253
362
639
1
13
44
62
64
Illinois
---
1
11
4
1
---
33
124
81
225
---
2
9
3
15
Indiana
---
0
0
---
---
---
13
62
32
71
---
2
10
12
5
Michigan
---
1
5
2
3
1
16
49
79
120
---
3
16
15
16
Ohio
---
0
12
1
2
17
24
47
140
157
1
3
11
21
7
Wisconsin
---
0
0
---
---
---
10
48
30
66
---
4
17
11
21
W.N. Central
2
4
36
7
29
13
45
97
212
282
3
11
39
31
49
Iowa
---
0
3
---
1
---
9
34
50
36
---
2
16
7
8
Kansas
1
1
4
3
12
---
7
18
34
47
---
1
5
6
5
Minnesota
---
0
34
---
8
---
0
32
---
69
---
0
7
---
14
Missouri
---
1
6
---
1
9
13
44
96
79
3
4
27
10
16
Nebraska§
1
1
4
4
7
4
4
13
20
27
---
1
6
8
4
North Dakota
---
0
3
---
---
---
0
13
---
2
---
0
10
---
---
South Dakota
---
0
0
---
---
---
2
17
12
22
---
0
4
---
2
S. Atlantic
15
20
38
142
230
122
262
612
1,269
1,533
16
15
33
131
64
Delaware
---
0
0
---
---
1
3
11
18
12
---
0
2
2
---
District of Columbia
---
0
0
---
---
---
1
6
4
12
---
0
1
1
1
Florida
---
0
9
16
96
44
108
226
511
700
10
5
23
59
23
Georgia
---
0
0
---
---
16
41
144
240
188
---
2
8
11
10
Maryland§
6
6
15
36
63
8
18
57
86
118
---
2
9
20
9
North Carolina
---
0
0
---
---
41
29
240
200
318
2
2
10
19
5
South Carolina§
---
0
0
---
---
4
25
99
95
86
3
0
2
3
1
Virginia§
9
12
25
90
59
8
20
68
115
78
1
2
8
16
15
West Virginia
---
1
7
---
12
---
1
13
---
21
---
0
3
---
---
E.S. Central
1
3
7
12
14
5
55
177
264
262
---
5
22
22
18
Alabama§
1
1
4
11
---
---
20
52
84
85
---
1
4
3
6
Kentucky
---
0
4
1
---
2
11
32
48
51
---
1
6
4
2
Mississippi
---
0
1
---
---
---
18
67
42
42
---
0
12
---
3
Tennessee§
---
1
4
---
14
3
17
53
90
84
---
2
7
15
7
W.S. Central
4
0
30
4
7
20
127
361
373
410
6
7
77
27
19
Arkansas§
1
0
7
1
5
2
12
43
57
27
1
0
5
3
4
Louisiana
---
0
0
---
---
---
20
49
59
103
---
0
2
---
3
Oklahoma
3
0
30
3
2
9
12
39
47
40
---
0
24
4
1
Texas§
---
0
0
---
---
9
80
310
210
240
5
5
53
20
11
Mountain
---
1
7
1
9
10
50
111
293
402
3
11
34
32
56
Arizona
---
0
0
---
---
---
15
42
90
139
1
1
13
9
13
Colorado
---
0
0
---
---
8
10
24
88
97
---
3
21
5
15
Idaho§
---
0
2
---
1
1
3
9
32
25
1
2
7
6
7
Montana§
---
0
3
1
---
---
1
5
6
21
1
1
5
2
4
Nevada§
---
0
2
---
---
---
5
22
21
24
---
0
5
2
1
New Mexico§
---
0
2
---
3
---
6
19
26
45
---
0
6
3
7
Utah
---
0
2
---
---
---
5
17
24
38
---
1
7
5
8
Wyoming§
---
0
4
---
5
1
1
8
6
13
---
0
3
---
1
Pacific
1
2
12
10
21
60
108
280
610
713
1
12
52
56
46
Alaska
---
0
2
6
7
---
1
4
9
18
---
0
1
---
1
California
---
0
12
---
10
46
75
207
450
529
1
6
32
42
29
Hawaii
---
0
0
---
---
5
6
14
59
50
---
0
4
---
9
Oregon
1
0
2
4
4
1
8
48
48
68
---
2
11
6
4
Washington
---
0
0
---
---
8
14
71
44
48
---
3
18
8
3
Territories
American Samoa
N
0
0
N
N
---
0
1
---
1
---
0
0
---
---
C.N.M.I.
---
---
---
---
---
---
---
---
---
---
---
---
---
---
---
Guam
---
0
0
---
---
---
0
3
3
---
---
0
0
---
---
Puerto Rico
1
1
3
6
13
1
8
21
11
108
---
0
0
---
---
U.S. Virgin Islands
---
0
0
---
---
---
0
0
---
---
---
0
0
---
---
C.N.M.I.: Commonwealth of Northern Mariana Islands.
U: Unavailable. ---: No reported cases. N: Not reportable. NN: Not Nationally Notifiable. Cum: Cumulative year-to-date counts. Med: Median. Max: Maximum.
† Illnesses with similar clinical presentation that result from Spotted fever group rickettsia infections are reported as Spotted fever rickettsioses. Rocky Mountain spotted fever (RMSF) caused by Rickettsia rickettsii, is the most common and well-known spotted fever.
§ Contains data reported through the National Electronic Disease Surveillance System (NEDSS).
TABLE II. (Continued) Provisional cases of selected notifiable diseases, United States, weeks ending March 12, 2011, and March 13, 2010 (10th week)*
Streptococcus pneumoniae,† invasive disease
Reporting area
All ages
Age <5
Syphilis, primary and secondary
Current week
Previous 52 weeks
Cum 2011
Cum 2010
Current week
Previous 52 weeks
Cum 2011
Cum 2010
Current week
Previous 52 weeks
Cum 2011
Cum 2010
Med
Max
Med
Max
Med
Max
United States
251
296
752
3,396
3,720
22
32
85
271
614
68
256
343
1,720
2,363
New England
2
9
99
48
112
---
1
14
4
22
3
9
20
64
79
Connecticut
---
0
91
---
---
---
0
12
---
---
1
1
8
7
16
Maine§
---
2
13
31
28
---
0
1
1
3
---
0
3
2
6
Massachusetts
---
1
5
6
23
---
0
3
2
16
2
5
15
40
49
New Hampshire
---
0
7
---
38
---
0
0
---
3
---
0
2
4
2
Rhode Island§
---
0
36
2
---
---
0
3
---
---
---
1
4
9
4
Vermont§
2
1
5
9
23
---
0
1
1
---
---
0
1
2
2
Mid. Atlantic
17
30
60
373
259
4
6
19
32
82
12
32
45
177
324
New Jersey
---
1
8
13
26
---
1
5
8
14
1
4
12
34
46
New York (Upstate)
2
3
11
17
41
2
1
9
10
32
5
2
18
29
12
New York City
4
14
33
189
84
---
1
14
---
19
---
16
31
48
194
Pennsylvania
11
12
22
154
108
2
1
5
14
17
6
7
16
66
72
E.N. Central
42
62
104
658
779
2
6
13
44
109
---
26
45
103
349
Illinois
---
2
6
13
35
---
1
4
13
30
---
7
26
15
171
Indiana
---
10
27
95
170
---
1
6
3
16
---
4
14
19
22
Michigan
9
13
29
129
159
---
1
4
8
27
---
4
9
20
60
Ohio
30
25
45
333
316
2
2
5
16
23
---
8
19
46
85
Wisconsin
3
7
19
88
99
---
0
4
4
13
---
1
3
3
11
W.N. Central
5
10
61
106
205
---
1
12
19
43
2
7
18
45
48
Iowa
---
0
0
---
---
---
0
0
---
---
---
0
3
1
2
Kansas
---
2
7
22
23
---
0
2
2
4
---
0
3
1
1
Minnesota
---
0
46
---
97
---
0
8
---
17
---
3
10
20
11
Missouri
1
2
10
48
36
---
0
4
15
14
2
2
9
23
33
Nebraska§
4
2
9
36
40
---
0
2
2
4
---
0
2
---
1
North Dakota
---
0
11
---
---
---
0
1
---
---
---
0
0
---
---
South Dakota
---
0
3
---
9
---
0
2
---
4
---
0
1
---
---
S. Atlantic
73
62
145
923
981
4
8
23
73
158
21
61
112
473
488
Delaware
---
1
4
21
7
---
0
1
---
---
1
0
4
4
1
District of Columbia
---
0
2
3
9
---
0
2
---
3
---
3
16
33
24
Florida
33
26
89
464
452
3
3
18
37
60
---
23
44
176
182
Georgia
6
11
21
115
178
---
2
6
12
51
3
11
67
46
57
Maryland§
13
9
32
157
127
1
1
6
8
11
---
7
16
66
31
North Carolina
---
0
0
---
---
---
0
0
---
---
7
5
19
69
109
South Carolina§
21
8
25
152
163
---
1
4
5
19
---
3
10
35
29
Virginia§
---
1
4
11
13
---
1
4
11
11
10
4
22
44
52
West Virginia
---
1
9
---
32
---
0
4
---
3
---
0
2
---
3
E.S. Central
25
25
48
308
344
---
2
7
17
34
5
16
39
90
160
Alabama§
---
0
0
---
---
---
0
0
---
---
---
4
11
27
55
Kentucky
3
4
16
46
25
---
0
3
5
2
---
2
12
18
20
Mississippi
---
1
8
4
24
---
0
2
---
5
5
4
16
21
28
Tennessee§
22
21
39
258
295
---
2
6
12
27
---
4
17
24
57
W.S. Central
42
35
327
386
398
10
4
26
40
68
16
37
68
273
346
Arkansas§
5
3
23
61
39
3
0
3
7
8
2
3
10
29
47
Louisiana
---
2
9
53
35
---
0
2
5
11
---
8
33
40
65
Oklahoma
3
1
4
9
16
3
1
4
9
16
---
2
6
7
13
Texas§
34
28
298
263
308
4
3
19
19
33
14
23
33
197
221
Mountain
40
35
76
515
568
2
4
11
38
84
1
10
26
61
79
Arizona
19
12
40
258
289
1
1
6
18
38
---
2
8
5
30
Colorado
16
11
23
131
137
---
1
4
5
17
---
2
8
20
26
Idaho§
---
0
2
3
4
---
0
2
2
1
1
0
2
3
1
Montana§
---
0
2
1
4
---
0
1
---
---
---
0
2
1
---
Nevada§
---
2
8
27
25
---
0
1
3
3
---
2
9
21
10
New Mexico§
3
3
13
63
49
1
0
2
5
11
---
1
4
6
6
Utah
---
3
8
25
57
---
0
3
5
14
---
1
5
5
6
Wyoming§
2
0
15
7
3
---
0
1
---
---
---
0
0
---
---
Pacific
5
5
24
79
74
---
0
5
4
14
8
53
78
434
490
Alaska
---
2
11
35
37
---
0
2
3
10
---
0
1
---
---
California
5
3
23
43
37
---
0
5
1
4
4
48
74
390
427
Hawaii
---
0
3
1
---
---
0
0
---
---
---
0
5
---
7
Oregon
---
0
0
---
---
---
0
0
---
---
1
1
7
17
12
Washington
---
0
0
---
---
---
0
0
---
---
3
4
11
27
44
Territories
American Samoa
---
0
0
---
---
---
0
0
---
---
---
0
0
---
---
C.N.M.I.
---
---
---
---
---
---
---
---
---
---
---
---
---
---
---
Guam
---
0
0
---
---
---
0
0
---
---
---
0
0
---
---
Puerto Rico
---
0
0
---
---
---
0
0
---
---
8
4
15
41
43
U.S. Virgin Islands
---
0
0
---
---
---
0
0
---
---
---
0
0
---
---
C.N.M.I.: Commonwealth of Northern Mariana Islands.
U: Unavailable. ---: No reported cases. N: Not reportable. NN: Not Nationally Notifiable. Cum: Cumulative year-to-date counts. Med: Median. Max: Maximum.
† Includes drug resistant and susceptible cases of invasive Streptococcus pneumoniae disease among children <5 years and among all ages. Case definition: Isolation of S. pneumoniae from a normally sterile body site (e.g., blood or cerebrospinal fluid).
§ Contains data reported through the National Electronic Disease Surveillance System (NEDSS).
TABLE II. (Continued) Provisional cases of selected notifiable diseases, United States, weeks ending March 12, 2011, and March 13, 2010 (10th week)*
West Nile virus disease†
Reporting area
Varicella (chickenpox)
Neuroinvasive
Nonneuroinvasive§
Current week
Previous 52 weeks
Cum 2011
Cum 2010
Current week
Previous 52 weeks
Cum 2011
Cum 2010
Current week
Previous 52 weeks
Cum 2011
Cum 2010
Med
Max
Med
Max
Med
Max
United States
188
258
567
2,052
3,182
---
1
71
---
1
---
1
53
---
---
New England
---
21
46
127
196
---
0
3
---
---
---
0
2
---
---
Connecticut
---
5
20
---
48
---
0
2
---
---
---
0
2
---
---
Maine¶
---
4
16
28
52
---
0
0
---
---
---
0
0
---
---
Massachusetts
---
5
16
58
48
---
0
2
---
---
---
0
1
---
---
New Hampshire
---
2
9
9
32
---
0
1
---
---
---
0
0
---
---
Rhode Island¶
---
1
4
6
2
---
0
0
---
---
---
0
0
---
---
Vermont¶
---
2
10
26
14
---
0
0
---
---
---
0
0
---
---
Mid. Atlantic
15
30
62
191
336
---
0
19
---
---
---
0
13
---
---
New Jersey
---
7
30
37
110
---
0
3
---
---
---
0
6
---
---
New York (Upstate)
N
0
0
N
N
---
0
9
---
---
---
0
7
---
---
New York City
---
0
0
---
1
---
0
7
---
---
---
0
4
---
---
Pennsylvania
15
20
41
154
225
---
0
3
---
---
---
0
3
---
---
E.N. Central
69
79
176
697
1,205
---
0
15
---
---
---
0
8
---
---
Illinois
4
18
45
136
309
---
0
10
---
---
---
0
5
---
---
Indiana¶
---
5
30
56
124
---
0
2
---
---
---
0
2
---
---
Michigan
19
27
62
224
379
---
0
6
---
---
---
0
1
---
---
Ohio
46
23
58
280
317
---
0
1
---
---
---
0
1
---
---
Wisconsin
---
6
22
1
76
---
0
0
---
---
---
0
1
---
---
W.N. Central
---
14
32
46
169
---
0
7
---
---
---
0
11
---
---
Iowa
N
0
0
N
N
---
0
1
---
---
---
0
2
---
---
Kansas¶
---
2
22
33
68
---
0
1
---
---
---
0
3
---
---
Minnesota
---
0
0
---
---
---
0
1
---
---
---
0
3
---
---
Missouri
---
7
23
10
90
---
0
1
---
---
---
0
0
---
---
Nebraska¶
N
0
0
N
N
---
0
3
---
---
---
0
7
---
---
North Dakota
---
0
10
---
7
---
0
2
---
---
---
0
2
---
---
South Dakota
---
1
7
3
4
---
0
2
---
---
---
0
3
---
---
S. Atlantic
40
33
100
256
398
---
0
5
---
---
---
0
4
---
---
Delaware¶
---
0
3
1
2
---
0
0
---
---
---
0
0
---
---
District of Columbia
---
0
4
2
1
---
0
1
---
---
---
0
1
---
---
Florida¶
38
16
57
200
201
---
0
3
---
---
---
0
1
---
---
Georgia
N
0
0
N
N
---
0
1
---
---
---
0
3
---
---
Maryland¶
N
0
0
N
N
---
0
3
---
---
---
0
2
---
---
North Carolina
N
0
0
N
N
---
0
0
---
---
---
0
0
---
---
South Carolina¶
---
0
13
---
44
---
0
1
---
---
---
0
0
---
---
Virginia¶
2
10
29
53
77
---
0
1
---
---
---
0
1
---
---
West Virginia
---
6
26
---
73
---
0
0
---
---
---
0
0
---
---
E.S. Central
---
6
22
54
46
---
0
1
---
1
---
0
3
---
---
Alabama¶
---
5
22
51
46
---
0
1
---
---
---
0
1
---
---
Kentucky
N
0
0
N
N
---
0
1
---
---
---
0
1
---
---
Mississippi
---
0
2
3
---
---
0
1
---
1
---
0
2
---
---
Tennessee¶
N
0
0
N
N
---
0
1
---
---
---
0
2
---
---
W.S. Central
54
43
186
392
515
---
0
16
---
---
---
0
3
---
---
Arkansas¶
---
3
32
20
26
---
0
3
---
---
---
0
1
---
---
Louisiana
---
2
4
13
18
---
0
3
---
---
---
0
1
---
---
Oklahoma
N
0
0
N
N
---
0
1
---
---
---
0
0
---
---
Texas¶
54
39
176
359
471
---
0
15
---
---
---
0
2
---
---
Mountain
10
18
49
241
302
---
0
18
---
---
---
0
15
---
---
Arizona
---
0
0
---
---
---
0
13
---
---
---
0
9
---
---
Colorado¶
10
7
31
107
99
---
0
5
---
---
---
0
11
---
---
Idaho¶
N
0
0
N
N
---
0
0
---
---
---
0
1
---
---
Montana¶
---
3
28
65
62
---
0
0
---
---
---
0
0
---
---
Nevada¶
N
0
0
N
N
---
0
0
---
---
---
0
1
---
---
New Mexico¶
---
1
8
9
20
---
0
6
---
---
---
0
2
---
---
Utah
---
4
19
60
119
---
0
1
---
---
---
0
1
---
---
Wyoming¶
---
0
3
---
2
---
0
1
---
---
---
0
1
---
---
Pacific
---
2
16
48
15
---
0
8
---
---
---
0
6
---
---
Alaska
---
1
5
16
4
---
0
0
---
---
---
0
0
---
---
California
---
0
13
23
2
---
0
8
---
---
---
0
6
---
---
Hawaii
---
1
4
9
9
---
0
0
---
---
---
0
0
---
---
Oregon
N
0
0
N
N
---
0
0
---
---
---
0
0
---
---
Washington
N
0
0
N
N
---
0
1
---
---
---
0
1
---
---
Territories
American Samoa
N
0
0
N
N
---
0
0
---
---
---
0
0
---
---
C.N.M.I.
---
---
---
---
---
---
---
---
---
---
---
---
---
---
---
Guam
---
0
2
1
1
---
0
0
---
---
---
0
0
---
---
Puerto Rico
2
8
30
37
77
---
0
0
---
---
---
0
0
---
---
U.S. Virgin Islands
---
0
0
---
---
---
0
0
---
---
---
0
0
---
---
C.N.M.I.: Commonwealth of Northern Mariana Islands.
U: Unavailable. ---: No reported cases. N: Not reportable. NN: Not Nationally Notifiable. Cum: Cumulative year-to-date counts. Med: Median. Max: Maximum.
† Updated weekly from reports to the Division of Vector-Borne Infectious Diseases, National Center for Zoonotic, Vector-Borne, and Enteric Diseases (ArboNET Surveillance). Data for California serogroup, eastern equine, Powassan, St. Louis, and western equine diseases are available in Table I.
§ Not reportable in all states. Data from states where the condition is not reportable are excluded from this table, except starting in 2007 for the domestic arboviral diseases and influenza-associated pediatric mortality, and in 2003 for SARS-CoV. Reporting exceptions are available at http://www.cdc.gov/ncphi/disss/nndss/phs/infdis.htm.
¶ Contains data reported through the National Electronic Disease Surveillance System (NEDSS).
TABLE III. Deaths in 122 U.S. cities,* week ending March 12, 2011 (10th week)
Reporting area
All causes, by age (years)
P&I† Total
Reporting area (Continued)
All causes, by age (years)
P&I† Total
All Ages
=65
45--64
25--44
1--24
<1
All Ages
=65
45--64
25--44
1--24
<1
New England
613
428
131
29
15
10
69
S. Atlantic
1,273
801
352
72
33
15
98
Boston, MA
150
85
43
13
8
1
17
Atlanta, GA
128
83
33
8
4
---
13
Bridgeport, CT
27
19
8
---
---
---
4
Baltimore, MD
173
108
50
10
4
1
17
Cambridge, MA
17
12
3
1
1
---
5
Charlotte, NC
151
100
38
7
2
4
19
Fall River, MA
34
27
4
1
2
---
2
Jacksonville, FL
174
118
45
7
2
2
4
Hartford, CT
69
50
13
4
2
---
10
Miami, FL
83
58
21
3
1
---
6
Lowell, MA
33
25
5
3
---
---
2
Norfolk, VA
64
38
19
2
2
3
---
Lynn, MA
10
8
1
1
---
---
1
Richmond, VA
60
29
26
3
2
---
5
New Bedford, MA
32
27
3
1
---
1
2
Savannah, GA
53
38
10
3
2
---
4
New Haven, CT
44
29
11
2
1
1
5
St. Petersburg, FL
51
29
15
4
3
---
4
Providence, RI
57
47
8
1
---
1
3
Tampa, FL
194
124
47
17
2
4
13
Somerville, MA
3
1
2
---
---
---
---
Washington, D.C.
126
65
45
7
8
1
10
Springfield, MA
45
32
9
1
---
3
5
Wilmington, DE
16
11
3
1
1
---
3
Waterbury, CT
18
14
3
---
1
---
1
E.S. Central
987
654
254
45
17
16
84
Worcester, MA
74
52
18
1
---
3
12
Birmingham, AL
176
122
42
8
2
1
12
Mid. Atlantic
1,980
1,392
422
110
31
24
131
Chattanooga, TN
96
73
12
3
3
5
4
Albany, NY
39
29
9
1
---
---
1
Knoxville, TN
137
87
39
6
4
1
18
Allentown, PA
29
18
8
2
1
---
2
Lexington, KY
80
50
24
5
1
---
6
Buffalo, NY
94
65
23
2
4
---
11
Memphis, TN
189
125
47
10
3
4
19
Camden, NJ
32
18
9
3
1
1
6
Mobile, AL
101
68
24
7
1
1
7
Elizabeth, NJ
23
15
7
1
---
---
3
Montgomery, AL
43
25
15
2
1
---
4
Erie, PA
55
46
4
5
---
---
7
Nashville, TN
165
104
51
4
2
4
14
Jersey City, NJ
15
11
4
---
---
---
3
W.S. Central
1,324
873
321
66
28
36
110
New York City, NY
1,106
770
231
70
17
17
56
Austin, TX
104
63
26
9
4
2
8
Newark, NJ
27
12
8
6
1
---
2
Baton Rouge, LA
67
44
11
5
5
2
---
Paterson, NJ
20
13
6
1
---
---
1
Corpus Christi, TX
62
42
19
1
---
---
10
Philadelphia, PA
146
83
43
12
5
3
6
Dallas, TX
200
123
60
8
4
5
12
Pittsburgh, PA§
53
37
14
2
---
---
6
El Paso, TX
144
101
25
12
6
---
2
Reading, PA
30
24
4
---
---
2
2
Fort Worth, TX
U
U
U
U
U
U
U
Rochester, NY
119
93
21
2
2
1
9
Houston, TX
69
43
13
2
2
9
15
Schenectady, NY
20
17
3
---
---
---
---
Little Rock, AR
102
65
27
4
2
4
1
Scranton, PA
31
30
1
---
---
---
3
New Orleans, LA
U
U
U
U
U
U
U
Syracuse, NY
76
64
12
---
---
---
12
San Antonio, TX
325
225
82
9
4
5
33
Trenton, NJ
29
21
8
---
---
---
---
Shreveport, LA
98
66
17
5
1
9
9
Utica, NY
18
11
4
3
---
---
---
Tulsa, OK
153
101
41
11
---
---
20
Yonkers, NY
18
15
3
---
---
---
1
Mountain
1,000
669
240
63
15
13
94
E.N. Central
2,298
1,551
546
124
46
31
209
Albuquerque, NM
166
114
39
9
3
1
28
Akron, OH
48
32
11
2
1
2
11
Boise, ID
47
38
7
2
---
---
8
Canton, OH
57
43
8
6
---
---
6
Colorado Springs, CO
80
52
21
3
2
2
3
Chicago, IL
230
138
64
18
10
---
20
Denver, CO
103
70
22
8
1
2
10
Cincinnati, OH
104
72
20
4
4
4
15
Las Vegas, NV
401
262
107
26
4
2
30
Cleveland, OH
307
233
54
12
4
4
28
Ogden, UT
39
30
7
2
---
---
4
Columbus, OH
307
188
82
23
8
6
39
Phoenix, AZ
U
U
U
U
U
U
U
Dayton, OH
146
102
38
4
1
1
11
Pueblo, CO
35
22
12
1
---
---
2
Detroit, MI
196
111
64
14
4
3
4
Salt Lake City, UT
129
81
25
12
5
6
9
Evansville, IN
51
38
11
2
---
---
4
Tucson, AZ
U
U
U
U
U
U
U
Fort Wayne, IN
70
51
16
3
---
---
4
Pacific
1,910
1,390
384
80
36
20
195
Gary, IN
11
5
5
1
---
---
---
Berkeley, CA
15
12
2
1
---
---
---
Grand Rapids, MI
48
30
14
3
---
1
8
Fresno, CA
141
106
29
4
1
1
18
Indianapolis, IN
210
136
58
7
8
1
27
Glendale, CA
42
36
6
---
---
---
9
Lansing, MI
56
39
10
3
3
1
4
Honolulu, HI
57
40
15
---
1
1
9
Milwaukee, WI
84
58
18
5
---
3
9
Long Beach, CA
62
43
16
2
---
1
5
Peoria, IL
60
38
15
5
1
1
3
Los Angeles, CA
285
184
71
16
10
4
31
Rockford, IL
45
35
8
1
1
---
4
Pasadena, CA
23
15
6
2
---
---
2
South Bend, IN
72
53
14
4
---
1
3
Portland, OR
147
104
35
3
4
1
11
Toledo, OH
138
99
30
6
1
2
7
Sacramento, CA
230
181
30
11
6
2
22
Youngstown, OH
58
50
6
1
---
1
2
San Diego, CA
213
156
40
12
2
3
22
W.N. Central
628
372
160
60
18
17
48
San Francisco, CA
136
96
32
3
4
1
20
Des Moines, IA
47
33
10
4
---
---
4
San Jose, CA
203
160
32
6
3
2
19
Duluth, MN
23
16
5
---
1
1
3
Santa Cruz, CA
37
31
6
---
---
---
7
Kansas City, KS
36
21
10
4
1
---
3
Seattle, WA
121
85
28
3
3
2
9
Kansas City, MO
102
62
32
3
1
4
12
Spokane, WA
52
39
11
2
---
---
4
Lincoln, NE
39
25
9
5
---
---
2
Tacoma, WA
146
102
25
15
2
2
7
Minneapolis, MN
78
45
19
5
3
6
5
Total¶
12,013
8,130
2,810
649
239
182
1,038
Omaha, NE
91
51
24
13
1
2
12
St. Louis, MO
75
23
25
15
8
3
1
St. Paul, MN
63
48
7
5
2
1
3
Wichita, KS
74
48
19
6
1
---
3
U: Unavailable. ---: No reported cases.
* Mortality data in this table are voluntarily reported from 122 cities in the United States, most of which have populations of >100,000. A death is reported by the place of its occurrence and by the week that the death certificate was filed. Fetal deaths are not included.
† Pneumonia and influenza.
§ Because of changes in reporting methods in this Pennsylvania city, these numbers are partial counts for the current week. Complete counts will be available in 4 to 6 weeks.