|
Persons using assistive technology might not be able to fully access information in this file. For assistance, please send e-mail to: mmwrq@cdc.gov. Type 508 Accommodation and the title of the report in the subject line of e-mail. Arthritis as a Potential Barrier to Physical Activity Among Adults with Obesity --- United States, 2007 and 2009Adults with obesity are less likely than adults without obesity to follow physical activity recommendations, despite the known benefits of physical activity for weight loss and weight maintenance (1,2). Arthritis is a common comorbidity of adults with obesity (3), and arthritis-related joint pain and functional limitation might contribute substantially to low rates of physical activity among adults with obesity. CDC analyzed combined 2007 and 2009 Behavioral Risk Factor Surveillance System (BRFSS) data for adults aged =18 years to estimate overall and state-specific prevalence of 1) self-reported doctor-diagnosed arthritis among adults with self-reported obesity, and 2) prevalence of self-reported physical inactivity among adults with obesity by arthritis status. This report describes the results of that analysis, which indicted that, overall, arthritis affected 35.6% of adults with obesity. After adjusting for age, sex, race/ethnicity, and education level, adults with obesity and arthritis were 44% more likely to be physically inactive compared with persons with obesity but without arthritis. Among states, the median prevalence of arthritis among adults with obesity was 35.6%. In every state/area except Guam, the prevalence of physical inactivity among adults with obesity was at least 5 percentage points higher (range: 5.4--15.9 percentage points) among persons with arthritis than those without arthritis. Arthritis might be a special barrier to increasing physical activity among many adults with obesity. Safe and effective self-management education and physical activity programs for adults with arthritis exist to address this barrier, are offered in many communities, and can help adults with obesity and arthritis become more physically active. BRFSS is a state-based, random-digit--dialed telephone survey of the noninstitutionalized U.S. civilian population aged =18 years. Data were collected from the 50 states, the District of Columbia (DC), Puerto Rico, Guam, and the U.S. Virgin Islands.* Response rates were calculated using Council of American Survey and Research Organizations (CASRO) guidelines; for 2007 and 2009, respectively, the numbers of respondents were 430,912 and 432,607, median response rates were 50.6% and 52.5%, and median cooperation rates were 72.1% and 75.0%.† Body mass index (BMI) was calculated from self-reported height and weight; obesity was defined as a BMI =30 kg/m2. For consistency with previous analyses (4), participants reporting weight =500 pounds or height =7 feet or <3 feet were excluded. Doctor-diagnosed arthritis was defined based on a "yes" response to the question "Have you ever been told by a doctor or other health professional that you have some form of arthritis, rheumatoid arthritis, gout, lupus, or fibromyalgia?" Physical activity level was determined from six questions on the frequency and duration of participation in nonoccupational activities of moderate and vigorous intensity. Persons reporting no participation in these activities were classified as physically inactive. Yearly sampling weights divided by 2 were applied to generate average annual point estimates representative of each state/area. Taylor series linearization method was used to account for the complex sample design and generate 95% confidence intervals (CIs). Chi-square tests were used to determine statistically significant differences (p<0.05) in characteristics by disease status. Logistic regression was used to assess the association between self-reported doctor-diagnosed arthritis and physical inactivity among persons with obesity. Unadjusted state-level prevalence estimates are reported to provide state and local health departments and other partners with data that can be used to help guide future state-level planning, partnership building, and advocacy efforts. Analysis of the combined 2007 and 2009 data indicated that overall, 9.3% of respondents had both obesity and arthritis, 16.9% had obesity only, and 17.3% had arthritis only (Table 1); arthritis prevalence among adults with obesity was 35.6%. Women were significantly more likely to have both arthritis and obesity or arthritis only. Older age was associated with a significantly higher prevalence of both arthritis and obesity. Compared with other racial/ethnic groups, non-Hispanic blacks had a significantly higher prevalence of both arthritis and obesity, non-Hispanic blacks and Hispanics had a significantly higher prevalence of obesity only, and non-Hispanic whites had a significantly higher prevalence of arthritis only. Higher education level was associated with a lower prevalence of both obesity and arthritis, obesity only, and arthritis only. Prevalence of physical inactivity was highest among those with both arthritis and obesity (22.7%) compared with arthritis only (16.1%), obesity only (13.5%), and neither condition (9.4%) (Figure). In logistic regression models adjusting for age, sex, race/ethnicity, and education level, adults with both obesity and arthritis were 44% more likely to be physically inactive than adults without arthritis (odds ratio = 1.44; CI = 1.37--1.52). In state-specific analyses of adults with obesity, arthritis was common (median: 35.6%; range: 28.7% in California and Hawaii to 44.1% in West Virginia) (Table 2). Among adults with obesity, physical inactivity for those with arthritis in the 50 states and DC was higher (median: 21.2%; range: 14.3% in Wisconsin to 38.8% in Tennessee) than for those without arthritis (median: 12.4%; range: 7.5% in Utah to 29.9% in Tennessee); furthermore, prevalence of physical inactivity was at least 5 percentage points higher in every state. Reported byJennifer M. Hootman, PhD, Louise B. Murphy, PhD, Charles G. Helmick, MD, Arthritis Program, Div of Adult and Community Health, National Center of Chronic Disease Prevention and Health Promotion; Kamil E. Barbour, PhD, EIS officer, CDC. Corresponding contributor: Kamil E. Barbour, CDC, 770-488-5145, kbarbour@cdc.gov. Editorial NoteArthritis and obesity are common chronic conditions affecting an estimated 50 million (3) and 72 million (4) U.S. adults, respectively. The findings in this report indicate that these conditions co-occur commonly (one in three adults with obesity also has arthritis) and might hinder the management of both conditions by limiting physical activity. Among adults with both obesity and arthritis, the adjusted likelihood of physical inactivity was 44% higher compared with that of adults with obesity but without arthritis; all state-specific estimates were consistent with these results. These findings suggest that among many persons with obesity, arthritis might be an additional barrier to physical activity. In addition to obesity, arthritis also has been implicated as a potential barrier to physical activity among persons with heart disease (5) and diabetes (6), conditions often occurring in the same persons. Adults with obesity, and those with heart disease and diabetes, like those without these conditions, face the usual barriers to physical activity, such as lack of motivation and time, competing responsibilities, and difficulty finding an enjoyable activity (7). Persons with arthritis have special barriers to physical activity, including concerns about aggravating arthritis pain and causing further joint damage, and lack of knowledge about which types and amounts of physical activity will not exacerbate their arthritis (7). Health-care providers recommending physical activity for weight loss and weight maintenance should ask their patients about arthritis and related symptoms (e.g., pain and functional limitations) and consider appropriate exercise regimens for those with arthritis and obesity. Low-impact activities such as walking, swimming, and biking generally are safe and appropriate for adults with both obesity and arthritis and can have a role in weight loss and joint pain reduction. In a randomized trial of older adults with osteoarthritis, those with a combined diet and exercise intervention lost more weight than controls (an average of 5.7% of body mass compared with an average of 1.2% in controls) and had less pain and improved physical function (8). Evidence-based physical activity programs, such as EnhanceFitness, the Arthritis Foundation Exercise Program, and the Arthritis Foundation Walk With Ease programs are offered in many communities.§ These programs have proven to be safe and effective for persons with arthritis and specifically address arthritis-specific barriers to being physically active. In addition, self-management education programs such as The Arthritis Foundation Self-Help Program and the Chronic Disease Self-Management Program can help adults manage symptoms, communicate with their health-care provider, and safely increase physical activity. The CDC Arthritis Program funds 12 state programs to increase the availability of these evidence-based interventions.¶ Wider implementation of these programs in service delivery systems in community and health-care settings would likely have a meaningful public health impact. The findings in this report are subject to at least five limitations. First, arthritis, obesity, and physical activity level are self-reported in BRFSS and are not validated by direct measurement. Particularly, height and weight might be overreported or underreported (9); the exact magnitude of this bias is unknown. Second, occupational physical activity was not assessed. Therefore, some adults might have been classified as inactive, despite engaging in moderate-to-vigorous activity at work. Third, BRFSS excludes persons without landline telephones, persons in the military, and those residing in institutions. Estimates are weighted, which partially corrects for underrepresentation attributed to noncoverage of households without a landline telephone. These weights also correct for nonresponse. Fourth, these data are cross-sectional, so causality cannot be inferred directly. Finally, the unadjusted state-level prevalence estimates should not be used for state to state comparisons because they do not account for demographic characteristics (e.g., age) that might vary across states. These are the first state-level estimates demonstrating the co-occurrence of arthritis and obesity and its association with physical inactivity. Reducing the impact of the obesity epidemic is a high priority for public health in general and for CDC, where addressing nutrition, physical activity, and obesity is one of six "winnable battles."** Addressing the special barriers that arthritis presents to physical activity, a primary behavioral intervention for adults with obesity, might help a substantial proportion of adults with both conditions to reduce activity limitations and improve health. Health-care providers, by determining whether arthritis contributes to physical inactivity among their patients with obesity, can tailor their advice and recommendations, including referral to local arthritis-appropriate interventions that specifically address these barriers through proven physical activity and self-management education programs (10). In addition, greater integration of state and community environmental and policy efforts to address obesity and arthritis might reduce the burden of both conditions. References
* BRFSS survey data are available at http://www.cdc.gov/brfss/technical_infodata/surveydata.htm. † The response rate is the percentage of persons who completed interviews among all eligible persons, including those who were not successfully contacted. The cooperation rate is the percentage of persons who completed interviews among all eligible persons who were contacted. § Additional information about CDC-recommended physical activity and self-management education programs is available at http://www.cdc.gov/arthritis/interventions.htm. ¶ Additional information available at http://www.cdc.gov/arthritis/state_programs.htm. ** Additional information available at http://www.cdc.gov/winnablebattles. What is already known on this topic? Physical activity is a recommended intervention for adults with obesity, but arthritis might be a common comorbidity that limits physical activity. What is added by this report? Arthritis is common among U.S. adults with obesity (35.6%). Adults with obesity and arthritis were 44% more likely to be physically inactive compared with adults with obesity but without arthritis. In every state, physical inactivity prevalence was at least 5 percentage points higher (range: 5.4--15.9 percentage points) among adults with obesity and arthritis compared with adults with obesity only. What are the implications for public health practice? Addressing specific barriers to physical activity that arthritis presents for adults with obesity might help a substantial proportion of adults with both conditions to reduce activity limitations and improve health. Local, community-based, arthritis-appropriate interventions, including evidence-based physical activity and self-management education programs, can specifically address these barriers. FIGURE. Weighted prevalence of physical inactivity among adults aged =18 years,* by disease status --- Behavioral Risk Factor Surveillance System, United States,† 2007 and 2009 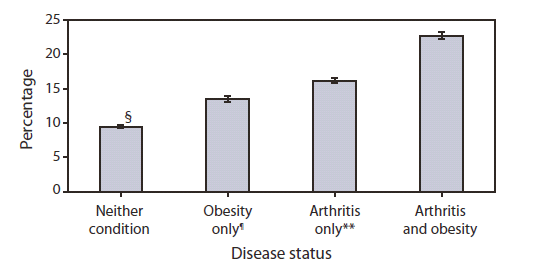
* Includes all respondents reporting no activity when asked six questions about frequency and duration of participation in nonoccupational activities of moderate and vigorous intensity (i.e., lifestyle activities). All other respondents were classified as active. Questions available at http://www.cdc.gov/brfss/questionnaires/pdf-ques/2007brfss.pdf and http://www.cdc.gov/brfss/questionnaires/pdf-ques/2009brfss.pdf. † Includes all 50 states and District of Columbia. § 95% confidence interval. ¶ Obesity was calculated from self-reported height and weight and defined as a body mass index =30 kg/m2. ** Doctor-diagnosed arthritis was defined based on a "yes" response to the question, "Have you ever been told by a doctor or other health professional that you have some form of arthritis, rheumatoid arthritis, gout, lupus, or fibromyalgia?" Alternate Text:The figure above shows weighted prevalence of physical inactivity among adults aged =18 years, by disease status in the United States in 2007 and 2009, according to the Behavioral Risk Factor Surveillance System. Prevalence of physical inactivity was highest among those with both arthritis and obesity (22.7%) compared with arthritis only (16.1%), obesity only (13.5%), and neither condition (9.4%).
All MMWR HTML versions of articles are electronic conversions from typeset documents. This conversion might result in character translation or format errors in the HTML version. Users are referred to the electronic PDF version (http://www.cdc.gov/mmwr) and/or the original MMWR paper copy for printable versions of official text, figures, and tables. An original paper copy of this issue can be obtained from the Superintendent of Documents, U.S. Government Printing Office (GPO), Washington, DC 20402-9371; telephone: (202) 512-1800. Contact GPO for current prices.
Syndicated Content Details:
Source URL: http://www.cdc.gov/mmwr/preview/mmwrhtml/mm6019a4.htm Source Agency: Centers for Disease Control and Prevention (CDC) Captured Date: 2016-05-23 22:07:52.0
|