Persons using assistive technology might not be able to fully access information in this file. For assistance, please send e-mail to: mmwrq@cdc.gov. Type 508 Accommodation and the title of the report in the subject line of e-mail.
Notifiable Diseases and Mortality Tables
Table I Summary of provisional cases of selected notifiable diseases, United States, cumulative, week ending March 3, 2012 (9th Week)
Figure I Selected notifiable disease reports, United States, comparison of provisional 4-week totals ending March 3, 2012, with historical data
Table II Provisional cases of selected notifiable diseases, United States, weeks ending March 3, 2012 and March 5, 2011 (9th Week)
Table III Deaths in 122 U.S. cities, week ending March 3, 2012 (9th Week)
TABLE I. Provisional cases of infrequently reported notifiable diseases (<1,000 cases reported during the preceding year) — United States, week ending March 3, 2012 (9th week)*
TABLE I. (Continued) Provisional cases of infrequently reported notifiable diseases (<1,000 cases reported during the preceding year) — United States, week ending March 3, 2012 (9th week)*
—: No reported cases. N: Not reportable. NN: Not Nationally Notifiable. Cum: Cumulative year-to-date counts.
§ Not reportable in all states. Data from states where the condition is not reportable are excluded from this table except starting in 2007 for the arboviral diseases, STD data, TB data, and influenza-associated pediatric mortality, and in 2003 for SARS-CoV. Reporting exceptions are available at http://www.cdc.gov/osels/ph_surveillance/nndss/phs/infdis.htm.
¶ Includes both neuroinvasive and nonneuroinvasive. Updated weekly from reports to the Division of Vector-Borne Infectious Diseases, National Center for Zoonotic, Vector-Borne, and Enteric Diseases (ArboNET Surveillance). Data for West Nile virus are available in Table II.
** Data for H. influenzae (all ages, all serotypes) are available in Table II.
†† Updated weekly from reports to the Influenza Division, National Center for Immunization and Respiratory Diseases. Since October 2, 2011, five influenza-associated pediatric deaths occurring during the 2011-12 influenza season have been reported.
§§ No measles cases were reported for the current week.
¶¶ Data for meningococcal disease (all serogroups) are available in Table II.
*** CDC discontinued reporting of individual confirmed and probable cases of 2009 pandemic influenza A (H1N1) virus infections on July 24, 2009. During 2009, four cases of human infection with novel influenza A viruses, different from the 2009 pandemic influenza A (H1N1) strain, were reported to CDC. The four cases of novel influenza A virus infection reported to CDC during 2010, and the eight cases reported during 2011, were identified as swine influenza A (H3N2) virus and are unrelated to the 2009 pandemic influenza A (H1N1) virus. Total case counts are provided by the Influenza Division, National Center for Immunization and Respiratory Diseases (NCIRD).
††† No rubella cases were reported for the current week.
§§§ Updated weekly from reports to the Division of STD Prevention, National Center for HIV/AIDS, Viral Hepatitis, STD, and TB Prevention.
¶¶¶ There were no cases of viral hemorrhagic fever reported during the current week. See Table II for dengue hemorrhagic fever.
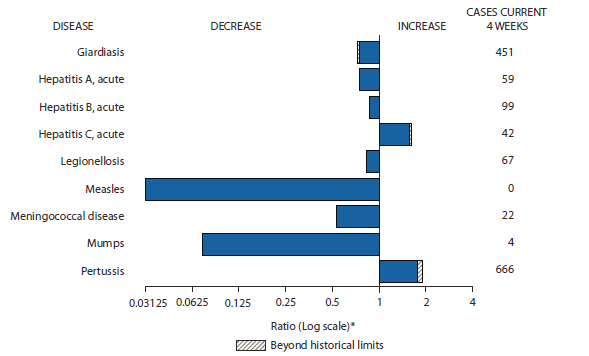
FIGURE I. Selected notifiable disease reports, United States, comparison of provisional 4-week totals March 3, 2012, with historical data
* No measles cases were reported for the current 4-week period yielding a ratio for week ——— of zero (0).
† Ratio of current 4-week total to mean of 15 4-week totals (from previous, comparable, and subsequent 4-week periods for the past 5 years). The point where the hatched area begins is based on the mean and two standard deviations of these 4-week totals.
Alternate Text: The figure above shows selected notifiable disease reports for the United States, with comparison of provisional 4-week totals through March 3, 2012, with historical data. Reports of acute hepatitis C and pertussis both increased beyond historical limits. Reports of giardiasis, acute hepatitis A, acute hepatitis B, legionellosis, measles, meningococcal disease, and mumps all decreased with giardiasis increasing beyond historical limits.
TABLE II. Provisional cases of selected notifiable diseases, United States, weeks ending March 3, 2012, and March 5, 2011 (9th week)*
Reporting area
Chlamydia trachomatis infection
Coccidioidomycosis
Cryptosporidiosis
Current week
Previous 52 weeks
Cum 2012
Cum 2011
Current week
Previous 52 weeks
Cum 2012
Cum 2011
Current week
Previous 52 weeks
Cum 2012
Cum 2011
Med
Max
Med
Max
Med
Max
United States
12,530
26,825
30,780
178,383
232,595
71
400
588
2,543
3,931
56
133
399
691
848
New England
499
898
1,593
5,252
6,058
—
0
1
—
—
—
6
22
30
46
Connecticut
—
240
869
—
481
N
0
0
N
N
—
1
9
5
10
Maine
53
59
101
520
524
N
0
0
N
N
—
1
4
2
6
Massachusetts
230
427
860
3,233
3,370
N
0
0
N
N
—
2
8
15
20
New Hampshire
—
58
90
289
548
—
0
1
—
—
—
1
5
3
6
Rhode Island
150
80
187
1,009
863
—
0
0
—
—
—
0
1
—
1
Vermont
66
27
62
201
272
N
0
0
N
N
—
1
5
5
3
Mid. Atlantic
2,150
3,172
4,034
25,101
28,367
—
0
0
—
—
5
15
44
72
114
New Jersey
167
539
898
3,960
4,145
N
0
0
N
N
—
1
4
1
9
New York (Upstate)
830
715
1,963
5,486
5,590
N
0
0
N
N
—
4
16
17
26
New York City
322
1,023
1,315
6,423
9,720
N
0
0
N
N
—
1
6
12
13
Pennsylvania
831
1,043
1,598
9,232
8,912
N
0
0
N
N
5
8
27
42
66
E.N. Central
1,022
4,211
4,684
26,589
39,156
—
1
5
9
5
14
33
148
159
183
Illinois
28
1,220
1,470
5,393
11,148
N
0
0
N
N
—
3
26
10
20
Indiana
187
564
731
4,045
5,314
N
0
0
N
N
—
2
14
—
28
Michigan
456
941
1,210
7,105
9,308
—
1
3
5
1
2
7
14
38
36
Ohio
161
1,028
1,180
6,661
9,187
—
0
2
4
4
11
11
95
79
57
Wisconsin
190
466
560
3,385
4,199
N
0
0
N
N
1
8
65
32
42
W.N. Central
94
1,501
1,818
3,385
13,189
—
0
2
—
—
4
15
85
59
99
Iowa
15
211
439
1,785
1,913
N
0
0
N
N
1
6
19
17
42
Kansas
—
208
281
114
1,737
N
0
0
N
N
—
0
11
4
—
Minnesota
—
318
404
—
2,997
—
0
0
—
—
—
0
0
—
—
Missouri
—
526
759
—
4,490
—
0
0
—
—
2
5
61
19
25
Nebraska
58
127
213
923
1,028
—
0
2
—
—
1
2
12
8
23
North Dakota
—
46
76
5
392
N
0
0
N
N
—
0
12
—
—
South Dakota
21
62
89
558
632
N
0
0
N
N
—
2
13
11
9
S. Atlantic
4,367
5,463
7,445
46,127
48,063
—
0
2
—
—
21
22
61
168
179
Delaware
94
85
182
679
733
—
0
0
—
—
—
0
4
6
2
District of Columbia
136
111
217
1,151
973
—
0
0
—
—
—
0
1
—
3
Florida
811
1,505
1,697
12,440
12,929
N
0
0
N
N
10
8
17
76
74
Georgia
742
1,099
1,563
8,857
7,625
N
0
0
N
N
4
5
12
35
44
Maryland
278
482
769
2,112
3,957
—
0
2
—
—
4
1
7
20
14
North Carolina
812
991
1,688
8,178
8,289
N
0
0
N
N
—
0
46
—
9
South Carolina
502
535
1,344
5,210
6,195
N
0
0
N
N
—
2
6
14
22
Virginia
885
662
1,778
6,632
6,594
N
0
0
N
N
3
2
8
16
11
West Virginia
107
81
146
868
768
N
0
0
N
N
—
0
5
1
—
E.S. Central
1,453
1,924
2,804
17,200
15,455
—
0
0
—
—
4
8
25
45
26
Alabama
570
542
1,566
4,275
4,399
N
0
0
N
N
1
2
7
19
14
Kentucky
346
315
557
2,779
1,723
N
0
0
N
N
—
2
17
4
6
Mississippi
312
424
792
4,942
4,050
N
0
0
N
N
1
1
4
8
3
Tennessee
225
605
812
5,204
5,283
N
0
0
N
N
2
2
6
14
3
W.S. Central
432
3,295
4,311
18,844
29,232
—
0
1
—
1
4
9
44
56
46
Arkansas
353
317
439
2,962
2,583
N
0
0
N
N
—
0
2
3
1
Louisiana
—
356
1,071
1,566
3,409
—
0
1
—
1
1
1
9
13
5
Oklahoma
79
109
675
771
2,030
N
0
0
N
N
—
2
6
10
9
Texas
—
2,368
3,108
13,545
21,210
N
0
0
N
N
3
5
40
30
31
Mountain
1,172
1,724
2,417
12,954
16,078
55
308
460
2,176
3,033
2
10
29
52
82
Arizona
88
546
791
4,027
4,780
53
304
457
2,151
2,990
—
1
4
2
4
Colorado
555
402
846
3,261
4,265
N
0
0
N
N
—
2
11
5
23
Idaho
103
86
274
653
650
N
0
0
N
N
—
1
9
12
8
Montana
89
67
87
675
582
N
0
0
N
N
2
1
6
11
7
Nevada
192
204
319
1,293
2,383
2
2
5
19
17
—
0
2
2
2
New Mexico
144
220
336
1,834
1,873
—
1
4
—
15
—
2
9
15
23
Utah
1
135
190
1,103
1,184
—
0
4
4
8
—
1
5
2
7
Wyoming
—
30
67
108
361
—
0
2
2
3
—
0
3
3
8
Pacific
1,341
4,050
5,447
22,931
36,997
16
93
169
358
892
2
9
23
50
73
Alaska
60
109
152
964
1,098
N
0
0
N
N
—
0
3
—
3
California
550
3,054
4,518
16,209
28,541
16
93
169
358
892
—
6
16
44
37
Hawaii
—
112
142
143
1,068
N
0
0
N
N
—
0
1
2
—
Oregon
332
279
412
2,581
2,195
N
0
0
N
N
—
2
8
1
23
Washington
399
434
612
3,034
4,095
N
0
0
N
N
2
1
17
3
10
Territories
American Samoa
—
0
0
—
—
N
0
0
N
N
N
0
0
N
N
C.N.M.I.
—
—
—
—
—
—
—
—
—
—
—
—
—
—
—
Guam
—
11
44
—
132
—
0
0
—
—
—
0
0
—
—
Puerto Rico
—
109
348
1,009
963
N
0
0
N
N
N
0
0
N
N
U.S. Virgin Islands
—
16
27
—
127
—
0
0
—
—
—
0
0
—
—
C.N.M.I.: Commonwealth of Northern Mariana Islands.
U: Unavailable. —: No reported cases. N: Not reportable. NN: Not Nationally Notifiable. Cum: Cumulative year-to-date counts. Med: Median. Max: Maximum.
† Data for meningococcal disease, invasive caused by serogroups A, C, Y, and W-135; serogroup B; other serogroup; and unknown serogroup are available in Table I.
TABLE II. (Continued) Provisional cases of selected notifiable diseases, United States, weeks ending March 3, 2012, and March 5, 2011 (9th week)*
Reporting area
Rabies, animal
Salmonellosis
Shiga toxin-producing E. coli(STEC)†
Current week
Previous 52 weeks
Cum 2012
Cum 2011
Current week
Previous 52 weeks
Cum 2012
Cum 2011
Current week
Previous 52 weeks
Cum 2012
Cum 2011
Med
Max
Med
Max
Med
Max
United States
36
61
105
390
422
233
899
1,910
3,588
4,242
16
94
208
331
359
New England
8
5
16
59
18
1
37
107
114
203
—
3
13
11
15
Connecticut
2
3
10
28
4
—
8
30
36
57
—
1
4
6
7
Maine
—
1
6
15
4
—
2
7
9
20
—
0
3
—
1
Massachusetts
—
0
0
—
—
—
19
44
46
93
—
1
9
5
2
New Hampshire
3
0
3
6
2
—
3
8
6
18
—
0
3
—
5
Rhode Island
—
0
6
5
2
—
1
62
5
8
—
0
2
—
—
Vermont
3
0
2
5
6
1
1
8
12
7
—
0
3
—
—
Mid. Atlantic
13
15
36
77
119
27
96
209
392
453
1
11
34
36
63
New Jersey
—
0
0
—
—
—
21
48
57
95
—
2
7
1
18
New York (Upstate)
7
7
20
33
40
19
25
67
103
83
1
3
13
9
13
New York City
—
0
3
—
2
—
19
42
107
119
—
2
6
9
10
Pennsylvania
6
8
21
44
77
8
31
114
125
156
—
3
16
17
22
E.N. Central
—
2
20
3
8
18
89
184
276
501
3
16
54
57
75
Illinois
—
0
6
—
4
—
27
80
76
173
—
4
14
9
11
Indiana
—
0
7
—
—
—
8
27
21
52
—
2
10
4
12
Michigan
—
1
6
2
3
3
15
42
67
88
—
3
19
33
16
Ohio
—
1
5
1
1
15
20
46
103
122
3
3
9
11
20
Wisconsin
N
0
0
N
N
—
11
46
9
66
—
3
21
—
16
W.N. Central
—
1
8
14
5
12
39
99
195
203
2
11
40
47
30
Iowa
—
0
0
—
—
—
8
19
35
53
—
2
15
7
8
Kansas
—
1
4
7
2
1
8
27
54
36
—
2
8
5
6
Minnesota
—
0
0
—
—
—
0
0
—
—
—
0
0
—
—
Missouri
—
0
4
3
—
8
15
42
78
81
2
5
32
23
7
Nebraska
—
0
3
—
3
3
4
13
18
18
—
1
7
7
8
North Dakota
—
0
4
4
—
—
0
15
—
—
—
0
4
—
—
South Dakota
—
0
0
—
—
—
3
10
10
15
—
1
4
5
1
S. Atlantic
4
19
48
127
233
99
276
741
1,286
1,195
3
12
32
74
62
Delaware
—
0
0
—
—
—
2
12
11
17
—
0
2
2
2
District of Columbia
—
0
0
—
—
—
1
6
—
6
—
0
1
1
1
Florida
4
0
13
19
120
52
107
203
550
467
2
3
9
31
10
Georgia
—
0
0
—
—
3
43
139
157
234
—
2
8
6
12
Maryland
—
7
13
41
38
16
19
46
105
89
—
1
4
5
11
North Carolina
—
0
0
—
—
16
34
251
251
162
1
2
26
16
16
South Carolina
N
0
0
N
N
5
27
71
106
102
—
0
4
3
—
Virginia
—
11
27
60
75
7
20
54
98
118
—
2
8
10
10
West Virginia
—
0
30
7
—
—
0
18
8
—
—
0
2
—
—
E.S. Central
3
3
11
12
21
11
64
190
253
299
—
4
18
23
18
Alabama
2
2
7
10
11
4
18
70
67
98
—
1
15
9
2
Kentucky
1
0
2
2
1
—
11
30
45
51
—
1
5
5
5
Mississippi
—
0
1
—
—
—
22
66
64
56
—
0
4
5
2
Tennessee
—
1
4
—
9
7
15
51
77
94
—
1
11
4
9
W.S. Central
8
1
21
70
3
16
134
250
393
404
2
10
61
25
25
Arkansas
3
0
10
14
3
2
13
52
31
53
—
1
6
3
1
Louisiana
—
0
0
—
—
2
14
44
79
67
—
0
1
—
1
Oklahoma
—
0
21
7
—
4
13
31
50
37
1
1
10
6
4
Texas
5
0
11
49
—
8
93
159
233
247
1
7
61
16
19
Mountain
—
1
4
17
—
5
46
93
207
335
1
11
27
24
40
Arizona
N
0
0
N
N
2
15
35
88
112
—
2
7
5
10
Colorado
—
0
0
—
—
—
9
23
34
77
—
3
9
4
14
Idaho
—
0
1
—
—
—
2
8
10
32
—
1
8
3
5
Montana
N
0
0
N
N
1
2
10
12
7
—
1
4
1
1
Nevada
—
0
3
—
—
2
3
7
13
25
1
1
7
3
2
New Mexico
—
0
4
17
—
—
5
22
25
36
—
1
3
3
4
Utah
—
0
2
—
—
—
6
15
20
41
—
1
7
2
4
Wyoming
—
0
0
—
—
—
1
9
5
5
—
0
7
3
—
Pacific
—
4
14
11
15
44
93
173
472
649
4
9
28
34
31
Alaska
—
0
2
3
7
2
1
6
10
9
—
0
1
—
—
California
—
4
13
8
5
27
71
141
350
503
1
5
14
15
18
Hawaii
—
0
0
—
—
—
6
14
14
55
—
0
2
—
—
Oregon
—
0
2
—
3
1
6
12
35
48
1
2
11
9
6
Washington
—
0
0
—
—
14
9
43
63
34
2
2
22
10
7
Territories
American Samoa
N
0
0
N
N
1
0
0
1
—
—
0
0
—
—
C.N.M.I.
—
—
—
—
—
—
—
—
—
—
—
—
—
—
—
Guam
—
0
0
—
—
—
0
2
—
4
—
0
0
—
—
Puerto Rico
—
0
6
13
5
—
2
12
6
25
—
0
0
—
—
U.S. Virgin Islands
—
0
0
—
—
—
0
0
—
—
—
0
0
—
—
C.N.M.I.: Commonwealth of Northern Mariana Islands.
U: Unavailable. —: No reported cases. N: Not reportable. NN: Not Nationally Notifiable. Cum: Cumulative year-to-date counts. Med: Median. Max: Maximum.
† Illnesses with similar clinical presentation that result from Spotted fever group rickettsia infections are reported as Spotted fever rickettsioses. Rocky Mountain spotted fever (RMSF) caused by Rickettsia rickettsii, is the most common and well-known spotted fever.
TABLE II. (Continued) Provisional cases of selected notifiable diseases, United States, weeks ending March 3, 2012, and March 5, 2011 (9th week)*
Reporting area
Streptococcus pneumoniae,† invasive disease
Syphilis, primary and secondary
All ages
Age <5
Current week
Previous 52 weeks
Cum 2012
Cum 2011
Current week
Previous 52 weeks
Cum 2012
Cum 2011
Current week
Previous 52 weeks
Cum 2012
Cum 2011
Med
Max
Med
Max
Med
Max
United States
230
262
506
2,619
3,648
10
21
43
179
221
77
269
306
1,541
2,253
New England
1
14
31
102
200
—
1
4
6
8
6
7
23
52
68
Connecticut
—
6
20
54
93
—
0
3
2
2
—
0
12
—
12
Maine
—
2
8
17
28
—
0
1
1
1
2
0
2
2
2
Massachusetts
—
0
3
5
7
—
0
2
2
3
2
5
10
33
39
New Hampshire
—
1
8
13
31
—
0
1
1
—
—
0
3
4
4
Rhode Island
—
1
5
—
34
—
0
1
—
1
2
0
7
13
9
Vermont
1
1
6
13
7
—
0
2
—
1
—
0
2
—
2
Mid. Atlantic
43
29
66
415
408
2
2
11
22
19
8
29
48
173
281
New Jersey
1
12
26
90
201
—
1
4
8
11
—
4
11
5
35
New York (Upstate)
37
2
33
216
15
2
1
10
10
8
4
4
9
19
24
New York City
5
12
23
109
192
—
0
9
4
—
1
14
24
75
163
Pennsylvania
N
0
0
N
N
N
0
0
N
N
3
7
17
74
59
E.N. Central
53
63
122
561
711
4
3
10
33
35
1
31
49
97
293
Illinois
N
0
0
N
N
—
0
0
—
—
—
12
25
30
125
Indiana
1
13
36
83
178
—
1
4
3
8
—
3
8
26
31
Michigan
4
13
26
116
139
—
1
2
7
9
—
5
12
10
47
Ohio
41
27
43
274
301
2
1
7
14
14
1
7
17
27
79
Wisconsin
7
8
23
88
93
2
0
2
9
4
—
1
6
4
11
W.N. Central
7
2
28
38
34
1
0
2
2
2
—
5
13
4
74
Iowa
N
0
0
N
N
N
0
0
N
N
—
0
3
3
3
Kansas
N
0
0
N
N
N
0
0
N
N
—
0
4
—
3
Minnesota
—
0
0
—
—
—
0
0
—
—
—
2
8
—
33
Missouri
N
0
0
N
N
—
0
0
—
—
—
2
8
—
32
Nebraska
7
2
5
38
34
1
0
2
2
2
—
0
2
1
3
North Dakota
—
0
25
—
—
—
0
1
—
—
—
0
1
—
—
South Dakota
N
0
0
N
N
—
0
0
—
—
—
0
0
—
—
S. Atlantic
72
65
143
705
1,049
2
6
15
52
70
33
67
85
481
527
Delaware
—
0
5
8
21
—
0
0
—
—
—
0
4
7
3
District of Columbia
—
0
5
1
15
—
0
1
1
2
4
3
9
33
35
Florida
25
21
48
248
431
2
2
8
19
34
—
24
36
169
208
Georgia
14
19
38
215
289
—
2
6
19
20
15
12
46
88
55
Maryland
8
9
25
73
159
—
1
3
3
9
3
8
20
42
66
North Carolina
N
0
0
N
N
N
0
0
N
N
2
8
21
68
78
South Carolina
12
8
22
109
134
—
0
3
4
5
2
4
11
37
48
Virginia
N
0
0
N
N
—
0
0
—
—
7
4
13
37
34
West Virginia
13
1
48
51
—
—
0
4
6
—
—
0
2
—
—
E.S. Central
10
23
45
212
310
1
2
4
11
19
9
15
31
80
119
Alabama
N
0
0
N
N
N
0
0
N
N
1
4
10
16
41
Kentucky
2
4
12
44
52
—
0
3
1
5
5
2
8
18
18
Mississippi
N
0
0
N
N
—
0
0
—
—
—
3
22
24
20
Tennessee
8
19
42
168
258
1
1
4
10
14
3
5
11
22
40
W.S. Central
26
32
139
296
412
—
3
10
26
31
6
37
51
253
272
Arkansas
4
4
14
41
58
—
0
3
5
5
3
4
15
50
29
Louisiana
—
2
14
39
73
—
0
2
3
5
—
7
25
17
46
Oklahoma
N
0
0
N
N
—
0
0
—
—
3
1
6
13
8
Texas
22
24
125
216
281
—
3
10
18
21
—
23
39
173
189
Mountain
16
26
67
271
486
—
2
8
20
35
3
12
20
52
109
Arizona
15
12
33
176
250
—
1
5
12
17
—
5
11
20
37
Colorado
—
8
23
44
118
—
0
4
4
5
—
2
6
13
23
Idaho
N
0
0
N
N
—
0
0
—
—
—
0
4
3
3
Montana
N
0
0
N
N
N
0
0
N
N
—
0
1
—
4
Nevada
N
0
0
N
N
N
0
0
N
N
3
2
9
9
26
New Mexico
1
4
12
47
65
—
0
2
4
5
—
1
4
4
12
Utah
—
1
7
—
48
—
0
1
—
8
—
0
2
3
4
Wyoming
—
0
3
4
5
—
0
0
—
—
—
0
0
—
—
Pacific
2
2
9
19
38
—
0
2
7
2
11
58
76
349
510
Alaska
2
2
9
19
37
—
0
2
7
2
—
0
2
3
—
California
N
0
0
N
N
N
0
0
N
N
6
46
64
292
403
Hawaii
—
0
1
—
1
—
0
1
—
—
—
0
3
—
1
Oregon
N
0
0
N
N
N
0
0
N
N
—
4
14
26
36
Washington
N
0
0
N
N
N
0
0
N
N
5
5
12
28
70
Territories
American Samoa
N
0
0
N
N
—
0
0
—
—
—
0
0
—
—
C.N.M.I.
—
—
—
—
—
—
—
—
—
—
—
—
—
—
—
Guam
—
0
0
—
—
—
0
0
—
—
—
0
0
—
—
Puerto Rico
—
0
0
—
—
—
0
0
—
—
—
5
15
33
33
U.S. Virgin Islands
—
0
0
—
—
—
0
0
—
—
—
0
0
—
—
C.N.M.I.: Commonwealth of Northern Mariana Islands.
U: Unavailable. —: No reported cases. N: Not reportable. NN: Not Nationally Notifiable. Cum: Cumulative year-to-date counts. Med: Median. Max: Maximum.
† Includes drug resistant and susceptible cases of invasive Streptococcus pneumoniae disease among children <5 years and among all ages. Case definition: Isolation of S. pneumoniae from a normally sterile body site (e.g., blood or cerebrospinal fluid).
TABLE II. (Continued) Provisional cases of selected notifiable diseases, United States, weeks ending March 3, 2012, and March 5, 2011 (9th week)*
Reporting area
Varicella (chickenpox)
West Nile virus disease†
Neuroinvasive
Nonneuroinvasive§
Current week
Previous 52 weeks
Cum 2012
Cum 2011
Current week
Previous 52 weeks
Cum 2012
Cum 2011
Current week
Previous 52 weeks
Cum 2012
Cum 2011
Med
Max
Med
Max
Med
Max
United States
204
293
413
2,068
2,477
—
0
64
—
1
—
0
33
—
1
New England
4
23
54
143
212
—
0
3
—
—
—
0
1
—
—
Connecticut
—
6
20
35
46
—
0
2
—
—
—
0
1
—
—
Maine
—
4
11
35
39
—
0
0
—
—
—
0
0
—
—
Massachusetts
—
9
18
47
74
—
0
2
—
—
—
0
1
—
—
New Hampshire
—
2
10
—
19
—
0
0
—
—
—
0
0
—
—
Rhode Island
—
0
6
1
8
—
0
1
—
—
—
0
0
—
—
Vermont
4
2
9
25
26
—
0
1
—
—
—
0
0
—
—
Mid. Atlantic
21
55
80
416
267
—
0
11
—
—
—
0
6
—
—
New Jersey
6
34
70
251
95
—
0
1
—
—
—
0
2
—
—
New York (Upstate)
N
0
0
N
N
—
0
5
—
—
—
0
4
—
—
New York City
—
0
0
—
—
—
0
4
—
—
—
0
1
—
—
Pennsylvania
15
20
42
165
172
—
0
2
—
—
—
0
1
—
—
E.N. Central
37
63
118
523
663
—
0
13
—
—
—
0
7
—
—
Illinois
1
16
38
122
154
—
0
6
—
—
—
0
5
—
—
Indiana
5
5
20
65
57
—
0
2
—
—
—
0
1
—
—
Michigan
9
18
45
153
220
—
0
7
—
—
—
0
2
—
—
Ohio
22
21
47
183
231
—
0
3
—
—
—
0
3
—
—
Wisconsin
—
0
1
—
1
—
0
1
—
—
—
0
1
—
—
W.N. Central
6
13
32
117
129
—
0
9
—
1
—
0
7
—
—
Iowa
N
0
0
N
N
—
0
2
—
—
—
0
2
—
—
Kansas
5
7
21
85
67
—
0
1
—
—
—
0
0
—
—
Minnesota
—
0
1
—
—
—
0
1
—
—
—
0
1
—
—
Missouri
—
4
18
25
51
—
0
2
—
1
—
0
2
—
—
Nebraska
—
0
3
3
6
—
0
4
—
—
—
0
3
—
—
North Dakota
—
0
7
—
1
—
0
1
—
—
—
0
1
—
—
South Dakota
1
1
6
4
4
—
0
0
—
—
—
0
1
—
—
S. Atlantic
30
36
66
227
327
—
0
12
—
—
—
0
6
—
—
Delaware
—
0
2
—
3
—
0
1
—
—
—
0
0
—
—
District of Columbia
—
0
2
—
4
—
0
3
—
—
—
0
3
—
—
Florida
24
16
38
141
162
—
0
4
—
—
—
0
2
—
—
Georgia
N
0
0
N
N
—
0
4
—
—
—
0
1
—
—
Maryland
N
0
0
N
N
—
0
5
—
—
—
0
3
—
—
North Carolina
N
0
0
N
N
—
0
1
—
—
—
0
0
—
—
South Carolina
—
0
9
—
—
—
0
0
—
—
—
0
0
—
—
Virginia
6
10
27
57
64
—
0
2
—
—
—
0
1
—
—
West Virginia
—
5
32
29
94
—
0
1
—
—
—
0
0
—
—
E.S. Central
3
5
15
41
56
—
0
11
—
—
—
0
5
—
1
Alabama
3
5
14
37
52
—
0
2
—
—
—
0
0
—
—
Kentucky
N
0
0
N
N
—
0
2
—
—
—
0
1
—
—
Mississippi
—
0
2
4
4
—
0
5
—
—
—
0
4
—
1
Tennessee
N
0
0
N
N
—
0
3
—
—
—
0
1
—
—
W.S. Central
70
54
177
404
379
—
0
4
—
—
—
0
3
—
—
Arkansas
—
4
26
15
51
—
0
1
—
—
—
0
0
—
—
Louisiana
—
2
6
10
16
—
0
1
—
—
—
0
2
—
—
Oklahoma
N
0
0
N
N
—
0
1
—
—
—
0
0
—
—
Texas
70
48
171
379
312
—
0
3
—
—
—
0
3
—
—
Mountain
31
23
68
182
400
—
0
11
—
—
—
0
5
—
—
Arizona
4
9
50
49
125
—
0
7
—
—
—
0
4
—
—
Colorado
25
6
32
63
107
—
0
2
—
—
—
0
2
—
—
Idaho
N
0
0
N
N
—
0
1
—
—
—
0
1
—
—
Montana
2
2
7
8
71
—
0
1
—
—
—
0
0
—
—
Nevada
N
0
0
N
N
—
0
4
—
—
—
0
2
—
—
New Mexico
—
1
8
19
11
—
0
1
—
—
—
0
0
—
—
Utah
—
4
26
41
83
—
0
1
—
—
—
0
1
—
—
Wyoming
—
0
1
2
3
—
0
1
—
—
—
0
1
—
—
Pacific
2
2
9
15
44
—
0
18
—
—
—
0
8
—
—
Alaska
1
1
4
8
19
—
0
0
—
—
—
0
0
—
—
California
1
0
4
4
14
—
0
18
—
—
—
0
8
—
—
Hawaii
—
0
4
3
11
—
0
0
—
—
—
0
0
—
—
Oregon
N
0
0
N
N
—
0
0
—
—
—
0
0
—
—
Washington
N
0
0
N
N
—
0
0
—
—
—
0
0
—
—
Territories
American Samoa
N
0
0
N
N
—
0
0
—
—
—
0
0
—
—
C.N.M.I.
—
—
—
—
—
—
—
—
—
—
—
—
—
—
—
Guam
—
2
4
—
5
—
0
0
—
—
—
0
0
—
—
Puerto Rico
2
3
10
27
38
—
0
0
—
—
—
0
0
—
—
U.S. Virgin Islands
—
0
0
—
—
—
0
0
—
—
—
0
0
—
—
C.N.M.I.: Commonwealth of Northern Mariana Islands.
U: Unavailable. —: No reported cases. N: Not reportable. NN: Not Nationally Notifiable. Cum: Cumulative year-to-date counts. Med: Median. Max: Maximum.
† Updated weekly from reports to the Division of Vector-Borne Infectious Diseases, National Center for Zoonotic, Vector-Borne, and Enteric Diseases (ArboNET Surveillance). Data for California serogroup, eastern equine, Powassan, St. Louis, and western equine diseases are available in Table I.
§ Not reportable in all states. Data from states where the condition is not reportable are excluded from this table, except starting in 2007 for the domestic arboviral diseases and influenza-associated pediatric mortality, and in 2003 for SARS-CoV. Reporting exceptions are available at http://www.cdc.gov/osels/ph_surveillance/nndss/phs/infdis.htm.
TABLE III. Deaths in 122 U.S. cities,* week ending March 3, 2012 (9th week)
Reporting area
All causes, by age (years)
P&I† Total
Reporting area (Continued)
All causes, by age (years)
P&I† Total
All Ages
=65
45–64
25–44
1–24
<1
All Ages
=65
45–64
25–44
1–24
<1
New England
545
395
102
25
4
19
62
S. Atlantic
982
635
243
68
19
17
64
Boston, MA
115
80
22
8
1
4
14
Atlanta, GA
129
80
37
11
1
—
10
Bridgeport, CT
30
24
6
—
—
—
4
Baltimore, MD
120
77
33
9
—
1
5
Cambridge, MA
16
12
3
1
—
—
—
Charlotte, NC
162
110
35
10
5
2
10
Fall River, MA
32
29
3
—
—
—
5
Jacksonville, FL
7
4
3
—
—
—
1
Hartford, CT
51
33
14
2
1
1
9
Miami, FL
99
66
21
8
2
2
3
Lowell, MA
13
10
2
1
—
—
1
Norfolk, VA
64
36
18
5
3
2
2
Lynn, MA
6
6
—
—
—
—
—
Richmond, VA
56
33
15
4
4
—
5
New Bedford, MA
38
29
8
1
—
—
3
Savannah, GA
54
35
14
3
—
2
4
New Haven, CT
33
25
5
2
—
1
3
St. Petersburg, FL
53
46
6
—
—
1
8
Providence, RI
80
59
12
3
1
5
9
Tampa, FL
112
74
30
7
—
1
7
Somerville, MA
4
3
1
—
—
—
—
Washington, D.C.
105
57
28
10
4
6
7
Springfield, MA
26
12
6
4
—
4
2
Wilmington, DE
21
17
3
1
—
—
2
Waterbury, CT
26
20
5
—
1
—
—
E.S. Central
852
512
250
54
22
14
81
Worcester, MA
75
53
15
3
—
4
12
Birmingham, AL
139
87
40
6
4
2
11
Mid. Atlantic
2,087
1,442
474
92
32
47
109
Chattanooga, TN
91
60
23
4
2
2
8
Albany, NY
52
34
15
2
—
1
5
Knoxville, TN
110
75
27
6
2
—
13
Allentown, PA
38
29
7
2
—
—
4
Lexington, KY
62
34
23
4
—
1
4
Buffalo, NY
80
57
22
1
—
—
8
Memphis, TN
188
111
50
17
7
3
24
Camden, NJ
31
18
7
4
1
1
2
Mobile, AL
64
34
22
4
3
1
1
Elizabeth, NJ
12
10
2
—
—
—
—
Montgomery, AL
40
28
10
1
1
—
6
Erie, PA
32
29
2
1
—
—
3
Nashville, TN
158
83
55
12
3
5
14
Jersey City, NJ
16
11
4
—
1
—
—
W.S. Central
1,314
859
289
89
39
37
89
New York City, NY
1,041
748
228
42
9
14
50
Austin, TX
76
57
8
7
4
—
6
Newark, NJ
55
28
20
4
2
1
4
Baton Rouge, LA
72
54
12
3
—
3
—
Paterson, NJ
25
15
7
2
1
—
2
Corpus Christi, TX
82
51
24
3
1
3
14
Philadelphia, PA
347
188
98
24
10
27
9
Dallas, TX
229
133
65
14
5
11
12
Pittsburgh, PA§
40
32
5
2
1
—
—
El Paso, TX
111
78
26
3
3
1
4
Reading, PA
38
32
6
—
—
—
4
Fort Worth, TX
U
U
U
U
U
U
U
Rochester, NY
71
53
10
2
5
1
1
Houston, TX
143
84
24
19
10
6
5
Schenectady, NY
31
25
4
2
—
—
3
Little Rock, AR
91
59
17
8
3
4
4
Scranton, PA
33
29
2
1
1
—
—
New Orleans, LA
U
U
U
U
U
U
U
Syracuse, NY
95
70
21
1
1
2
11
San Antonio, TX
269
174
59
23
10
3
23
Trenton, NJ
U
U
U
U
U
U
U
Shreveport, LA
113
81
24
3
—
5
10
Utica, NY
19
13
5
1
—
—
—
Tulsa, OK
128
88
30
6
3
1
11
Yonkers, NY
31
21
9
1
—
—
3
Mountain
1,128
740
280
65
25
18
75
E.N. Central
2,081
1,409
487
109
38
38
146
Albuquerque, NM
125
75
41
3
3
3
11
Akron, OH
56
34
20
1
—
1
6
Boise, ID
42
31
8
2
1
—
2
Canton, OH
42
29
12
—
—
1
1
Colorado Springs, CO
91
64
22
3
1
1
2
Chicago, IL
256
167
59
15
12
3
22
Denver, CO
122
81
26
8
4
3
7
Cincinnati, OH
80
42
28
3
3
4
6
Las Vegas, NV
321
221
75
18
4
3
29
Cleveland, OH
303
228
52
17
3
3
20
Ogden, UT
42
29
12
—
1
—
2
Columbus, OH
159
108
33
9
4
5
12
Phoenix, AZ
216
124
61
22
7
2
10
Dayton, OH
119
96
17
5
—
1
10
Pueblo, CO
35
28
7
—
—
—
2
Detroit, MI
153
74
57
15
2
5
7
Salt Lake City, UT
134
87
28
9
4
6
10
Evansville, IN
49
29
14
5
1
—
1
Tucson, AZ
U
U
U
U
U
U
U
Fort Wayne, IN
88
66
16
3
2
1
6
Pacific
2,260
1,567
495
114
48
35
222
Gary, IN
12
6
6
—
—
—
—
Berkeley, CA
14
10
3
—
—
1
1
Grand Rapids, MI
46
35
7
2
1
1
5
Fresno, CA
153
110
35
5
2
1
16
Indianapolis, IN
214
132
64
11
3
4
15
Glendale, CA
37
30
6
—
—
1
11
Lansing, MI
61
50
7
3
1
—
5
Honolulu, HI
72
53
15
2
—
2
8
Milwaukee, WI
98
59
29
6
2
2
3
Long Beach, CA
84
46
25
6
4
3
10
Peoria, IL
50
39
7
3
—
1
7
Los Angeles, CA
274
180
66
13
11
4
33
Rockford, IL
44
28
14
—
2
—
—
Pasadena, CA
19
16
3
—
—
—
2
South Bend, IN
63
41
14
2
2
4
7
Portland, OR
114
77
26
7
3
1
7
Toledo, OH
127
98
21
6
—
2
6
Sacramento, CA
240
170
50
13
3
4
24
Youngstown, OH
61
48
10
3
—
—
7
San Diego, CA
186
136
34
7
5
4
18
W.N. Central
685
452
171
33
8
21
53
San Francisco, CA
499
339
113
31
8
8
52
Des Moines, IA
67
51
10
5
—
1
6
San Jose, CA
225
172
34
11
3
4
19
Duluth, MN
30
25
5
—
—
—
1
Santa Cruz, CA
32
26
5
1
—
—
3
Kansas City, KS
24
16
5
2
—
1
6
Seattle, WA
122
76
35
10
1
—
4
Kansas City, MO
116
77
29
4
2
4
5
Spokane, WA
80
51
23
4
1
1
5
Lincoln, NE
40
25
11
—
—
4
2
Tacoma, WA
109
75
22
4
7
1
9
Minneapolis, MN
72
42
22
4
2
2
10
Total¶
11,934
8,011
2,791
649
235
246
901
Omaha, NE
87
66
12
6
—
3
10
St. Louis, MO
87
44
33
5
2
3
7
St. Paul, MN
53
35
16
2
—
—
3
Wichita, KS
109
71
28
5
2
3
3
U: Unavailable. —: No reported cases.
* Mortality data in this table are voluntarily reported from 122 cities in the United States, most of which have populations of >100,000. A death is reported by the place of its occurrence and by the week that the death certificate was filed. Fetal deaths are not included.
† Pneumonia and influenza.
§ Because of changes in reporting methods in this Pennsylvania city, these numbers are partial counts for the current week. Complete counts will be available in 4 to 6 weeks.