Persons using assistive technology might not be able to fully access information in this file. For assistance, please send e-mail to: mmwrq@cdc.gov. Type 508 Accommodation and the title of the report in the subject line of e-mail.
Vital Signs: Unintentional Injury Deaths Among Persons Aged 0–19 Years — United States, 2000–2009
On April 16, 2012, this report was posted as an MMWR Early Release on the MMWR website (http://www.cdc.gov/mmwr).
Abstract
Background: Unintentional injuries are the leading cause of death in the United States for persons aged 1–19 years and the fifth leading cause of death for newborns and infants aged <1 year. This report describes 10-year trends in unintentional injury deaths among persons aged 0–19 years.
Methods: CDC analyzed 2000–2009 mortality data from the National Vital Statistics System by age group, sex, race/ethnicity, injury mechanism, and state.
Results: From 2000 to 2009, the overall annual unintentional injury death rate decreased 29%, from 15.5 to 11.0 per 100,000 population, accounting for 9,143 deaths in 2009. The rate decreased among all age groups except newborns and infants aged <1 year; in this age group, rates increased from 23.1 to 27.7 per 100,000 primarily as a result of an increase in reported suffocations. The poisoning death rate among teens aged 15–19 years nearly doubled, from 1.7 to 3.3 per 100,000, in part because of an increase in prescription drug overdoses (e.g., opioid pain relievers). Childhood motor vehicle traffic–related death rates declined 41%; however, these deaths remain the leading cause of unintentional injury death. Among states, unintentional injury death rates varied widely, from 4.0 to 25.1 per 100,000 in 2009.
Conclusions and Implications for Public Health Practice: Although the annual rate is declining, unintentional injury remains the leading cause of death among children and adolescents in the United States, led by motor vehicle traffic–related deaths. Death rates from infant suffocation and teen poisoning are increasing. The 2012 National Action Plan for Child Injury Prevention provides actions in surveillance, research, communication, education, health care, and public policy to guide efforts in saving lives by reducing injuries.
Introduction
Unintentional injuries are the leading cause of death in the United States among persons aged 1–19 years, accounting for 37% of all deaths in this age group in 2009, and the fifth leading cause of death among newborns and infants aged <1 year (1). Unintentional injury deaths are responsible for more years of potential life lost before age 65 years than cancer, heart disease, or any other cause of death, in part because children and adolescents die from unintentional injuries much more commonly than other causes (1). For every childhood injury death, more than 1,000 are treated or receive medical consultation for a nonfatal injury (2). In 2009, child and adolescent unintentional injuries resulted in approximately 9,000 deaths, 225,000 hospitalizations, and 8.4 million patients treated and released from emergency departments (1). Unintentional injuries occurring in 2005 that resulted in death, hospitalization, or an emergency department visit cost nearly $11.5 billion in medical expenses (1). These injuries are preventable (3,4), and effective interventions for reducing childhood injuries are less costly than the medical expenses and productivity losses associated with those injuries (5).
The high incidence and preventability of child and adolescent unintentional injuries highlight the need for public health action. Although unintentional injury death rates have decreased in recent decades (6), rates remain high in some population subgroups and states (7). This report summarizes trends in unintentional injury deaths among persons aged 0–19 years, from 2000 to 2009, by age group, sex, race/ethnicity, injury mechanism, and state, using data from the National Vital Statistics System.
Methods
CDC's National Vital Statistics System collects death certificate data from 50 states and the District of Columbia.* Annual mortality files were analyzed for deaths among persons aged 0–19 years. Unintentional injury deaths were defined as those with an underlying cause of death classified by International Classification of Diseases, 10th Revision (ICD-10) external cause of injury codes as V01–X59 or Y85–Y86. Deaths were categorized by mechanism as drowning, fall, fire/burn, motor vehicle traffic–related, other transportation-related, poisoning, suffocation, and all other, using the external cause-of-injury mortality matrix.† Motor vehicle traffic-related deaths were divided further into occupant, pedestrian, pedal cyclist, unspecified, and all other motor vehicle traffic–related deaths. Race/ethnicity was coded into five mutually exclusive categories: Hispanic (of any race), and four non-Hispanic racial groups (white, black, American Indian/Alaska Native, and Asian/Pacific Islander). Annual death rates were calculated using population totals from the U.S. Census.§ Weighted least squares regression was used to test for linear trends in death rates over time, using all years of data. A p value of <0.05 indicated statistical significance.
Results
From 2000 to 2009, the overall annual unintentional injury death rate declined 29% among persons aged 0–19 years, from 15.5 to 11.0 per 100,000 (Table 1). The rate for males was higher than that for females in each age group. Among both males and females, the death rate declined 29%: from 19.9 to 14.1 per 100,000 for males and from 10.8 to 7.7 per 100,000 for females. A significant linear decline across all racial/ethnic groups was observed, with declines ranging from 21% among blacks to 38% among Asian/Pacific Islanders (Table 1). American Indian/Alaska Natives had the highest death rate throughout the study period, at 30.4 per 100,000 in 2000 and 23.8 in 2009, nearly double that of blacks (16.2 and 12.8), the population with the next highest rates in 2009.
By injury mechanism, motor vehicle traffic–related death rates decreased 41%, from 9.3 to 5.5 per 100,000, yet that category recorded the most deaths in 2000 (7,497) and 2009 (4,564) to remain the leading cause of unintentional injury death among persons aged 0–19 years. Drowning, other transportation, fire/burn, fall, and all other unintentional injuries also showed significant linear declines, whereas both suffocation and poisoning showed significant linear increases (30% and 80%, respectively) (Table 1).
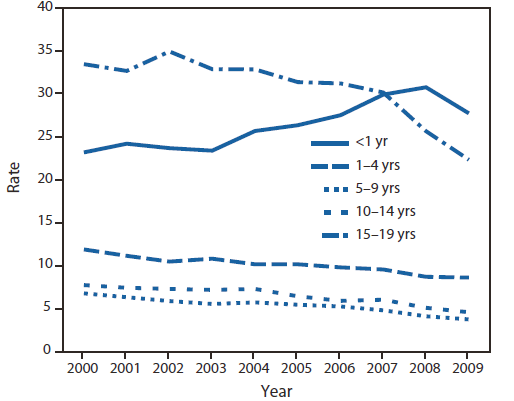
Death rates varied substantially by age group and mechanism, with the highest rates in the youngest (aged <1 year) and oldest (15–19 years) age groups (Figure). The overall rate decreased among all age groups except children aged <1 year, whose death rate increased from 23.1 to 27.7 per 100,000, surpassing rates among persons aged 15–19 years (Table 2). This increase can be attributed largely to a rise in suffocation death rates,¶ which increased from 13.8 to 21.3 per 100,000, claiming the lives of 907 newborns and infants in 2009. The death rate for those aged 15–19 years declined 33%, from 33.4 to 22.3 per 100,000, most notably as a result of a 41% decline in motor vehicle traffic–related death rates from 25.3 to 15.1 per 100,000. However, poisoning death rates in the 15–19 year age group increased by 91%, from 1.7 to 3.3 per 100,000 over the same period (Table 2).
Wide variations in death rates were found among states, with 2009 rates ranging from 4.0 per 100,000 in Massachusetts and 4.5 in New Jersey to 23.6 per 100,000 in South Dakota and 25.1 in Mississippi (Table 3). In 11 states, death rates were significantly lower than the overall national rate of 11.0 per 100,000, and 21 states had rates that were significantly higher than 11.0. No states had significant linear increases in child and adolescent unintentional injury death rates; however, 31 states showed significant linear decreases. The largest decreases occurred in Delaware, Oregon, Iowa, and Virginia, where rates declined by at least 45%.
Conclusions and Comments
This report is the first from CDC to describe trends over time in child and adolescent unintentional injury deaths by mechanism and state. Population subgroup results generally are consistent with previous research. For example, males had higher death rates than females in each age group, racial/ethnic differences were observed with the highest rates among American Indians/Alaska Natives, and motor vehicle traffic–related injuries were the leading cause of unintentional injury death among the three oldest age groups (7,8). The wide variations in death rates among states suggest that environment, exposure to hazards (e.g., vehicle miles traveled, exposure to water settings, urban or rural environment), and differences in public policy might play a role. In 2009, if the overall national rate had been equal to the lowest state unintentional injury death rate, 5,785 lives would have been saved.
The high incidence of infant suffocation underscores the importance of a safe sleeping environment as recommended by the American Academy of Pediatrics, which includes supine positioning, a firm sleep surface, room-sharing without bed-sharing, and avoiding loose bedding (9). CDC has developed the Sudden Unexpected Infant Death (SUID) Case Registry, aimed at better understanding and ultimately preventing SUID deaths, which include suffocation in bed.**
The increasing trend in poisoning deaths among those aged 15–19 years is consistent with the reported increases in drug poisoning deaths seen in the U.S. population overall during this period (10). Poisoning deaths from prescription drug misuse is a growing concern (11); during 2002–2004 an estimated 13.5% of those aged 12–17 years reported ever having misused prescription drugs (12). The percentage of poisoning deaths among those aged 15–19 years with prescription drugs as a contributing cause increased from 30% in 2000 to 57% in 2009 (13). Strategies to reduce the misuse of prescription drugs include appropriate prescribing, proper storage and disposal, discouraging medication sharing, and state-based prescription drug monitoring programs (11).
Improvements in seat belt use, child safety seat and booster seat use, licensing requirements, vehicle design, the road environment, and reductions in alcohol-impaired driving likely contributed to the decline in motor vehicle traffic–related deaths (4,14). Despite this success, traffic crashes remain the leading cause of death for persons in age groups 5–19 years, accounting for 67% of unintentional injury deaths and 28% of deaths from all causes among those aged 15–19 years in 2009 (1). Increasing seat belt use and implementing components of graduated driver licensing practices, such as limiting nighttime driving and limiting teen passengers, likely can lead to further declines. Parents can learn how to reduce their teens' risks of motor vehicle-related injury through the CDC's teen driving initiative, Parents are the Key (http://www.cdc.gov/parentsarethekey/index.html). For communities, the Guide to Community Preventive Services provides evidenced-based strategies to reduce motor vehicle traffic–related injuries (e.g., laws mandating child safety seat use and primary enforcement of seat belt use, and multiple measures to reduce alcohol-impaired driving) (http://www.thecommunityguide.org/mvoi/index.html).
Even with the reported declines, the U.S. unintentional injury death rate among persons aged 0–19 years does not compare favorably with other developed countries. Among the 34 Organization for Economic Cooperation and Development countries, the U.S. unintentional injury death rate for persons aged 0–14 years ranked 30th in 2008, with a rate four times higher than the top performing nations (15). Among persons aged 0–19 years, unintentional injury death rates in 2004 in the United States were almost twice the combined rates of high-income countries in the World Health Organization's European and Western Pacific Regions (4).
The findings in this report are subject to at least two limitations. First, fatalities are based on death certificate data and are subject to misclassification errors if a mechanism is not specified correctly on the death certificate or if classification standards have changed over time. For example, challenges in distinguishing between sudden infant death syndrome and suffocation combined with reporting differences among those completing death certificates might be contributing factors in the increase in reported suffocation deaths among newborns and infants (9). Second, this report is limited to unintentional injury deaths; excluding nonfatal injuries substantially underreports the total burden from injury on society and the medical care system (1).
The frequency and cost of child and adolescent unintentional injury deaths, along with the effectiveness of existing public health interventions, make injury prevention a priority for improving the health of children and adolescents. Efforts to prevent these deaths likely will result in fewer nonfatal injuries as well. Although unintentional injury death rates are declining, findings reported here demonstrate the need to take further action. CDC has developed the Protect the Ones You Love Initiative to help parents reduce unintentional injuries from burns, drowning, falls, poisonings, motor vehicle crashes, suffocation, and sports (http://www.cdc.gov/safechild). Health-care providers, educators, community members and others also can take steps to reduce child injury. CDC and its partners have released the National Action Plan for Child Injury Prevention, providing actions in surveillance, research, communication, education, health care, and public policy (http://www.cdc.gov/safechild/nap). Implementing the National Action Plan could result in significant reductions in needless deaths, injuries, and costs associated with injuries among children and adolescents in the United States.
Reported by
Julie Gilchrist, MD, Michael F. Ballesteros, PhD, Division of Unintentional Injury Prevention, National Center for Injury Prevention and Control, Erin M. Parker, PhD, EIS Officer, CDC. Corresponding contributor: Erin M. Parker, eparker@cdc.gov, 770-488-8477.
References
CDC. Web-based Injury Statistics Query and Reporting System (WISQARS). Atlanta, GA: US Department of Health and Human Services, CDC; 2009. Available at http://www.cdc.gov/injury/wisqars/index.html. Accessed March 13, 2012.
National Center for Health Statistics. National Health Interview Survey 2009 data release. Hyattsville, MD: CDC, National Center for Health Statistics; 2010. Available at http://www.cdc.gov/nchs/nhis/nhis_2009_data_release.htm. Accessed March 13, 2012.
Doll LS, Bonzo SE, Mercy JA, Sleet DA, eds. Handbook of injury and violence prevention. New York, NY: Springer; 2007.
Miller TR, Finkelstein AE, Zaloshnja E, Hendrie D. The cost of child and adolescent injuries and the savings from prevention. In: Liller KD, ed. Injury prevention for children and adolescents: research, practice, and advocacy. 2nd ed. Washington, DC: American Public Health Association 2012.
Singh G, Kogan M. Widening socioeconomic disparities in U.S. childhood mortality, 1969–2000. Am J Public Health 2007;97:1658–65.
Borse N, Gilchrist J, Dellinger A, Rudd R, Ballesteros M, Sleet D. CDC childhood injury report: patterns of unintentional injuries among 0–19 year olds in the United States, 2000–2006. Atlanta, GA: US Department of Health and Human Services, CDC; 2008. Available at http://www.cdc.gov/safechild/childhoodinjuryreport/index.html. Accessed March 13, 2012.
Ballesteros MF, Sleet DA. Epidemiology of injuries among children and adolescents: focus on unintentional injuries. In: Liller KD, ed. Injury prevention for children and adolescents: research, practice, and advocacy. 2nd ed. Washington, DC: American Public Health Association 2012.
Task force on Sudden Infant Death Syndrome. Moon RY. SIDS and other sleep-related infant deaths: expansion of recommendations for a safe infant sleeping environment. Pediatrics 2011;128:1030–9.
Warner M, Chen LH, Makuc DM, Anderson RN, Miniño AM. Drug poisoning deaths in the United States, 1980–2008. NCHS data brief no. 81. Hyattsville, MD: CDC, National Center for Health Statistics; 2011. Available at http://www.cdc.gov/nchs/data/databriefs/db81.htm. Accessed March 13, 2012.
Colliver JD, Kroutil LA, Dai L, Gfroerer JC. Office of Applied Studies. Misuse of prescription drugs: Data from: 2002–2004 national surveys on drug use and health. Table 5. Rockville, MD: Substance Abuse and Mental Health Services Administration, Office of Applied Studies; 2006. Available at http://www.oas.samhsa.gov/prescription/appd.htm#tab5-2b. Accessed March 13, 2012.
CDC. WONDER [Database]. Atlanta, GA: US Department of Health and Human Services, CDC; 2011. Available at http://wonder.cdc.gov/mcd-icd10.html. Accessed April 9, 2012.
Longthorne A, Subramanian R, Chen CL. An analysis of the significant decline in motor vehicle traffic crashes in 2008. DOT HS 811 346. Washington, DC: National Highway Traffic Safety Administration; 2010. Available at http://www-nrd.nhtsa.dot.gov/pubs/811346.pdf. Accessed March 13, 2012.
Global Health Observatory Data Repository. Mortality and burden of disease: disease and injury country estimates, 2008, by sex and age. Available at http://apps.who.int/ghodata. Accessed February 16, 2010.
¶ "Suffocation" refers to ICD-10 codes W75–W84. In 2009 73% of infant and newborn suffocation deaths were coded W75: accidental suffocation or strangulation in bed.
Unintentional injuries are the leading cause of death among persons aged 1–19 years and the fifth leading cause of death for newborns and infants aged <1 year. Nearly two in five deaths among persons aged 1–19 years are caused by unintentional injuries.
From 2000 to 2009, the overall unintentional injury death rate among persons aged 0–19 years decreased 29%, from 15.5 to 11.0 per 100,000. Motor vehicle traffic–related deaths declined, but remain the leading cause of injury deaths.
Wide variations in death rates were found among states with the rate for Mississippi more than six times the rate for Massachusetts.
Unintentional infant suffocation death rates increased 54% during 2000–2009, driving the overall increase in newborn and infant unintentional injury death rates.
Poisoning death rates increased 91% among persons aged 15–19 years.
Unintentional injury deaths are preventable, and efforts to increase child and adolescent safety through evidence-based prevention initiatives can reduce death rates even further.
The National Action Plan for Child Injury Prevention provides a framework to address child unintentional injury prevention with specific actions in surveillance, research, communication, education, health care, and public policy (http://www.cdc.gov/safechild/nap). Taking steps to implement the National Action Plan could result in substantial reductions in needless deaths, injuries, and costs associated with injuries among children and adolescents in the United States.
TABLE 1. Number of unintentional injury deaths and annual death rates* among persons aged =19 years, by sex, race/ethnicity, and mechanism — National Vital Statistics System, United States, 2000–2009
Sex, Race/Ethnicity, and Mechanism
No. of deaths
Death rate
% change from 2000 to 2009†
p value§
2000
2009
2000
2001
2002
2003
2004
2005
2006
2007
2008
2009
United States overall
12,441
9,143
15.5
15.0
15.3
14.8
14.9
14.4
14.2
14.0
12.2
11.0
-29
<0.001
Sex
Male
8,217
6,016
19.9
19.5
19.9
19.1
19.0
18.4
18.2
17.9
15.9
14.1
-29
<0.001
Female
4,224
3,127
10.8
10.3
10.5
10.3
10.6
10.1
9.9
9.8
8.4
7.7
-29
0.002
Race/Ethnicity
American Indian/Alaska Native
265
200
30.4
30.5
28.6
30.1
26.4
28.1
28.4
27.3
24.2
23.8
-22
<0.001
Black
2,004
1,615
16.2
16.0
16.2
14.3
15.0
15.0
15.2
15.2
13.4
12.8
-21
0.003
White
8,183
5,467
16.3
15.8
16.1
15.7
16.2
15.2
14.8
15.1
13.4
11.5
-29
0.002
Hispanic¶
1,691
1,625
12.4
12.1
12.5
12.5
11.6
12.2
12.1
10.6
9.1
8.8
-28
0.002
Asian/Pacific Islander
252
194
7.8
8.0
8.6
8.0
7.4
6.8
7.1
6.9
5.3
4.8
-38
<0.001
Missing data
46
42
NA
NA
NA
NA
NA
NA
NA
NA
NA
NA
NA
NA
Mechanism**
Motor vehicle traffic††
7,497
4,564
9.3
9.1
9.4
9.0
8.9
8.3
8.1
7.6
6.1
5.5
-41
<0.001
Occupant
3,571
1,953
4.4
4.5
5.1
4.7
4.6
4.2
3.9
3.5
2.5
2.3
-47
<0.001
Unspecified
2,794
1,866
3.5
3.2
3.0
2.9
3.0
2.8
2.9
2.9
2.5
2.2
-36
<0.001
Pedestrian
767
504
1.0
1.0
0.9
0.9
0.8
0.8
0.8
0.8
0.7
0.6
-37
<0.001
Other
185
152
0.2
0.2
0.2
0.3
0.3
0.3
0.3
0.3
0.3
0.2
-21
0.999
Pedal cyclist
180
89
0.2
0.2
0.2
0.2
0.2
0.2
0.2
0.1
0.1
0.1
-52
<0.001
Suffocation
864
1,160
1.1
1.1
1.2
1.1
1.3
1.3
1.4
1.5
1.6
1.4
30
<0.001
Drowning
1,314
983
1.6
1.5
1.4
1.3
1.3
1.4
1.3
1.3
1.2
1.2
-28
<0.001
Poisoning
442
824
0.5
0.6
0.7
0.8
0.9
0.9
1.0
1.2
1.1
1.0
80
<0.001
Other transportation
743
541
0.9
0.8
0.7
0.8
0.8
0.8
0.8
0.7
0.7
0.6
-30
0.010
Fire/Burn
682
391
0.8
0.8
0.7
0.7
0.7
0.6
0.6
0.7
0.5
0.5
-45
<0.001
Fall
180
151
0.2
0.3
0.2
0.2
0.2
0.2
0.2
0.2
0.2
0.2
-19
0.018
All other
719
529
0.9
0.9
0.9
0.8
0.8
0.9
0.8
0.8
0.7
0.6
-29
0.001
Abbreviation: NA = not applicable.
* Per 100,000 population.
† Percentage change might not match calculations because of rounding.
§ P value from weighted least squares regression to assess linear trend significance during 2000–2009.
¶ Hispanics, who might be of any race, were not inluded in any of the racial categories.
** Underlying cause of death mechanism classified by the International Classification of Diseases, 10th Revision (ICD-10) external cause of injury codes. Motor vehicle traffic: Occupant ([V30–V79](.4–.9), [V83–V86](.0–.3)), Unspecified , (V87(.0–.8), V89.2), Pedestrian ([V02–V04](.1,.9), V09.2), Other (including motorcyclist) ([V20–V28](.3–.9), V29(.4–.9), V80(.3–.5), V81.1, V82.1), and Pedal cyclist ([V12–V14](.3–.9), V19(.4–.6)). Suffocation (W75–W84); Drowning (W65–W74); Poisoning (X40–X49); Other transportation (V01, [V02–V04](.0), V05, V06, V09(.0–.1,.3,.9), V10–V11, [V12–V14](.0–.2), V15–V18, V19(.0–.3,.8,.9), [V20–V28](.0–.2), [V29–V79](.0–.3), V80(.0–.2,.6–.9), [V81–V82](.0,.2–.9), [V83–V86](.4–.9), V87.9, V88(.0–.9), V89(.0,.1,.3,.9), V90–V99)); Fire/Burn (X00–X19); Fall (W00–W19). All other (mechanisms aggregated in table): cut or pierced (W25–W29, W45, W46), unintentional firearm (W32–W34), machinery (W24, W30–W31), natural and environmental (W42–W43, W53–W64, W92–W99, X20–X39, X51–X57), overexertion (X50), struck by or against (W20–W22, W50–W52), other specified (W23, W35–W41, W44, W49, W85–W91, Y85, X58,Y86), and unspecified (X59).
†† Categorized by injured person.
Figure. Annual unintentional injury death rates* among persons aged =19 years, by age group — National Vital Statistics System, United States, 2000–2009
* Per 100,000 population.
Alternate Text: The figure above shows annual unintentional injury death rates among persons aged =19 years, by age group in the United States, during 2000-2009, according to the National Vital Statistics System. Death rates varied substantially by age group and mechanism, with the highest rates in the youngest (aged <1 year) and oldest (15-19 years) age groups.
TABLE 2. Number of unintentional injury deaths and annual death rates* among persons aged =19 years, by age group and mechanism — National Vital Statistics System, United States, 2000–2009
Age group/Mechanism
No. of deaths
Death rate
% change from 2000 to 2009†
p value§
2000
2009
2009
(%)
2000
2001
2002
2003
2004
2005
2006
2007
2008
2009
Total 0–19 yrs
12,441
9,143
(100.0)
15.5
15.0
15.3
14.8
14.9
14.4
14.2
14.0
12.2
11.0
-29
<0.001
<1 yr
Total
881
1,181
(100.0)
23.1
24.2
23.7
23.4
25.6
26.3
27.5
29.9
30.7
27.7
20
<0.001
Suffocation
526
907
(76.8)
13.8
15.2
15.9
15.3
17.7
18.2
20.2
22.3
24.7
21.3
54
<0.001
Motor vehicle traffic
162
91
(7.7)
4.3
3.4
3.0
3.6
3.4
3.4
3.3
2.8
2.3
2.1
-50
0.002
Drowning
75
45
(3.8)
2.0
1.7
1.6
1.4
1.5
1.6
1.2
1.3
1.0
1.1
-46
<0.001
Fire/Burn
39
25
(2.1)
1.0
1.2
1.0
0.8
0.7
0.9
0.7
0.9
0.5
0.6
-43
0.006
Poisoning
14
22
(1.9)
—¶
—
0.7
0.5
—
0.5
—
—
—
0.5
NA
NA
Fall
8
19
(1.6)
—
0.6
—
—
0.6
—
0.6
0.6
—
—
NA
NA
Other transportation
12
6
(0.5)
—
—
—
—
—
—
—
—
—
—
NA
NA
All other
45
66
(5.6)
1.2
1.4
1.0
1.3
1.4
1.3
1.1
1.4
1.5
1.5
31
0.120
1–4 yrs
Total
1,826
1,466
(100.0)
11.9
11.1
10.5
10.8
10.2
10.2
9.8
9.6
8.7
8.6
-28
<0.001
Drowning
493
450
(30.7)
3.2
3.0
2.9
2.9
2.7
3.0
2.8
2.8
2.6
2.6
-18
0.006
Motor vehicle traffic
563
362
(24.7)
3.7
3.6
3.4
3.2
3.2
3.0
2.9
2.6
2.1
2.1
-42
<0.001
Fire/Burn
297
169
(11.5)
1.9
1.5
1.4
1.4
1.4
1.3
1.2
1.2
1.0
1.0
-49
<0.001
Other transportation
127
147
(10.0)
0.8
0.7
0.6
0.9
0.8
1.0
0.8
0.9
0.8
0.9
4
0.161
Suffocation
151
125
(8.5)
1.0
0.9
0.9
1.0
0.8
0.8
0.8
0.9
0.9
0.7
-25
0.061
Fall
36
46
(3.1)
0.2
0.2
0.2
0.3
0.3
0.2
0.2
0.2
0.2
0.3
15
0.995
Poisoning
32
37
(2.5)
0.2
0.2
0.2
0.3
—
0.1
0.2
0.2
0.2
0.2
4
0.937
All other
127
130
(8.9)
0.8
1.0
0.8
0.8
0.8
0.8
0.8
0.8
0.9
0.8
-8
0.512
5–9 yrs
Total
1,391
773
(100.0)
6.8
6.3
5.9
5.5
5.7
5.5
5.3
4.8
4.1
3.8
-45
<0.001
Motor vehicle traffic
731
378
(48.9)
3.6
3.3
3.1
3.0
3.0
2.9
2.6
2.3
1.9
1.8
-48
<0.001
Drowning
201
119
(15.4)
1.0
0.8
0.8
0.6
0.7
0.6
0.7
0.6
0.7
0.6
-41
0.008
Fire/Burn
183
88
(11.4)
0.9
0.8
0.8
0.7
0.9
0.7
0.6
0.7
0.5
0.4
-52
<0.001
Other transportation
106
68
(8.8)
0.5
0.5
0.4
0.5
0.5
0.4
0.5
0.4
0.3
0.3
-36
0.023
Suffocation
45
26
(3.4)
0.2
0.2
0.2
0.2
0.2
0.2
0.3
0.2
0.2
0.1
-42
0.124
Poisoning
17
13
(1.7)
—
—
—
—
—
—
—
—
—
—
NA
NA
Fall
16
12
(1.6)
—
0.2
—
—
—
—
—
—
0.1
—
NA
NA
All other
92
69
(8.9)
0.4
0.4
0.5
0.4
0.4
0.5
0.4
0.5
0.3
0.3
-25
0.070
10–14 yrs
Total
1,588
916
(100.0)
7.7
7.4
7.3
7.2
7.3
6.4
5.9
6.0
5.1
4.6
-41
<0.001
Motor vehicle traffic
916
491
(53.6)
4.5
4.2
4.1
4.3
4.4
3.7
3.4
3.4
2.6
2.5
-45
<0.001
Other transportation
161
117
(12.8)
0.8
0.8
0.7
0.7
0.7
0.6
0.6
0.6
0.5
0.6
-25
<0.001
Drowning
174
90
(9.8)
0.8
0.8
0.8
0.7
0.7
0.6
0.6
0.5
0.6
0.5
-47
<0.001
Fire/Burn
84
53
(5.8)
0.4
0.4
0.5
0.4
0.4
0.4
0.3
0.4
0.3
0.3
-35
0.006
Suffocation
72
41
(4.5)
0.4
0.3
0.3
0.2
0.3
0.3
0.3
0.3
0.2
0.2
-41
0.062
Poisoning
28
37
(4.0)
0.1
0.2
0.1
0.2
0.2
0.2
0.2
0.3
0.2
0.2
36
0.116
Fall
21
16
(1.7)
0.1
0.2
0.1
0.1
0.1
—
0.1
0.1
—
—
NA
NA
All other
132
71
(7.8)
0.6
0.6
0.6
0.6
0.5
0.6
0.4
0.4
0.5
0.4
-45
0.002
15–19 yrs
Total
6,755
4,807
(100.0)
33.4
32.6
34.9
32.8
32.8
31.3
31.2
30.1
25.6
22.3
-33
0.001
Motor vehicle traffic
5,125
3,242
(67.4)
25.3
25.1
27.0
25.1
24.6
22.9
22.5
21.3
17.2
15.1
-41
<0.001
Poisoning
351
715
(14.9)
1.7
2.0
2.4
2.5
3.1
3.0
3.5
3.9
3.9
3.3
91
<0.001
Drowning
371
279
(5.8)
1.8
1.6
1.6
1.4
1.5
1.5
1.5
1.5
1.3
1.3
-29
0.006
Other transportation
337
203
(4.2)
1.7
1.3
1.2
1.4
1.3
1.3
1.2
1.2
1.3
0.9
-43
0.019
Suffocation
70
61
(1.3)
0.3
0.3
0.3
0.2
0.3
0.3
0.4
0.2
0.3
0.3
-18
0.160
Fall
99
58
(1.2)
0.5
0.4
0.4
0.4
0.4
0.4
0.4
0.4
0.4
0.3
-45
0.001
Fire/Burn
79
56
(1.2)
0.4
0.4
0.4
0.4
0.3
0.3
0.4
0.4
0.3
0.3
-33
0.040
All other
323
193
(4.0)
1.6
1.6
1.6
1.4
1.4
1.6
1.4
1.2
1.0
0.9
-44
0.001
Abbreviation: NA = not applicable.
* Per 100,000 population.
† Percentage change might not match calculations because of rounding.
§ P value from weighted least squares regression to assess linear trend significance 2000–2009.
¶ Death rates based on fewer than 20 deaths suppressed for unreliability.
TABLE 3. Number of unintentional injury deaths and annual death rates* among persons aged =19 years, by state — National Vital Statistics System, United States, 2000–2009
State
No. of deaths
Death rate
% change from 2000 to 2009†
p value§
2000
2009
2000
2001
2002
2003
2004
2005
2006
2007
2008
2009
United States overall¶
12,441
9,143
15.5
15.0
15.3
14.8
14.9
14.4
14.2
14.0
12.2
11.0
-29
<0.001
States with death rates significantly higher than overall U.S. rate of 11.0 in 2009**
Mississippi
268
216
30.7
28.9
29.8
25.9
27.4
29.7
26.8
30.7
22.2
25.1
-18
0.061
South Dakota
68
53
29.9
24.3
26.8
25.6
28.8
28.4
22.6
17.0
18.4
23.6
-21
0.030
Montana
81
51
31.5
17.2
25.3
26.3
27.6
17.7
24.6
19.7
20.9
20.5
-35
0.346
Wyoming
38
30
26.1
21.8
28.3
26.5
21.6
23.2
28.0
21.8
24.2
20.2
-23
0.236
Louisiana
304
253
22.2
24.1
25.6
21.5
25.9
24.0
21.1
21.0
23.4
20.1
-9
0.184
Oklahoma
229
200
22.8
23.3
18.5
19.0
24.2
22.4
23.1
22.1
20.0
19.5
-15
0.582
Alaska
69
39
33.2
28.4
19.7
25.9
25.0
25.7
24.3
24.1
23.3
19.0
-43
0.072
South Carolina
252
219
22.2
24.2
23.9
18.4
21.3
21.8
21.2
22.7
19.1
18.0
-19
0.071
New Mexico
118
100
20.9
18.1
21.1
22.5
20.3
20.8
18.6
18.7
14.7
17.6
-16
0.048
Arkansas
201
139
26.4
28.4
24.9
23.8
27.4
26.6
24.1
23.4
22.0
17.6
-34
0.006
Alabama
301
220
24.0
25.3
25.4
21.9
23.9
23.1
24.8
22.0
19.0
17.4
-27
0.006
North Dakota
24
29
13.1
15.5
17.0
21.3
17.4
18.8
21.4
16.7
13.2
17.3
32
0.635
Kentucky
267
190
24.0
22.2
21.9
21.4
25.5
23.0
20.1
18.3
16.3
16.8
-30
0.004
Missouri
372
266
23.3
19.3
21.8
20.9
21.1
19.6
20.1
21.1
19.6
16.6
-29
0.031
Kansas
168
119
21.0
22.5
19.9
19.7
16.3
17.0
16.0
16.1
14.0
15.1
-28
<0.001
Nevada
96
104
17.1
13.7
16.5
18.2
16.6
14.2
16.8
15.2
15.3
14.0
-18
0.317
Florida
744
621
18.4
17.6
17.4
19.1
18.9
20.3
18.5
18.6
15.2
13.7
-25
0.086
Tennessee
362
227
23.2
20.9
22.8
19.9
22.4
19.4
21.7
21.4
16.7
13.7
-41
0.009
North Carolina
376
328
17.1
17.9
18.1
18.5
19.9
17.2
16.4
16.6
15.4
12.8
-25
0.014
Indiana
324
228
18.4
16.9
16.5
15.6
18.0
16.5
17.1
16.7
16.6
12.8
-30
0.059
Texas
1,198
945
18.3
17.3
17.2
16.5
15.5
14.7
15.4
13.9
12.9
12.4
-32
<0.001
States with death rates not significantly different from overall U.S. rate of 11.0 in 2009
Idaho
78
65
18.8
23.6
19.3
17.7
18.2
17.2
20.2
18.9
15.3
13.9
-26
0.021
West Virginia
98
54
21.6
19.3
23.5
22.7
23.5
17.8
20.9
20.2
20.8
12.4
-43
0.055
Michigan
465
319
16.1
14.3
15.7
14.8
14.2
13.3
11.8
13.6
11.0
12.0
-25
<0.001
Delaware
53
28
24.3
15.5
14.5
12.1
17.4
11.5
14.4
10.8
10.3
12.0
-51
0.027
Nebraska
83
60
16.5
14.9
19.3
17.1
16.5
15.6
18.4
16.4
14.5
11.8
-28
0.104
Wisconsin
245
175
16.0
13.0
15.1
15.9
13.5
15.5
13.9
15.7
13.2
11.8
-26
0.160
Maine
50
36
14.9
16.1
15.0
12.7
15.2
15.7
15.6
12.9
12.5
11.7
-22
0.042
Arizona
279
213
18.4
20.6
17.3
17.8
18.3
17.0
17.9
16.4
12.2
11.2
-39
0.002
Utah
113
106
13.9
13.9
15.6
13.6
11.6
13.2
12.3
14.0
10.8
11.0
-21
0.022
Hawaii
33
35
10.1
10.2
14.3
13.9
9.8
8.7
11.5
10.3
8.4
10.8
8
0.390
Georgia
446
297
18.5
19.3
17.6
17.7
16.5
16.5
15.1
15.2
13.6
10.3
-44
<0.001
Iowa
155
82
18.7
13.8
14.1
16.3
13.5
14.2
11.3
15.2
12.8
10.2
-46
0.019
Pennsylvania
435
319
13.3
13.6
13.8
14.3
13.3
13.0
12.1
13.8
11.8
10.1
-24
0.015
Washington
249
174
14.8
13.6
13.8
12.0
11.9
11.2
13.3
10.5
9.7
10.0
-33
<0.001
Colorado
167
136
13.6
15.6
15.6
15.5
15.0
11.7
12.1
10.9
11.4
10.0
-27
0.002
New Hampshire
39
29
11.3
13.8
6.3
9.2
13.0
11.0
9.1
9.2
9.9
8.8
-22
0.663
Rhode Island
27
20
9.6
8.5
8.5
11.3
9.9
7.6
8.1
8.5
—§§
7.6
-21
0.079
Vermont††
28
17
16.8
—
13.4
12.3
—
22.9
—
—
16.7
—
NA
NA
States with death rates significantly lower than overall U.S. rate of 11.0 in 2009
Ohio
450
278
14.0
13.3
13.9
13.1
15.1
13.9
12.9
12.5
12.3
9.1
-35
0.018
Minnesota
205
122
14.3
13.2
15.7
14.1
12.9
10.7
11.9
10.5
9.5
8.6
-40
<0.001
Oregon
154
84
16.3
14.3
14.6
17.0
16.7
13.1
13.7
11.6
14.2
8.6
-47
0.010
Virginia
280
164
14.5
12.0
13.7
12.9
13.3
12.6
12.6
12.3
11.7
7.9
-45
0.013
Illinois
476
280
13.2
12.6
13.2
11.6
10.6
11.1
11.7
12.3
9.5
7.9
-40
0.004
Maryland
147
117
9.8
12.2
10.8
11.5
11.2
9.2
10.1
10.4
8.7
7.7
-22
0.020
California
1,038
785
10.1
9.7
10.9
10.9
10.3
11.0
10.6
9.7
7.6
7.5
-26
0.026
New York
399
334
7.7
9.0
9.0
7.6
7.8
7.3
7.5
7.7
6.6
6.7
-13
0.011
Connecticut
77
59
8.3
9.3
9.5
7.9
9.8
8.3
8.4
9.2
7.6
6.4
-22
0.076
New Jersey
180
102
7.9
9.2
9.1
7.4
8.1
7.5
7.7
7.9
7.2
4.5
-43
0.013
Massachusetts
120
66
7.2
7.8
6.6
7.4
7.0
6.9
6.7
7.6
5.6
4.0
-44
0.017
Abbreviation: NA = not applicable.
* Per 100,000 population.
† Percentage change might not match calculations because of rounding.
§ P value from weighted least squares regression to assess linear trend significance during 2000–2009.
¶ The District of Columbia was excluded because of low death counts in all years; however District of Columbia deaths are included in the overall U.S. death rate.
** Significance determined using Z-test for states with =100 deaths and 95% confidence intervals from a gamma distribution for states with <100 deaths in 2009.
†† With 17 deaths, rate for Vermont in 2009 was unstable and thus cannot be statistically compared with the overall U.S. death rate.
§§ Death rates based on fewer than 20 deaths have been suppressed for unreliability.