Persons using assistive technology might not be able to fully access information in this file. For assistance, please send e-mail to: mmwrq@cdc.gov. Type 508 Accommodation and the title of the report in the subject line of e-mail.
Notifiable Diseases and Mortality Tables
Table I Summary of provisional cases of selected notifiable diseases, United States, cumulative, week ending May 12, 2012 (19th Week)
Figure I Selected notifiable disease reports, United States, comparison of provisional 4-week totals ending May 12, 2012, with historical data
Table II Provisional cases of selected notifiable diseases, United States, weeks ending May 12, 2012 and May 14, 2011 (19th Week)
Table III Deaths in 122 U.S. cities, week ending May 12, 2012 (19th Week)
TABLE I. Provisional cases of infrequently reported notifiable diseases (<1,000 cases reported during the preceding year) — United States, week ending May 12, 2012 (19th week)*
TABLE I. (Continued) Provisional cases of infrequently reported notifiable diseases (<1,000 cases reported during the preceding year) — United States, week ending May 12, 2012 (19th week)*
—: No reported cases. N: Not reportable. NN: Not Nationally Notifiable. Cum: Cumulative year-to-date counts.
§ Not reportable in all states. Data from states where the condition is not reportable are excluded from this table except starting in 2007 for the arboviral diseases, STD data, TB data, and influenza-associated pediatric mortality, and in 2003 for SARS-CoV. Reporting exceptions are available at http://www.cdc.gov/osels/ph_surveillance/nndss/phs/infdis.htm.
¶ Includes both neuroinvasive and nonneuroinvasive. Updated weekly from reports to the Division of Vector-Borne Infectious Diseases, National Center for Zoonotic, Vector-Borne, and Enteric Diseases (ArboNET Surveillance). Data for West Nile virus are available in Table II.
** Data for H. influenzae (all ages, all serotypes) are available in Table II.
†† Updated weekly from reports to the Influenza Division, National Center for Immunization and Respiratory Diseases. Since October 2, 2011, 24 influenza-associated pediatric deaths occurring during the 2011-12 influenza season have been reported.
§§ No measles cases were reported for the current week.
¶¶ Data for meningococcal disease (all serogroups) are available in Table II.
*** CDC discontinued reporting of individual confirmed and probable cases of 2009 pandemic influenza A (H1N1) virus infections on July 24, 2009. During 2009, four cases of human infection with novel influenza A viruses, different from the 2009 pandemic influenza A (H1N1) strain, were reported to CDC. The four cases of novel influenza A virus infection reported to CDC during 2010, the eight cases reported during 2011, and the one case reported in 2012 are different than the 2009 pandemic influenza A (H1N1) virus. Total case counts are provided by the Influenza Division, National Center for Immunization and Respiratory Diseases (NCIRD).
††† No rubella cases were reported for the current week.
§§§ Updated weekly from reports to the Division of STD Prevention, National Center for HIV/AIDS, Viral Hepatitis, STD, and TB Prevention.
¶¶¶ There were no cases of viral hemorrhagic fever reported during the current week. See Table II for dengue hemorrhagic fever.
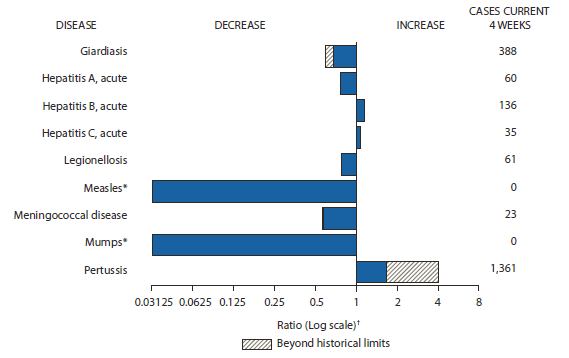
FIGURE I. Selected notifiable disease reports, United States, comparison of provisional 4-week totals May 12, 2012, with historical data
* No measles or mumps cases were reported for the current 4-week period yielding a ratio for week 19 of zero (0).
† Ratio of current 4-week total to mean of 15 4-week totals (from previous, comparable, and subsequent 4-week periods for the past 5 years). The point where the hatched area begins is based on the mean and two standard deviations of these 4-week totals.
Alternate Text: The figure above shows selected notifiable disease reports for the United States, with comparison of provisional 4-week totals through May 12, 2012, with historical data. Reports of acute hepatitis B, acute hepatitis C, and pertussis increased, with pertussis increasing beyond historical limits. Reports of giardiasis, acute hepatitis A, legionellosis, measles, meningococcal disease, and mumps all decreased, with giardiasis, and meningococcal disease decreasing beyond historical limits.
TABLE II. Provisional cases of selected notifiable diseases, United States, weeks ending May 12, 2012, and May 14, 2011 (19th week)*
Reporting area
Chlamydia trachomatis infection
Coccidioidomycosis
Cryptosporidiosis
Current week
Previous 52 weeks
Cum 2012
Cum 2011
Current week
Previous 52 weeks
Cum 2012
Cum 2011
Current week
Previous 52 weeks
Cum 2012
Cum 2011
Med
Max
Med
Max
Med
Max
United States
11,984
26,833
30,517
430,771
504,980
55
406
591
5,994
8,022
54
144
414
1,817
2,151
New England
580
874
1,807
14,440
15,692
—
0
1
1
1
—
6
22
83
119
Connecticut
23
227
1,268
2,044
3,177
N
0
0
N
N
—
1
8
11
20
Maine
2
59
99
1,044
1,135
N
0
0
N
N
—
1
3
14
19
Massachusetts
441
433
680
8,150
8,166
N
0
0
N
N
—
2
8
39
51
New Hampshire
—
60
86
885
1,037
—
0
0
—
1
—
1
5
9
14
Rhode Island
88
80
186
1,806
1,622
—
0
1
1
—
—
0
10
2
1
Vermont
26
26
66
511
555
N
0
0
N
N
—
1
5
8
14
Mid. Atlantic
1,761
3,522
4,469
62,333
65,202
—
0
0
—
—
2
15
44
189
249
New Jersey
177
534
634
9,465
9,501
N
0
0
N
N
—
1
4
11
18
New York (Upstate)
728
724
2,215
12,915
12,673
N
0
0
N
N
—
4
16
36
46
New York City
—
1,236
1,491
19,811
23,956
N
0
0
N
N
—
2
6
31
27
Pennsylvania
856
1,084
1,305
20,142
19,072
N
0
0
N
N
2
7
27
111
158
E.N. Central
1,299
4,203
4,718
64,034
81,166
3
1
5
19
16
11
33
150
440
494
Illinois
—
1,201
1,499
13,597
23,761
N
0
0
N
N
—
3
26
35
53
Indiana
119
537
699
9,000
10,505
N
0
0
N
N
—
3
11
32
96
Michigan
744
923
1,210
16,551
18,740
1
0
3
11
9
—
7
14
86
78
Ohio
267
1,031
1,180
16,889
19,140
2
0
2
8
7
10
13
95
184
137
Wisconsin
169
465
608
7,997
9,020
N
0
0
N
N
1
8
73
103
130
W.N. Central
24
1,473
1,825
10,979
28,327
—
1
7
4
56
8
18
92
189
316
Iowa
—
207
439
2,083
3,990
N
0
0
N
N
—
5
18
67
117
Kansas
—
201
277
128
3,726
N
0
0
N
N
—
0
11
4
—
Minnesota
—
328
408
4,863
5,920
—
1
6
—
47
—
4
17
—
66
Missouri
—
497
683
—
10,187
—
0
2
3
8
2
5
60
58
59
Nebraska
—
125
218
1,723
2,304
—
0
2
1
1
6
2
12
28
44
North Dakota
—
47
78
844
876
N
0
0
N
N
—
0
12
—
—
South Dakota
24
64
92
1,338
1,324
N
0
0
N
N
—
2
13
32
30
S. Atlantic
4,065
5,454
7,586
99,913
102,321
—
0
2
1
2
12
23
55
382
386
Delaware
56
81
182
1,346
1,672
—
0
0
—
—
—
0
4
7
2
District of Columbia
160
128
224
2,551
2,440
—
0
0
—
—
—
0
1
—
4
Florida
993
1,502
1,700
27,729
28,076
N
0
0
N
N
7
8
17
156
139
Georgia
740
1,068
1,568
19,050
19,023
N
0
0
N
N
3
5
13
78
122
Maryland
—
491
824
6,095
9,585
—
0
2
1
2
—
2
7
37
20
North Carolina
1,286
991
1,688
17,613
16,598
N
0
0
N
N
—
0
46
35
23
South Carolina
—
518
1,278
10,275
10,334
N
0
0
N
N
1
2
6
25
43
Virginia
744
670
1,780
13,507
13,042
N
0
0
N
N
1
3
8
43
25
West Virginia
86
83
146
1,747
1,551
N
0
0
N
N
—
0
4
1
8
E.S. Central
639
1,912
2,820
32,070
35,131
—
0
0
—
—
1
7
26
89
96
Alabama
—
525
1,284
5,966
10,396
N
0
0
N
N
—
2
7
31
43
Kentucky
326
332
524
6,114
5,465
N
0
0
N
N
—
1
18
11
23
Mississippi
—
429
1,168
8,138
7,924
N
0
0
N
N
—
1
4
15
9
Tennessee
313
628
827
11,852
11,346
N
0
0
N
N
1
2
6
32
21
W.S. Central
2,345
3,457
4,308
59,442
65,094
—
0
1
—
4
4
11
45
113
109
Arkansas
333
323
412
6,308
5,980
N
0
0
N
N
—
0
2
9
5
Louisiana
543
576
1,120
6,705
8,482
—
0
1
—
4
1
2
10
27
14
Oklahoma
—
85
675
1,315
4,427
N
0
0
N
N
2
1
6
21
23
Texas
1,469
2,412
3,101
45,114
46,205
N
0
0
N
N
1
6
41
56
67
Mountain
403
1,700
2,415
28,286
32,178
45
303
480
4,847
6,226
4
10
29
152
187
Arizona
138
559
859
9,356
10,113
44
298
479
4,781
6,133
—
1
4
8
12
Colorado
—
393
705
6,221
7,998
N
0
0
N
N
—
2
11
21
54
Idaho
—
85
277
1,356
1,515
N
0
0
N
N
2
2
9
37
30
Montana
72
70
97
1,464
1,230
N
0
0
N
N
1
2
6
28
19
Nevada
193
208
285
3,347
3,992
1
2
6
46
31
1
0
2
5
4
New Mexico
—
219
395
4,168
3,980
—
1
7
6
37
—
2
9
37
39
Utah
—
135
191
2,266
2,590
—
1
5
12
22
—
1
5
9
18
Wyoming
—
23
67
108
760
—
0
2
2
3
—
0
3
7
11
Pacific
868
4,000
5,072
59,274
79,869
7
99
178
1,122
1,717
12
11
23
180
195
Alaska
37
107
152
2,036
2,256
N
0
0
N
N
1
0
3
1
4
California
243
3,055
4,094
41,327
61,941
7
99
178
1,122
1,717
8
6
16
102
91
Hawaii
—
116
148
1,686
2,169
N
0
0
N
N
—
0
1
2
—
Oregon
265
269
367
5,336
5,001
N
0
0
N
N
2
4
10
59
75
Washington
323
460
764
8,889
8,502
N
0
0
N
N
1
1
8
16
25
Territories
American Samoa
—
0
0
—
—
N
0
0
N
N
N
0
0
N
N
C.N.M.I.
—
—
—
—
—
—
—
—
—
—
—
—
—
—
—
Guam
—
—
—
—
189
—
—
—
—
—
—
—
—
—
—
Puerto Rico
107
104
348
2,430
2,257
N
0
0
N
N
N
0
0
N
N
U.S. Virgin Islands
—
15
24
163
296
—
0
0
—
—
—
0
0
—
—
C.N.M.I.: Commonwealth of Northern Mariana Islands.
U: Unavailable. —: No reported cases. N: Not reportable. NN: Not Nationally Notifiable. Cum: Cumulative year-to-date counts. Med: Median. Max: Maximum.
† Data for meningococcal disease, invasive caused by serogroups A, C, Y, and W-135; serogroup B; other serogroup; and unknown serogroup are available in Table I.
TABLE II. (Continued) Provisional cases of selected notifiable diseases, United States, weeks ending May 12, 2012, and May 14, 2011 (19th week)*
Reporting area
Rabies, animal
Salmonellosis
Shiga toxin-producing E. coli(STEC)†
Current week
Previous 52 weeks
Cum 2012
Cum 2011
Current week
Previous 52 weeks
Cum 2012
Cum 2011
Current week
Previous 52 weeks
Cum 2012
Cum 2011
Med
Max
Med
Max
Med
Max
United States
43
76
136
999
1,391
330
962
1,948
9,615
11,065
39
109
257
1,034
1,140
New England
2
7
16
139
85
6
35
86
417
611
—
3
12
32
45
Connecticut
—
4
10
67
47
1
7
30
103
135
—
1
4
13
16
Maine
1
2
6
40
15
2
2
7
31
41
—
0
3
—
5
Massachusetts
—
0
0
—
—
—
16
44
206
276
—
1
9
16
13
New Hampshire
1
0
3
10
6
—
3
8
23
49
—
0
3
2
8
Rhode Island
—
0
6
8
5
3
1
12
32
96
—
0
2
—
1
Vermont
—
0
4
14
12
—
2
8
22
14
—
0
3
1
2
Mid. Atlantic
12
14
36
145
248
40
96
209
1,161
1,287
4
11
35
106
151
New Jersey
—
0
0
—
—
—
21
49
226
276
—
2
8
8
46
New York (Upstate)
12
7
20
101
92
27
25
67
336
279
3
3
13
42
35
New York City
—
0
3
—
2
3
20
44
270
288
—
2
6
24
21
Pennsylvania
—
7
16
44
154
10
30
114
329
444
1
3
17
32
49
E.N. Central
1
3
20
25
24
29
79
186
1,006
1,312
5
16
50
153
193
Illinois
1
0
6
7
5
—
27
80
331
465
—
4
14
27
37
Indiana
—
0
7
—
1
—
12
36
120
147
—
2
10
22
34
Michigan
—
1
6
12
9
8
16
42
213
186
—
3
13
59
29
Ohio
—
0
6
6
9
21
22
46
298
310
5
3
9
36
41
Wisconsin
N
0
0
N
N
—
10
48
44
204
—
4
22
9
52
W.N. Central
—
2
8
25
36
13
46
113
469
759
4
18
58
146
151
Iowa
—
0
4
—
4
1
7
19
101
134
—
2
15
16
32
Kansas
—
0
3
7
12
—
9
27
54
96
—
2
8
5
18
Minnesota
—
0
0
—
—
—
10
33
—
199
—
4
24
—
40
Missouri
—
0
4
11
6
8
16
42
221
221
4
6
31
97
40
Nebraska
—
0
3
—
10
4
4
13
62
57
—
2
7
18
15
North Dakota
—
0
4
7
4
—
0
15
—
—
—
0
4
—
—
South Dakota
—
0
0
—
—
—
2
10
31
52
—
1
4
10
6
S. Atlantic
5
19
55
311
447
131
300
713
2,990
2,811
6
12
32
156
160
Delaware
—
0
0
—
—
—
3
12
36
34
—
0
2
3
3
District of Columbia
—
0
0
—
—
—
1
6
—
21
—
0
1
1
2
Florida
—
0
34
47
120
88
107
203
1,274
1,106
6
4
9
74
30
Georgia
—
0
0
—
—
12
42
112
405
563
—
2
7
21
34
Maryland
—
7
14
91
114
15
18
45
252
230
—
1
4
12
19
North Carolina
—
0
0
—
—
—
37
251
506
403
—
2
26
19
38
South Carolina
N
0
0
N
N
4
26
71
230
221
—
0
2
5
7
Virginia
5
10
27
146
211
12
22
57
268
208
—
2
8
19
26
West Virginia
—
1
37
27
2
—
0
52
19
25
—
0
2
2
1
E.S. Central
—
2
7
26
68
11
64
191
633
680
10
5
18
73
44
Alabama
—
1
5
22
32
3
20
70
186
181
1
1
15
19
7
Kentucky
—
0
2
4
5
—
9
30
91
126
—
1
5
12
13
Mississippi
—
0
0
—
—
2
20
87
170
166
—
0
4
6
7
Tennessee
—
0
4
—
31
6
15
51
186
207
9
2
11
36
17
W.S. Central
23
18
40
268
437
28
156
374
1,201
1,390
6
11
90
130
99
Arkansas
3
0
15
58
36
7
14
52
124
135
4
1
6
18
7
Louisiana
—
0
0
—
—
1
24
69
199
253
—
0
3
4
3
Oklahoma
13
0
21
20
11
13
14
102
124
115
2
1
16
17
9
Texas
7
16
35
190
390
7
103
227
754
887
—
7
74
91
80
Mountain
—
1
5
29
3
19
44
96
560
748
4
10
46
113
152
Arizona
N
0
0
N
N
6
15
36
191
253
2
2
6
42
44
Colorado
—
0
0
—
—
—
10
23
145
166
—
3
9
25
38
Idaho
—
0
1
—
—
5
2
8
30
51
1
2
8
16
18
Montana
N
0
0
N
N
2
2
10
25
27
1
0
4
9
8
Nevada
—
0
3
1
—
5
3
7
46
54
—
0
7
6
14
New Mexico
—
0
4
28
3
—
5
21
53
72
—
0
3
9
14
Utah
—
0
2
—
—
—
6
12
59
104
—
1
29
2
14
Wyoming
—
0
0
—
—
1
1
9
11
21
—
0
7
4
2
Pacific
—
4
14
31
43
53
97
184
1,178
1,467
—
16
37
125
145
Alaska
—
0
1
5
11
—
1
6
20
23
—
0
1
1
—
California
—
4
13
26
28
33
68
140
828
1,100
—
8
20
46
103
Hawaii
—
0
0
—
—
—
6
14
54
100
—
0
2
4
2
Oregon
—
0
2
—
4
—
6
16
100
113
—
2
11
42
18
Washington
—
0
11
—
—
20
11
42
176
131
—
3
18
32
22
Territories
American Samoa
N
0
0
N
N
—
0
1
1
—
—
0
0
—
—
C.N.M.I.
—
—
—
—
—
—
—
—
—
—
—
—
—
—
—
Guam
—
—
—
—
—
—
—
—
—
6
—
—
—
—
—
Puerto Rico
—
1
6
27
13
—
7
21
22
145
—
0
0
—
—
U.S. Virgin Islands
—
0
0
—
—
—
0
0
—
—
—
0
0
—
—
C.N.M.I.: Commonwealth of Northern Mariana Islands.
U: Unavailable. —: No reported cases. N: Not reportable. NN: Not Nationally Notifiable. Cum: Cumulative year-to-date counts. Med: Median. Max: Maximum.
† Illnesses with similar clinical presentation that result from Spotted fever group rickettsia infections are reported as Spotted fever rickettsioses. Rocky Mountain spotted fever (RMSF) caused by Rickettsia rickettsii, is the most common and well-known spotted fever.
TABLE II. (Continued) Provisional cases of selected notifiable diseases, United States, weeks ending May 12, 2012, and May 14, 2011 (19th week)*
Reporting area
Streptococcus pneumoniae,† invasive disease
Syphilis, primary and secondary
All ages
Age <5
Current week
Previous 52 weeks
Cum 2012
Cum 2011
Current week
Previous 52 weeks
Cum 2012
Cum 2011
Current week
Previous 52 weeks
Cum 2012
Cum 2011
Med
Max
Med
Max
Med
Max
United States
178
276
763
6,057
8,478
15
21
55
398
570
99
268
311
4,134
4,928
New England
6
13
28
274
419
—
1
4
20
22
1
7
23
144
140
Connecticut
1
6
13
137
194
—
0
2
6
6
—
0
13
9
19
Maine
5
2
8
51
56
—
0
1
1
2
—
0
2
7
8
Massachusetts
—
1
4
18
16
—
0
3
9
8
—
5
10
91
89
New Hampshire
—
1
6
34
58
—
0
1
4
2
1
0
2
14
11
Rhode Island
—
1
5
12
59
—
0
1
—
1
—
1
7
21
9
Vermont
—
1
4
22
36
—
0
2
—
3
—
0
2
2
4
Mid. Atlantic
20
45
157
969
1,305
1
2
11
42
65
15
32
49
473
618
New Jersey
—
11
26
235
374
—
0
2
11
25
—
3
8
40
95
New York (Upstate)
14
19
108
444
560
1
1
10
21
21
2
4
12
68
59
New York City
6
12
23
290
371
—
0
3
10
19
—
17
27
221
329
Pennsylvania
N
0
0
N
N
N
0
0
N
N
13
7
17
144
135
E.N. Central
48
61
101
1,272
1,648
3
3
9
79
95
—
33
48
346
699
Illinois
N
0
0
N
N
—
0
0
—
—
—
12
26
120
326
Indiana
—
11
33
212
412
—
0
2
9
19
—
3
9
65
63
Michigan
1
12
25
250
349
—
0
2
18
22
—
4
13
58
110
Ohio
28
25
46
601
631
3
1
6
37
43
—
7
15
85
178
Wisconsin
19
9
22
209
256
—
0
2
15
11
—
1
6
18
22
W.N. Central
1
12
35
233
284
—
1
3
14
23
—
4
13
29
125
Iowa
N
0
0
N
N
N
0
0
N
N
—
0
3
4
10
Kansas
N
0
0
N
N
N
0
0
N
N
—
0
4
—
6
Minnesota
—
10
26
160
224
—
1
3
9
19
—
2
8
23
52
Missouri
N
0
0
N
N
—
0
0
—
—
—
1
8
—
53
Nebraska
1
3
8
73
60
—
0
2
5
4
—
0
2
1
4
North Dakota
—
0
26
—
—
—
0
1
—
—
—
0
1
1
—
South Dakota
N
0
0
N
N
—
0
0
—
—
—
0
0
—
—
S. Atlantic
50
59
195
1,414
2,158
5
4
21
96
152
30
67
98
1,073
1,200
Delaware
2
1
5
19
28
—
0
0
—
—
—
0
6
19
4
District of Columbia
—
0
5
2
26
—
0
1
1
3
5
3
9
78
71
Florida
26
21
48
472
733
3
2
8
34
65
2
25
36
408
435
Georgia
14
19
47
432
683
1
2
6
34
43
13
12
59
194
197
Maryland
6
8
22
154
311
1
1
5
13
19
—
8
15
109
164
North Carolina
N
0
0
N
N
N
0
0
N
N
7
7
21
121
169
South Carolina
2
7
16
178
267
—
0
2
6
17
—
4
11
68
75
Virginia
N
0
0
N
N
—
0
0
—
—
3
3
13
75
83
West Virginia
—
3
83
157
110
—
0
8
8
5
—
0
2
1
2
E.S. Central
13
22
50
448
607
—
2
5
26
39
7
15
32
220
267
Alabama
N
0
0
N
N
N
0
0
N
N
—
4
10
33
81
Kentucky
3
4
9
100
123
—
0
1
3
12
4
2
9
43
40
Mississippi
N
0
0
N
N
—
0
0
—
—
—
3
21
65
44
Tennessee
10
18
47
348
484
—
1
4
23
27
3
5
14
79
102
W.S. Central
34
33
184
726
952
5
3
11
61
90
28
39
51
748
629
Arkansas
6
4
14
86
118
1
0
3
10
10
8
4
15
87
66
Louisiana
—
3
18
75
122
—
0
2
5
12
—
8
19
95
141
Oklahoma
N
0
0
N
N
—
0
0
—
—
—
1
6
15
20
Texas
28
25
152
565
712
4
2
10
46
68
20
24
41
551
402
Mountain
6
28
47
671
1,025
1
2
6
49
80
1
12
21
149
229
Arizona
2
11
27
345
457
—
1
4
26
31
—
4
11
60
89
Colorado
—
8
17
182
268
—
0
3
10
20
—
2
6
36
46
Idaho
N
0
0
N
N
—
0
0
—
—
—
0
3
8
2
Montana
N
0
0
N
N
N
0
0
N
N
—
0
1
—
5
Nevada
N
0
0
N
N
N
0
0
N
N
1
2
7
28
54
New Mexico
4
5
15
133
180
1
0
4
12
14
—
1
4
13
27
Utah
—
1
9
—
105
—
0
2
—
15
—
0
2
4
6
Wyoming
—
0
3
11
15
—
0
1
1
—
—
0
0
—
—
Pacific
—
2
9
50
80
—
0
2
11
4
17
57
74
952
1,021
Alaska
—
2
9
49
79
—
0
2
11
4
—
0
2
4
—
California
N
0
0
N
N
N
0
0
N
N
12
48
64
790
849
Hawaii
—
0
1
1
1
—
0
1
—
—
—
0
3
1
6
Oregon
N
0
0
N
N
N
0
0
N
N
1
2
12
65
29
Washington
N
0
0
N
N
N
0
0
N
N
4
5
12
92
137
Territories
American Samoa
N
0
0
N
N
—
0
0
—
—
—
0
0
—
—
C.N.M.I.
—
—
—
—
—
—
—
—
—
—
—
—
—
—
—
Guam
—
—
—
—
—
—
—
—
—
—
—
—
—
—
—
Puerto Rico
—
0
0
—
—
—
0
0
—
—
4
5
15
87
79
U.S. Virgin Islands
—
0
0
—
—
—
0
0
—
—
—
0
0
—
—
C.N.M.I.: Commonwealth of Northern Mariana Islands.
U: Unavailable. —: No reported cases. N: Not reportable. NN: Not Nationally Notifiable. Cum: Cumulative year-to-date counts. Med: Median. Max: Maximum.
† Includes drug resistant and susceptible cases of invasive Streptococcus pneumoniae disease among children <5 years and among all ages. Case definition: Isolation of S. pneumoniae from a normally sterile body site (e.g., blood or cerebrospinal fluid).
TABLE II. (Continued) Provisional cases of selected notifiable diseases, United States, weeks ending May 12, 2012, and May 14, 2011 (19th week)*
Reporting area
Varicella (chickenpox)
West Nile virus disease†
Neuroinvasive
Nonneuroinvasive§
Current week
Previous 52 weeks
Cum 2012
Cum 2011
Current week
Previous 52 weeks
Cum 2012
Cum 2011
Current week
Previous 52 weeks
Cum 2012
Cum 2011
Med
Max
Med
Max
Med
Max
United States
163
301
432
5,315
6,036
—
0
63
1
1
—
0
33
—
1
New England
9
27
53
472
481
—
0
3
—
—
—
0
1
—
—
Connecticut
1
5
20
80
92
—
0
2
—
—
—
0
1
—
—
Maine
3
4
14
102
96
—
0
0
—
—
—
0
0
—
—
Massachusetts
—
11
19
207
179
—
0
2
—
—
—
0
1
—
—
New Hampshire
—
1
10
—
54
—
0
0
—
—
—
0
0
—
—
Rhode Island
3
1
6
26
18
—
0
1
—
—
—
0
0
—
—
Vermont
2
2
9
57
42
—
0
1
—
—
—
0
0
—
—
Mid. Atlantic
25
57
88
912
657
—
0
11
—
—
—
0
6
—
—
New Jersey
11
35
70
583
214
—
0
1
—
—
—
0
2
—
—
New York (Upstate)
N
0
0
N
N
—
0
5
—
—
—
0
4
—
—
New York City
—
0
0
—
—
—
0
4
—
—
—
0
1
—
—
Pennsylvania
14
19
39
329
443
—
0
2
—
—
—
0
1
—
—
E.N. Central
55
70
127
1,299
1,559
—
0
13
—
—
—
0
7
—
—
Illinois
10
17
38
372
364
—
0
6
—
—
—
0
5
—
—
Indiana
7
6
20
152
105
—
0
2
—
—
—
0
1
—
—
Michigan
12
19
45
381
433
—
0
7
—
—
—
0
2
—
—
Ohio
26
20
47
393
460
—
0
3
—
—
—
0
3
—
—
Wisconsin
—
4
14
1
197
—
0
1
—
—
—
0
1
—
—
W.N. Central
—
12
32
181
296
—
0
9
1
1
—
0
7
—
—
Iowa
N
0
0
N
N
—
0
2
1
—
—
0
2
—
—
Kansas
—
7
21
85
148
—
0
1
—
—
—
0
0
—
—
Minnesota
—
0
1
—
—
—
0
1
—
—
—
0
1
—
—
Missouri
—
5
18
81
97
—
0
2
—
1
—
0
2
—
—
Nebraska
—
0
3
4
11
—
0
4
—
—
—
0
3
—
—
North Dakota
—
0
7
—
17
—
0
1
—
—
—
0
1
—
—
South Dakota
—
1
6
11
23
—
0
0
—
—
—
0
1
—
—
S. Atlantic
13
30
55
565
845
—
0
12
—
—
—
0
6
—
—
Delaware
—
0
2
2
3
—
0
1
—
—
—
0
0
—
—
District of Columbia
—
0
2
—
9
—
0
3
—
—
—
0
3
—
—
Florida
12
17
50
459
419
—
0
4
—
—
—
0
2
—
—
Georgia
N
0
0
N
N
—
0
4
—
—
—
0
1
—
—
Maryland
N
0
0
N
N
—
0
5
—
—
—
0
3
—
—
North Carolina
N
0
0
N
N
—
0
1
—
—
—
0
0
—
—
South Carolina
—
0
2
—
10
—
0
0
—
—
—
0
0
—
—
Virginia
1
8
24
75
186
—
0
2
—
—
—
0
1
—
—
West Virginia
—
4
16
29
218
—
0
1
—
—
—
0
0
—
—
E.S. Central
2
5
14
97
139
—
0
11
—
—
—
0
5
—
1
Alabama
2
5
14
91
131
—
0
2
—
—
—
0
0
—
—
Kentucky
N
0
0
N
N
—
0
2
—
—
—
0
1
—
—
Mississippi
—
0
3
6
8
—
0
5
—
—
—
0
4
—
1
Tennessee
N
0
0
N
N
—
0
3
—
—
—
0
1
—
—
W.S. Central
47
56
219
1,140
1,120
—
0
4
—
—
—
0
3
—
—
Arkansas
—
4
28
77
129
—
0
1
—
—
—
0
0
—
—
Louisiana
—
1
6
20
37
—
0
1
—
—
—
0
2
—
—
Oklahoma
N
0
0
N
N
—
0
1
—
—
—
0
0
—
—
Texas
47
49
210
1,043
954
—
0
3
—
—
—
0
3
—
—
Mountain
11
29
60
604
874
—
0
11
—
—
—
0
5
—
—
Arizona
1
10
26
201
352
—
0
7
—
—
—
0
4
—
—
Colorado
6
7
32
188
185
—
0
2
—
—
—
0
2
—
—
Idaho
N
0
0
N
N
—
0
1
—
—
—
0
1
—
—
Montana
4
2
7
41
104
—
0
1
—
—
—
0
0
—
—
Nevada
N
0
0
N
N
—
0
4
—
—
—
0
2
—
—
New Mexico
—
1
8
48
22
—
0
1
—
—
—
0
0
—
—
Utah
—
5
20
118
204
—
0
1
—
—
—
0
1
—
—
Wyoming
—
0
2
8
7
—
0
1
—
—
—
0
1
—
—
Pacific
1
2
9
45
65
—
0
18
—
—
—
0
8
—
—
Alaska
1
1
4
27
26
—
0
0
—
—
—
0
0
—
—
California
—
0
4
7
19
—
0
18
—
—
—
0
8
—
—
Hawaii
—
0
4
11
20
—
0
0
—
—
—
0
0
—
—
Oregon
N
0
0
N
N
—
0
0
—
—
—
0
0
—
—
Washington
N
0
0
N
N
—
0
0
—
—
—
0
0
—
—
Territories
American Samoa
N
0
0
N
N
—
0
0
—
—
—
0
0
—
—
C.N.M.I.
—
—
—
—
—
—
—
—
—
—
—
—
—
—
—
Guam
—
—
—
—
16
—
—
—
—
—
—
—
—
—
—
Puerto Rico
4
6
14
57
175
—
0
0
—
—
—
0
0
—
—
U.S. Virgin Islands
—
0
0
—
—
—
0
0
—
—
—
0
0
—
—
C.N.M.I.: Commonwealth of Northern Mariana Islands.
U: Unavailable. —: No reported cases. N: Not reportable. NN: Not Nationally Notifiable. Cum: Cumulative year-to-date counts. Med: Median. Max: Maximum.
† Updated weekly from reports to the Division of Vector-Borne Infectious Diseases, National Center for Zoonotic, Vector-Borne, and Enteric Diseases (ArboNET Surveillance). Data for California serogroup, eastern equine, Powassan, St. Louis, and western equine diseases are available in Table I.
§ Not reportable in all states. Data from states where the condition is not reportable are excluded from this table, except starting in 2007 for the domestic arboviral diseases and influenza-associated pediatric mortality, and in 2003 for SARS-CoV. Reporting exceptions are available at http://www.cdc.gov/osels/ph_surveillance/nndss/phs/infdis.htm.
TABLE III. Deaths in 122 U.S. cities,* week ending May 12, 2012 (19th week)
Reporting area
All causes, by age (years)
P&I† Total
Reporting area (Continued)
All causes, by age (years)
P&I† Total
All Ages
=65
45–64
25–44
1–24
<1
All Ages
=65
45–64
25–44
1–24
<1
New England
504
362
103
27
6
6
44
S. Atlantic
863
514
235
69
22
23
57
Boston, MA
134
84
35
9
3
3
10
Atlanta, GA
133
78
39
10
2
4
7
Bridgeport, CT
38
26
6
5
—
1
5
Baltimore, MD
129
71
37
15
4
2
8
Cambridge, MA
13
7
6
—
—
—
2
Charlotte, NC
125
77
31
11
3
3
5
Fall River, MA
24
15
6
3
—
—
—
Jacksonville, FL
1
—
1
—
—
—
—
Hartford, CT
53
43
7
3
—
—
8
Miami, FL
92
58
26
4
1
3
8
Lowell, MA
21
15
3
2
—
1
5
Norfolk, VA
51
31
10
5
4
1
—
Lynn, MA
9
5
4
—
—
—
—
Richmond, VA
59
31
22
2
3
1
6
New Bedford, MA
34
29
5
—
—
—
—
Savannah, GA
55
40
10
4
1
—
6
New Haven, CT
U
U
U
U
U
U
U
St. Petersburg, FL
47
30
12
4
—
1
6
Providence, RI
69
56
12
1
—
—
4
Tampa, FL
29
18
7
3
1
—
1
Somerville, MA
2
1
—
1
—
—
—
Washington, D.C.
131
74
36
10
3
8
10
Springfield, MA
32
21
9
1
1
—
2
Wilmington, DE
11
6
4
1
—
—
—
Waterbury, CT
31
26
4
—
—
1
3
E.S. Central
955
632
218
63
23
19
62
Worcester, MA
44
34
6
2
2
—
5
Birmingham, AL
182
119
42
11
5
5
14
Mid. Atlantic
1,836
1,292
406
82
32
24
84
Chattanooga, TN
93
72
20
1
—
—
6
Albany, NY
44
27
15
2
—
—
2
Knoxville, TN
135
86
34
9
3
3
10
Allentown, PA
29
21
7
1
—
—
1
Lexington, KY
86
53
17
10
4
2
2
Buffalo, NY
111
74
27
6
1
3
10
Memphis, TN
188
127
43
12
2
4
15
Camden, NJ
18
12
4
—
—
2
1
Mobile, AL
74
50
14
7
2
1
3
Elizabeth, NJ
16
11
4
—
—
1
1
Montgomery, AL
50
34
11
3
1
1
3
Erie, PA
58
46
12
—
—
—
2
Nashville, TN
147
91
37
10
6
3
9
Jersey City, NJ
10
8
1
1
—
—
1
W.S. Central
1,083
713
248
72
21
29
51
New York City, NY
977
690
210
45
19
13
33
Austin, TX
87
56
21
5
4
1
4
Newark, NJ
49
26
15
6
1
1
5
Baton Rouge, LA
66
48
10
4
1
3
—
Paterson, NJ
15
10
4
1
—
—
1
Corpus Christi, TX
46
32
9
3
—
2
2
Philadelphia, PA
140
84
40
10
5
1
6
Dallas, TX
211
115
71
14
4
7
7
Pittsburgh, PA§
57
47
7
2
1
—
4
El Paso, TX
89
58
22
8
1
—
2
Reading, PA
41
35
2
2
2
—
—
Fort Worth, TX
U
U
U
U
U
U
U
Rochester, NY
70
52
16
—
—
2
2
Houston, TX
151
108
16
12
5
10
6
Schenectady, NY
29
25
3
1
—
—
7
Little Rock, AR
87
59
22
3
3
—
1
Scranton, PA
29
19
10
—
—
—
2
New Orleans, LA
U
U
U
U
U
U
U
Syracuse, NY
82
65
16
1
—
—
4
San Antonio, TX
229
152
53
19
2
3
22
Trenton, NJ
23
15
4
3
—
1
—
Shreveport, LA
36
25
9
—
—
2
1
Utica, NY
19
12
6
—
1
—
2
Tulsa, OK
81
60
15
4
1
1
6
Yonkers, NY
19
13
3
1
2
—
—
Mountain
1,202
831
255
79
16
21
69
E.N. Central
1,939
1,321
439
110
38
31
119
Albuquerque, NM
131
98
26
6
—
1
12
Akron, OH
46
35
7
3
1
—
8
Boise, ID
62
47
11
2
1
1
3
Canton, OH
28
18
10
—
—
—
—
Colorado Springs, CO
65
46
16
1
1
1
4
Chicago, IL
243
157
61
19
5
1
8
Denver, CO
87
57
17
7
3
3
5
Cincinnati, OH
93
57
18
9
6
3
8
Las Vegas, NV
310
208
76
21
4
1
20
Cleveland, OH
224
155
52
9
5
3
11
Ogden, UT
28
16
6
4
1
1
3
Columbus, OH
172
123
34
11
—
4
9
Phoenix, AZ
173
109
41
15
1
7
9
Dayton, OH
129
93
28
2
4
2
7
Pueblo, CO
29
24
5
—
—
—
—
Detroit, MI
148
88
41
10
4
5
2
Salt Lake City, UT
136
92
25
13
3
3
3
Evansville, IN
42
31
9
2
—
—
2
Tucson, AZ
181
134
32
10
2
3
10
Fort Wayne, IN
75
56
13
2
1
3
4
Pacific
1,761
1,186
423
94
34
24
131
Gary, IN
15
10
3
2
—
—
3
Berkeley, CA
10
6
2
1
1
—
—
Grand Rapids, MI
73
55
12
2
—
4
4
Fresno, CA
119
73
41
5
—
—
11
Indianapolis, IN
214
138
56
13
5
2
22
Glendale, CA
33
26
5
1
—
1
6
Lansing, MI
59
40
15
2
2
—
6
Honolulu, HI
77
61
13
2
—
1
9
Milwaukee, WI
92
60
20
8
3
1
5
Long Beach, CA
56
38
12
1
4
1
7
Peoria, IL
47
34
9
3
—
1
4
Los Angeles, CA
266
158
73
22
8
5
19
Rockford, IL
62
43
11
5
2
1
4
Pasadena, CA
19
14
5
—
—
—
5
South Bend, IN
30
25
4
1
—
—
4
Portland, OR
134
92
33
4
3
2
9
Toledo, OH
86
52
30
4
—
—
6
Sacramento, CA
221
154
47
13
3
4
12
Youngstown, OH
61
51
6
3
—
1
2
San Diego, CA
189
133
38
9
6
3
14
W.N. Central
564
362
137
38
18
9
38
San Francisco, CA
118
83
27
6
1
1
8
Des Moines, IA
87
52
25
4
4
2
9
San Jose, CA
202
138
48
10
5
1
14
Duluth, MN
31
20
9
—
2
—
4
Santa Cruz, CA
36
28
6
1
1
—
4
Kansas City, KS
30
18
11
1
—
—
2
Seattle, WA
111
62
35
8
1
5
5
Kansas City, MO
46
24
15
5
1
1
1
Spokane, WA
56
40
12
4
—
—
3
Lincoln, NE
49
41
6
1
1
—
5
Tacoma, WA
114
80
26
7
1
—
5
Minneapolis, MN
52
34
12
4
1
1
4
Total¶
10,707
7,213
2,464
634
210
186
655
Omaha, NE
84
59
17
6
2
—
7
St. Louis, MO
32
15
9
2
5
1
1
St. Paul, MN
60
39
15
4
1
1
1
Wichita, KS
93
60
18
11
1
3
4
U: Unavailable. —: No reported cases.
* Mortality data in this table are voluntarily reported from 122 cities in the United States, most of which have populations of >100,000. A death is reported by the place of its occurrence and by the week that the death certificate was filed. Fetal deaths are not included.
† Pneumonia and influenza.
§ Because of changes in reporting methods in this Pennsylvania city, these numbers are partial counts for the current week. Complete counts will be available in 4 to 6 weeks.