Persons using assistive technology might not be able to fully access information in this file. For assistance, please send e-mail to: mmwrq@cdc.gov. Type 508 Accommodation and the title of the report in the subject line of e-mail.
Notifiable Diseases and Mortality Tables
Table I Summary of provisional cases of selected notifiable diseases, United States, cumulative, week ending May 19, 2012 (20th Week)
Figure I Selected notifiable disease reports, United States, comparison of provisional 4-week totals ending May 19, 2012, with historical data
Table II Provisional cases of selected notifiable diseases, United States, weeks ending May 19, 2012 and May 21, 2011 (20th Week)
Table III Deaths in 122 U.S. cities, week ending May 19, 2012 (20th Week)
TABLE I. Provisional cases of infrequently reported notifiable diseases (<1,000 cases reported during the preceding year) — United States, week ending May 19, 2012 (20th week)*
GA (1), FL (1), TN (1), AR (1), AZ (1), OR (1), AK (1)
Hansen disease§
1
18
2
81
98
103
80
101
FL (1)
Hantavirus pulmonary syndrome§
—
8
1
23
20
20
18
32
Hemolytic uremic syndrome, postdiarrheal§
1
35
4
249
266
242
330
292
OK (1)
Influenza-associated pediatric mortality§,††
2
26
2
118
61
358
90
77
AZ (1), NV (1)
Listeriosis
7
163
11
866
821
851
759
808
NY (1), OH (1), VA (1), AR (1), OK (1), AZ (1), OR (1)
Measles§§
—
34
5
223
63
71
140
43
Meningococcal disease, invasive¶¶:
A, C, Y, and W-135
2
52
6
254
280
301
330
325
IL (1), AR (1)
serogroup B
—
34
3
158
135
174
188
167
other serogroup
—
5
1
20
12
23
38
35
unknown serogroup
3
145
10
327
406
482
616
550
OH (1), FL (1), MT (1)
Novel influenza A virus infections***
—
1
0
8
4
43,774
2
4
Plague
—
—
0
3
2
8
3
7
Poliomyelitis, paralytic
—
—
—
—
—
1
—
—
Polio virus Infection, nonparalytic§
—
—
—
—
—
—
—
—
Psittacosis§
—
—
0
3
4
9
8
12
Q fever, total§
2
33
3
138
131
113
120
171
acute
2
27
2
112
106
93
106
—
MI (1), CA (1)
chronic
—
6
0
26
25
20
14
—
Rabies, human
—
—
—
3
2
4
2
1
Rubella†††
—
5
0
4
5
3
16
12
Rubella, congenital syndrome
1
2
—
—
—
2
—
—
CA (1)
SARS-CoV§
—
—
—
—
—
—
—
—
Smallpox§
—
—
—
—
—
—
—
—
Streptococcal toxic-shock syndrome§
—
56
4
156
142
161
157
132
Syphilis, congenital (age <1 yr)§§§
—
44
7
328
377
423
431
430
Tetanus
—
16
0
38
26
18
19
28
Toxic-shock syndrome (staphylococcal)§
—
20
2
81
82
74
71
92
Trichinellosis
—
4
0
16
7
13
39
5
Tularemia
1
13
3
166
124
93
123
137
MO (1)
Typhoid fever
3
95
8
393
467
397
449
434
NY (1), VA (1), WA (1)
Vancomycin-intermediate Staphylococcus aureus§
3
20
1
82
91
78
63
37
NY (1), OH (1), FL (1)
Vancomycin-resistant Staphylococcus aureus§
—
—
—
—
2
1
—
2
Vibriosis (noncholera Vibrio species infections)§
5
127
10
829
846
789
588
549
VA (1), FL (1), OK (1), CA (2)
Viral hemorrhagic fever¶¶¶
—
—
—
—
1
NN
NN
NN
Yellow fever
—
—
—
—
—
—
—
—
See Table 1 footnotes on next page.
TABLE I. (Continued) Provisional cases of infrequently reported notifiable diseases (<1,000 cases reported during the preceding year) — United States, week ending May 19, 2012 (20th week)*
—: No reported cases. N: Not reportable. NN: Not Nationally Notifiable. Cum: Cumulative year-to-date counts.
§ Not reportable in all states. Data from states where the condition is not reportable are excluded from this table except starting in 2007 for the arboviral diseases, STD data, TB data, and influenza-associated pediatric mortality, and in 2003 for SARS-CoV. Reporting exceptions are available at http://www.cdc.gov/osels/ph_surveillance/nndss/phs/infdis.htm.
¶ Includes both neuroinvasive and nonneuroinvasive. Updated weekly from reports to the Division of Vector-Borne Infectious Diseases, National Center for Zoonotic, Vector-Borne, and Enteric Diseases (ArboNET Surveillance). Data for West Nile virus are available in Table II.
** Data for H. influenzae (all ages, all serotypes) are available in Table II.
†† Updated weekly from reports to the Influenza Division, National Center for Immunization and Respiratory Diseases. Since October 2, 2011, 26 influenza-associated pediatric deaths occurring during the 2011-12 influenza season have been reported.
§§ No measles cases were reported for the current week.
¶¶ Data for meningococcal disease (all serogroups) are available in Table II.
*** CDC discontinued reporting of individual confirmed and probable cases of 2009 pandemic influenza A (H1N1) virus infections on July 24, 2009. During 2009, four cases of human infection with novel influenza A viruses, different from the 2009 pandemic influenza A (H1N1) strain, were reported to CDC. The four cases of novel influenza A virus infection reported to CDC during 2010, the eight cases reported during 2011, and the one case reported in 2012 are different from the 2009 pandemic influenza A (H1N1) virus. Total case counts are provided by the Influenza Division, National Center for Immunization and Respiratory Diseases (NCIRD).
††† No rubella cases were reported for the current week.
§§§ Updated weekly from reports to the Division of STD Prevention, National Center for HIV/AIDS, Viral Hepatitis, STD, and TB Prevention.
¶¶¶ There were no cases of viral hemorrhagic fever reported during the current week. See Table II for dengue hemorrhagic fever.
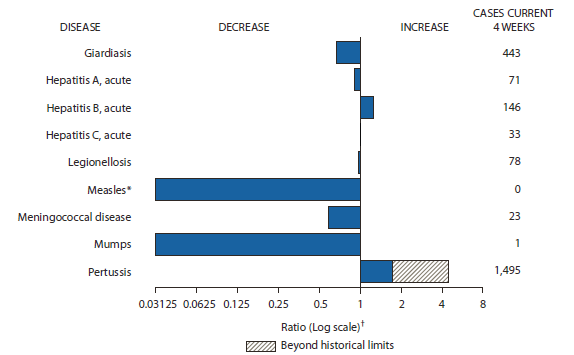
FIGURE I. Selected notifiable disease reports, United States, comparison of provisional 4-week totals May 19, 2012, with historical data
* No measles cases were reported for the current 4-week period yielding a ratio for week 20 of zero (0).
† Ratio of current 4-week total to mean of 15 4-week totals (from previous, comparable, and subsequent 4-week periods for the past 5 years). The point where the hatched area begins is based on the mean and two standard deviations of these 4-week totals.
Alternate Text: The figure above shows selected notifiable disease reports for the United States, with comparison of provisional 4-week totals through May 19, 2012, with historical data. Reports of acute hepatitis B and pertussis increased, with pertussis increasing beyond historical limits. Reports of giardiasis, acute hepatitis A, acute hepatitis C, legionellosis, measles, meningococcal disease, and mumps all decreased.
TABLE II. Provisional cases of selected notifiable diseases, United States, weeks ending May 19, 2012, and May 21, 2011 (20th week)*
Reporting area
Chlamydia trachomatis infection
Coccidioidomycosis
Cryptosporidiosis
Current week
Previous 52 weeks
Cum 2012
Cum 2011
Current week
Previous 52 weeks
Cum 2012
Cum 2011
Current week
Previous 52 weeks
Cum 2012
Cum 2011
Med
Max
Med
Max
Med
Max
United States
13,746
26,935
30,623
460,136
534,100
86
409
591
6,297
8,489
72
144
414
1,959
2,287
New England
648
890
1,807
15,739
16,732
—
0
1
1
1
2
6
22
86
124
Connecticut
51
228
1,268
2,539
3,405
N
0
0
N
N
—
1
8
12
21
Maine
65
59
99
1,144
1,193
N
0
0
N
N
1
1
3
15
22
Massachusetts
439
444
680
8,591
8,755
N
0
0
N
N
—
2
8
39
52
New Hampshire
2
62
86
1,057
1,116
—
0
0
—
1
—
1
5
9
14
Rhode Island
73
80
186
1,879
1,682
—
0
1
1
—
1
0
10
3
1
Vermont
18
26
66
529
581
N
0
0
N
N
—
0
5
8
14
Mid. Atlantic
2,409
3,503
4,469
67,692
68,546
—
0
0
—
—
7
15
44
199
263
New Jersey
179
535
634
10,077
10,077
N
0
0
N
N
—
1
4
11
19
New York (Upstate)
775
724
2,215
13,688
13,336
N
0
0
N
N
4
4
16
40
48
New York City
578
1,232
1,491
22,683
25,276
N
0
0
N
N
—
2
6
31
27
Pennsylvania
877
1,084
1,305
21,244
19,857
N
0
0
N
N
3
7
27
117
169
E.N. Central
1,154
4,198
4,785
69,324
85,232
—
1
5
19
17
10
34
150
485
521
Illinois
20
1,217
1,494
15,233
24,853
N
0
0
N
N
—
3
25
38
52
Indiana
224
537
699
9,708
10,972
N
0
0
N
N
—
4
11
45
100
Michigan
544
938
1,210
17,853
19,720
—
0
3
11
10
—
7
14
89
87
Ohio
244
1,030
1,180
18,088
20,179
—
0
2
8
7
10
13
95
195
146
Wisconsin
122
467
608
8,442
9,508
N
0
0
N
N
—
8
73
118
136
W.N. Central
30
1,460
1,825
11,901
29,905
—
1
7
4
62
10
16
92
210
347
Iowa
—
205
439
2,083
4,211
N
0
0
N
N
—
5
18
74
123
Kansas
—
203
277
128
3,917
N
0
0
N
N
—
0
11
4
—
Minnesota
5
328
408
5,304
6,227
—
0
6
—
52
—
4
17
—
72
Missouri
—
496
683
—
10,799
—
0
2
3
9
9
5
60
69
60
Nebraska
—
125
218
2,068
2,442
—
0
2
1
1
1
2
12
30
56
North Dakota
—
47
78
893
922
N
0
0
N
N
—
0
12
—
—
South Dakota
25
65
93
1,425
1,387
N
0
0
N
N
—
2
13
33
36
S. Atlantic
4,862
5,473
7,586
107,651
109,035
1
0
2
2
2
15
23
55
400
417
Delaware
120
81
182
1,466
1,735
—
0
0
—
—
—
0
4
7
2
District of Columbia
—
129
224
2,551
2,567
—
0
0
—
—
—
0
1
—
4
Florida
933
1,501
1,701
29,162
29,754
N
0
0
N
N
14
8
17
170
150
Georgia
669
1,066
1,568
19,985
20,364
N
0
0
N
N
—
5
13
80
134
Maryland
385
490
824
7,988
10,196
1
0
2
2
2
1
2
7
38
23
North Carolina
1,378
997
1,688
19,075
18,075
N
0
0
N
N
—
0
46
35
23
South Carolina
486
518
1,278
11,271
11,033
N
0
0
N
N
—
2
6
25
45
Virginia
818
673
1,780
14,331
13,702
N
0
0
N
N
—
3
8
44
27
West Virginia
73
86
146
1,822
1,609
N
0
0
N
N
—
0
4
1
9
E.S. Central
389
1,898
2,820
32,811
37,044
—
0
0
—
—
7
7
26
98
101
Alabama
—
525
1,284
5,966
10,941
N
0
0
N
N
4
2
7
37
45
Kentucky
217
328
524
6,331
5,941
N
0
0
N
N
1
1
18
12
24
Mississippi
—
429
1,168
8,138
8,226
N
0
0
N
N
2
1
4
17
11
Tennessee
172
618
827
12,376
11,936
N
0
0
N
N
—
2
6
32
21
W.S. Central
2,445
3,454
4,418
62,672
69,825
—
0
1
—
2
4
11
45
122
116
Arkansas
289
323
412
6,597
6,303
N
0
0
N
N
—
0
2
10
5
Louisiana
364
572
1,120
7,070
9,503
—
0
1
—
2
—
1
10
27
14
Oklahoma
102
120
1,035
881
5,168
N
0
0
N
N
—
2
6
22
25
Texas
1,690
2,434
3,101
48,124
48,851
N
0
0
N
N
4
6
41
63
72
Mountain
803
1,677
2,415
30,118
33,813
66
307
480
5,070
6,596
10
10
29
166
195
Arizona
117
559
865
10,086
10,675
65
301
479
5,003
6,501
—
1
4
8
12
Colorado
399
393
705
6,862
8,411
N
0
0
N
N
—
2
11
21
55
Idaho
—
85
277
1,356
1,600
N
0
0
N
N
4
2
9
41
32
Montana
86
70
100
1,564
1,291
N
0
0
N
N
4
2
6
32
21
Nevada
170
208
285
3,529
4,158
1
2
6
47
33
—
0
2
6
4
New Mexico
—
218
395
4,168
4,178
—
1
7
6
37
—
2
9
39
41
Utah
31
134
191
2,445
2,714
—
1
5
12
22
—
1
5
9
18
Wyoming
—
20
67
108
786
—
0
2
2
3
2
0
3
10
12
Pacific
1,006
3,952
5,070
62,228
83,968
19
100
178
1,201
1,809
7
12
23
193
203
Alaska
56
106
152
2,149
2,377
N
0
0
N
N
—
0
3
1
4
California
308
3,028
4,094
43,311
65,171
19
100
178
1,201
1,809
2
6
16
107
94
Hawaii
—
116
147
1,872
2,175
N
0
0
N
N
—
0
1
2
—
Oregon
260
270
367
5,625
5,271
N
0
0
N
N
1
3
10
63
80
Washington
382
458
764
9,271
8,974
N
0
0
N
N
4
1
8
20
25
Territories
American Samoa
—
0
0
—
—
N
0
0
N
N
N
0
0
N
N
C.N.M.I.
—
—
—
—
—
—
—
—
—
—
—
—
—
—
—
Guam
—
—
—
—
189
—
—
—
—
—
—
—
—
—
—
Puerto Rico
112
104
289
2,540
2,357
N
0
0
N
N
N
0
0
N
N
U.S. Virgin Islands
—
15
24
163
315
—
0
0
—
—
—
0
0
—
—
C.N.M.I.: Commonwealth of Northern Mariana Islands.
U: Unavailable. —: No reported cases. N: Not reportable. NN: Not Nationally Notifiable. Cum: Cumulative year-to-date counts. Med: Median. Max: Maximum.
† Data for meningococcal disease, invasive caused by serogroups A, C, Y, and W-135; serogroup B; other serogroup; and unknown serogroup are available in Table I.
TABLE II. (Continued) Provisional cases of selected notifiable diseases, United States, weeks ending May 19, 2012, and May 21, 2011 (20th week)*
Reporting area
Rabies, animal
Salmonellosis
Shiga toxin-producing E. coli (STEC)†
Current week
Previous 52 weeks
Cum 2012
Cum 2011
Current week
Previous 52 weeks
Cum 2012
Cum 2011
Current week
Previous 52 weeks
Cum 2012
Cum 2011
Med
Max
Med
Max
Med
Max
United States
59
74
136
1,081
1,496
435
961
1,947
10,374
11,915
47
107
256
1,138
1,239
New England
3
7
16
146
91
5
33
86
432
643
1
3
12
34
48
Connecticut
—
4
10
69
49
—
7
30
109
146
—
1
5
14
19
Maine
2
2
6
44
18
4
2
7
36
42
1
0
3
1
6
Massachusetts
—
0
0
—
—
—
15
44
206
287
—
1
9
16
13
New Hampshire
—
0
3
10
6
—
3
8
26
55
—
0
3
2
7
Rhode Island
—
0
6
8
5
1
1
12
33
96
—
0
2
—
1
Vermont
1
0
4
15
13
—
2
8
22
17
—
0
3
1
2
Mid. Atlantic
11
14
36
156
268
43
93
209
1,212
1,382
5
10
35
119
157
New Jersey
—
0
0
—
—
—
20
49
228
292
—
2
8
12
47
New York (Upstate)
11
7
20
112
100
32
26
67
368
302
4
3
13
46
35
New York City
—
0
3
—
3
—
20
44
270
302
—
2
6
24
22
Pennsylvania
—
7
16
44
165
11
29
114
346
486
1
3
17
37
53
E.N. Central
5
3
20
31
30
44
79
186
1,110
1,400
2
16
50
171
210
Illinois
4
0
6
12
7
—
27
80
364
496
—
4
14
29
44
Indiana
—
0
7
—
1
—
12
36
135
154
—
2
10
32
36
Michigan
—
1
6
12
10
4
16
42
228
205
—
3
13
62
32
Ohio
1
0
6
7
12
40
22
46
338
330
2
3
9
38
43
Wisconsin
N
0
0
N
N
—
9
48
45
215
—
4
22
10
55
W.N. Central
2
2
8
27
37
36
44
113
524
817
6
18
58
156
164
Iowa
—
0
4
—
4
1
7
19
111
147
—
2
15
16
34
Kansas
—
0
3
7
12
—
10
27
54
100
—
2
8
5
19
Minnesota
—
0
0
—
—
—
10
33
—
212
—
4
24
—
43
Missouri
2
0
4
13
7
25
15
42
250
235
5
6
31
105
43
Nebraska
—
0
3
—
10
10
4
13
73
61
1
2
7
19
18
North Dakota
—
0
4
7
4
—
0
15
—
—
—
0
4
—
—
South Dakota
—
0
0
—
—
—
2
10
36
62
—
1
4
11
7
S. Atlantic
23
17
55
348
474
147
299
712
3,155
3,053
9
11
31
169
186
Delaware
—
0
0
—
—
—
3
12
39
37
—
0
2
3
3
District of Columbia
—
0
0
—
—
—
0
6
—
22
—
0
1
1
2
Florida
—
0
34
50
120
97
107
201
1,371
1,184
4
2
11
77
40
Georgia
—
0
0
—
—
18
42
112
426
607
3
2
7
28
37
Maryland
—
5
14
102
120
15
18
45
270
251
2
1
4
15
20
North Carolina
—
0
0
—
—
—
35
251
506
437
—
1
26
19
42
South Carolina
N
0
0
N
N
—
25
71
232
250
—
0
2
5
7
Virginia
17
10
25
163
232
17
23
57
292
240
—
2
8
19
34
West Virginia
6
1
37
33
2
—
0
52
19
25
—
0
2
2
1
E.S. Central
3
2
6
30
70
23
64
191
685
740
5
5
18
82
50
Alabama
2
1
5
25
34
2
21
70
196
198
1
1
15
23
7
Kentucky
1
0
2
5
5
—
9
30
91
139
—
1
5
12
15
Mississippi
—
0
0
—
—
8
20
87
196
184
—
0
4
7
7
Tennessee
—
0
3
—
31
13
15
51
202
219
4
2
11
40
21
W.S. Central
12
18
40
283
473
60
155
374
1,336
1,525
15
10
90
148
107
Arkansas
1
0
15
59
36
11
13
52
136
151
4
1
6
22
7
Louisiana
—
0
0
—
—
—
23
69
199
283
—
0
3
4
6
Oklahoma
1
0
21
21
12
12
14
102
143
126
7
1
16
24
10
Texas
10
15
35
203
425
37
103
227
858
965
4
7
74
98
84
Mountain
—
1
5
29
3
10
44
97
598
792
1
9
46
116
161
Arizona
N
0
0
N
N
5
15
36
202
263
—
2
6
43
47
Colorado
—
0
0
—
—
—
10
23
153
176
—
3
9
25
39
Idaho
—
0
1
—
—
2
2
8
32
54
1
2
8
18
21
Montana
N
0
0
N
N
—
2
10
25
28
—
0
4
9
9
Nevada
—
0
3
1
—
2
3
7
49
61
—
0
7
6
14
New Mexico
—
0
4
28
3
—
6
21
59
75
—
0
3
9
15
Utah
—
0
2
—
—
—
5
12
65
113
—
1
29
2
14
Wyoming
—
0
0
—
—
1
1
9
13
22
—
0
7
4
2
Pacific
—
4
14
31
50
67
96
184
1,322
1,563
3
16
37
143
156
Alaska
—
0
1
5
11
—
1
6
21
26
—
0
1
1
—
California
—
3
13
26
35
34
65
140
916
1,169
—
8
20
54
110
Hawaii
—
0
0
—
—
1
6
19
78
103
—
0
2
5
2
Oregon
—
0
2
—
4
4
6
16
110
118
—
2
11
48
20
Washington
—
0
11
—
—
28
12
42
197
147
3
3
18
35
24
Territories
American Samoa
N
0
0
N
N
—
0
1
1
—
—
0
0
—
—
C.N.M.I.
—
—
—
—
—
—
—
—
—
—
—
—
—
—
—
Guam
—
—
—
—
—
—
—
—
—
6
—
—
—
—
—
Puerto Rico
—
1
6
27
15
—
6
21
22
158
—
0
0
—
—
U.S. Virgin Islands
—
0
0
—
—
—
0
0
—
—
—
0
0
—
—
C.N.M.I.: Commonwealth of Northern Mariana Islands.
U: Unavailable. —: No reported cases. N: Not reportable. NN: Not Nationally Notifiable. Cum: Cumulative year-to-date counts. Med: Median. Max: Maximum.
† Illnesses with similar clinical presentation that result from Spotted fever group rickettsia infections are reported as Spotted fever rickettsioses. Rocky Mountain spotted fever (RMSF) caused by Rickettsia rickettsii, is the most common and well-known spotted fever.
TABLE II. (Continued) Provisional cases of selected notifiable diseases, United States, weeks ending May 19, 2012, and May 21, 2011 (20th week)*
Reporting area
Streptococcus pneumoniae,† invasive disease
Syphilis, primary and secondary
All ages
Age <5
Current week
Previous 52 weeks
Cum 2012
Cum 2011
Current week
Previous 52 weeks
Cum 2012
Cum 2011
Current week
Previous 52 weeks
Cum 2012
Cum 2011
Med
Max
Med
Max
Med
Max
United States
129
273
763
6,271
8,816
13
21
55
417
597
98
269
323
4,488
5,188
New England
3
13
28
281
436
—
1
4
20
23
3
8
23
153
154
Connecticut
—
6
13
137
201
—
0
2
6
6
—
0
13
9
20
Maine
1
2
8
53
60
—
0
1
1
2
—
0
2
7
8
Massachusetts
—
1
4
18
18
—
0
3
9
9
1
5
10
97
95
New Hampshire
2
1
6
38
59
—
0
1
4
2
—
0
2
15
11
Rhode Island
—
1
5
13
60
—
0
1
—
1
1
1
7
22
16
Vermont
—
1
4
22
38
—
0
2
—
3
1
0
2
3
4
Mid. Atlantic
22
44
157
992
1,344
2
2
11
45
69
4
32
49
526
647
New Jersey
—
11
26
236
385
—
0
2
11
27
—
4
8
43
97
New York (Upstate)
22
19
108
465
580
2
1
10
23
23
2
4
12
70
61
New York City
—
12
23
291
379
—
0
3
11
19
1
17
27
268
350
Pennsylvania
N
0
0
N
N
N
0
0
N
N
1
7
17
145
139
E.N. Central
27
61
101
1,347
1,714
3
3
10
86
97
9
31
62
409
720
Illinois
N
0
0
N
N
—
0
0
—
—
8
12
54
147
331
Indiana
—
11
33
234
416
—
1
2
11
19
1
3
9
73
66
Michigan
7
13
25
276
367
—
0
3
20
22
—
4
13
69
117
Ohio
18
26
46
619
666
2
1
6
39
44
—
7
15
101
184
Wisconsin
2
9
23
218
265
1
0
2
16
12
—
1
6
19
22
W.N. Central
1
13
35
240
298
—
1
3
15
24
—
4
13
29
129
Iowa
N
0
0
N
N
N
0
0
N
N
—
0
3
4
10
Kansas
N
0
0
N
N
N
0
0
N
N
—
0
4
—
6
Minnesota
—
9
26
166
236
—
1
3
10
20
—
2
8
23
56
Missouri
N
0
0
N
N
—
0
0
—
—
—
1
8
—
53
Nebraska
1
3
8
74
62
—
0
2
5
4
—
0
2
1
4
North Dakota
—
0
26
—
—
—
0
1
—
—
—
0
1
1
—
South Dakota
N
0
0
N
N
—
0
0
—
—
—
0
0
—
—
S. Atlantic
39
59
195
1,458
2,207
6
4
21
101
158
37
67
98
1,170
1,266
Delaware
—
1
5
20
29
—
0
0
—
—
—
0
6
19
5
District of Columbia
—
0
5
2
27
—
0
1
1
4
—
3
9
78
74
Florida
18
21
48
489
752
4
2
8
37
67
2
25
36
435
460
Georgia
8
18
47
443
692
—
1
6
34
44
10
12
59
209
210
Maryland
8
8
22
162
322
—
1
5
13
20
5
8
15
134
175
North Carolina
N
0
0
N
N
N
0
0
N
N
7
7
21
128
173
South Carolina
4
7
16
184
275
2
0
2
8
18
4
4
11
82
81
Virginia
N
0
0
N
N
—
0
0
—
—
9
3
13
84
86
West Virginia
1
3
83
158
110
—
0
8
8
5
—
0
2
1
2
E.S. Central
7
21
50
457
630
—
2
5
26
42
3
15
32
227
283
Alabama
N
0
0
N
N
N
0
0
N
N
—
3
10
33
88
Kentucky
—
4
9
100
128
—
0
1
3
13
3
2
9
46
43
Mississippi
N
0
0
N
N
—
0
0
—
—
—
3
21
65
48
Tennessee
7
17
47
357
502
—
1
4
23
29
—
5
14
83
104
W.S. Central
19
33
184
750
1,033
1
3
11
62
96
24
40
51
798
668
Arkansas
1
4
14
87
121
—
0
3
10
10
—
4
15
87
71
Louisiana
—
3
18
75
125
—
0
2
5
13
1
8
19
104
154
Oklahoma
N
0
0
N
N
—
0
0
—
—
—
1
7
18
22
Texas
18
25
152
588
787
1
2
10
47
73
23
25
41
589
421
Mountain
8
28
48
692
1,070
1
2
7
51
83
2
11
21
159
241
Arizona
6
11
27
358
478
1
1
4
28
33
—
4
11
65
94
Colorado
—
8
17
186
280
—
0
3
10
21
1
2
6
39
49
Idaho
N
0
0
N
N
—
0
0
—
—
—
0
3
8
3
Montana
N
0
0
N
N
N
0
0
N
N
—
0
1
—
5
Nevada
N
0
0
N
N
N
0
0
N
N
1
2
7
30
56
New Mexico
2
5
15
136
188
—
0
4
12
14
—
1
4
13
28
Utah
—
1
8
1
107
—
0
2
—
15
—
0
2
4
6
Wyoming
—
0
3
11
17
—
0
1
1
—
—
0
0
—
—
Pacific
3
2
9
54
84
—
0
2
11
5
16
57
74
1,017
1,080
Alaska
3
2
9
52
83
—
0
2
11
5
—
0
2
4
—
California
N
0
0
N
N
N
0
0
N
N
11
47
64
847
895
Hawaii
—
0
1
2
1
—
0
1
—
—
—
0
3
1
6
Oregon
N
0
0
N
N
N
0
0
N
N
—
2
12
68
32
Washington
N
0
0
N
N
N
0
0
N
N
5
5
12
97
147
Territories
American Samoa
N
0
0
N
N
—
0
0
—
—
—
0
0
—
—
C.N.M.I.
—
—
—
—
—
—
—
—
—
—
—
—
—
—
—
Guam
—
—
—
—
—
—
—
—
—
—
—
—
—
—
—
Puerto Rico
—
0
0
—
—
—
0
0
—
—
9
5
15
96
82
U.S. Virgin Islands
—
0
0
—
—
—
0
0
—
—
—
0
0
—
—
C.N.M.I.: Commonwealth of Northern Mariana Islands.
U: Unavailable. —: No reported cases. N: Not reportable. NN: Not Nationally Notifiable. Cum: Cumulative year-to-date counts. Med: Median. Max: Maximum.
† Includes drug resistant and susceptible cases of invasive Streptococcus pneumoniae disease among children <5 years and among all ages. Case definition: Isolation of S. pneumoniae from a normally sterile body site (e.g., blood or cerebrospinal fluid).
TABLE II. (Continued) Provisional cases of selected notifiable diseases, United States, weeks ending May 19, 2012, and May 21, 2011 (20th week)*
Reporting area
Varicella (chickenpox)
West Nile virus disease†
Neuroinvasive
Nonneuroinvasive§
Current week
Previous 52 weeks
Cum 2012
Cum 2011
Current week
Previous 52 weeks
Cum 2012
Cum 2011
Current week
Previous 52 weeks
Cum 2012
Cum 2011
Med
Max
Med
Max
Med
Max
United States
140
291
432
5,555
6,407
—
0
63
1
2
—
0
33
—
2
New England
6
26
53
488
517
—
0
3
—
—
—
0
1
—
—
Connecticut
1
5
20
88
100
—
0
2
—
—
—
0
1
—
—
Maine
1
4
14
103
102
—
0
0
—
—
—
0
0
—
—
Massachusetts
—
11
19
207
197
—
0
2
—
—
—
0
1
—
—
New Hampshire
—
1
10
—
57
—
0
0
—
—
—
0
0
—
—
Rhode Island
—
1
6
28
18
—
0
1
—
—
—
0
0
—
—
Vermont
4
2
9
62
43
—
0
1
—
—
—
0
0
—
—
Mid. Atlantic
17
57
88
943
717
—
0
11
—
—
—
0
6
—
—
New Jersey
—
35
70
592
235
—
0
1
—
—
—
0
2
—
—
New York (Upstate)
N
0
0
N
N
—
0
5
—
—
—
0
4
—
—
New York City
—
0
0
—
—
—
0
4
—
—
—
0
1
—
—
Pennsylvania
17
19
39
351
482
—
0
2
—
—
—
0
1
—
—
E.N. Central
30
71
127
1,365
1,658
—
0
13
—
—
—
0
7
—
—
Illinois
3
17
38
395
386
—
0
6
—
—
—
0
5
—
—
Indiana
1
6
20
157
110
—
0
2
—
—
—
0
1
—
—
Michigan
11
19
45
405
466
—
0
7
—
—
—
0
2
—
—
Ohio
15
20
47
407
485
—
0
3
—
—
—
0
3
—
—
Wisconsin
—
4
14
1
211
—
0
1
—
—
—
0
1
—
—
W.N. Central
3
12
32
195
307
—
0
9
1
1
—
0
7
—
—
Iowa
N
0
0
N
N
—
0
2
1
—
—
0
2
—
—
Kansas
—
7
21
85
152
—
0
1
—
—
—
0
0
—
—
Minnesota
—
0
1
—
—
—
0
1
—
—
—
0
1
—
—
Missouri
—
5
18
91
102
—
0
2
—
1
—
0
2
—
—
Nebraska
3
0
3
7
11
—
0
4
—
—
—
0
3
—
—
North Dakota
—
0
7
—
17
—
0
1
—
—
—
0
1
—
—
South Dakota
—
1
6
12
25
—
0
0
—
—
—
0
1
—
—
S. Atlantic
15
31
55
593
887
—
0
12
—
—
—
0
6
—
—
Delaware
—
0
2
2
3
—
0
1
—
—
—
0
0
—
—
District of Columbia
—
0
2
—
9
—
0
3
—
—
—
0
3
—
—
Florida
15
17
50
473
439
—
0
4
—
—
—
0
2
—
—
Georgia
N
0
0
N
N
—
0
4
—
—
—
0
1
—
—
Maryland
N
0
0
N
N
—
0
5
—
—
—
0
3
—
—
North Carolina
N
0
0
N
N
—
0
1
—
—
—
0
0
—
—
South Carolina
—
0
2
1
10
—
0
0
—
—
—
0
0
—
—
Virginia
—
8
24
88
196
—
0
2
—
—
—
0
1
—
—
West Virginia
—
4
16
29
230
—
0
1
—
—
—
0
0
—
—
E.S. Central
2
5
14
103
150
—
0
11
—
—
—
0
5
—
1
Alabama
2
5
14
97
142
—
0
2
—
—
—
0
0
—
—
Kentucky
N
0
0
N
N
—
0
2
—
—
—
0
1
—
—
Mississippi
—
0
3
6
8
—
0
5
—
—
—
0
4
—
1
Tennessee
N
0
0
N
N
—
0
3
—
—
—
0
1
—
—
W.S. Central
53
56
212
1,196
1,198
—
0
4
—
1
—
0
3
—
—
Arkansas
2
4
28
79
139
—
0
1
—
—
—
0
0
—
—
Louisiana
—
1
6
20
43
—
0
1
—
—
—
0
2
—
—
Oklahoma
N
0
0
N
N
—
0
1
—
—
—
0
0
—
—
Texas
51
49
203
1,097
1,016
—
0
3
—
1
—
0
3
—
—
Mountain
9
29
62
620
906
—
0
11
—
—
—
0
5
—
1
Arizona
—
10
26
204
365
—
0
7
—
—
—
0
4
—
1
Colorado
9
7
32
197
190
—
0
2
—
—
—
0
2
—
—
Idaho
N
0
0
N
N
—
0
1
—
—
—
0
1
—
—
Montana
—
2
7
45
108
—
0
1
—
—
—
0
0
—
—
Nevada
N
0
0
N
N
—
0
4
—
—
—
0
2
—
—
New Mexico
—
1
8
48
22
—
0
1
—
—
—
0
0
—
—
Utah
—
5
20
118
214
—
0
1
—
—
—
0
1
—
—
Wyoming
—
0
2
8
7
—
0
1
—
—
—
0
1
—
—
Pacific
5
2
9
52
67
—
0
18
—
—
—
0
8
—
—
Alaska
3
1
4
30
27
—
0
0
—
—
—
0
0
—
—
California
—
0
4
7
19
—
0
18
—
—
—
0
8
—
—
Hawaii
2
0
4
15
21
—
0
0
—
—
—
0
0
—
—
Oregon
N
0
0
N
N
—
0
0
—
—
—
0
0
—
—
Washington
N
0
0
N
N
—
0
0
—
—
—
0
0
—
—
Territories
American Samoa
N
0
0
N
N
—
0
0
—
—
—
0
0
—
—
C.N.M.I.
—
—
—
—
—
—
—
—
—
—
—
—
—
—
—
Guam
—
—
—
—
16
—
—
—
—
—
—
—
—
—
—
Puerto Rico
3
6
14
60
180
—
0
0
—
—
—
0
0
—
—
U.S. Virgin Islands
—
0
0
—
—
—
0
0
—
—
—
0
0
—
—
C.N.M.I.: Commonwealth of Northern Mariana Islands.
U: Unavailable. —: No reported cases. N: Not reportable. NN: Not Nationally Notifiable. Cum: Cumulative year-to-date counts. Med: Median. Max: Maximum.
† Updated weekly from reports to the Division of Vector-Borne Infectious Diseases, National Center for Zoonotic, Vector-Borne, and Enteric Diseases (ArboNET Surveillance). Data for California serogroup, eastern equine, Powassan, St. Louis, and western equine diseases are available in Table I.
§ Not reportable in all states. Data from states where the condition is not reportable are excluded from this table, except starting in 2007 for the domestic arboviral diseases and influenza-associated pediatric mortality, and in 2003 for SARS-CoV. Reporting exceptions are available at http://www.cdc.gov/osels/ph_surveillance/nndss/phs/infdis.htm.
TABLE III. Deaths in 122 U.S. cities,* week ending May 19, 2012 (20th week)
Reporting area
All causes, by age (years)
P&I† Total
Reporting area (Continued)
All causes, by age (years)
P&I† Total
All Ages
=65
45–64
25–44
1–24
<1
All Ages
=65
45–64
25–44
1–24
<1
New England
548
392
107
24
11
14
40
S. Atlantic
767
476
209
46
19
17
53
Boston, MA
138
94
27
8
4
5
7
Atlanta, GA
143
79
47
11
3
3
10
Bridgeport, CT
33
25
6
—
1
1
2
Baltimore, MD
165
89
57
11
5
3
17
Cambridge, MA
12
9
2
1
—
—
3
Charlotte, NC
109
84
16
4
3
2
7
Fall River, MA
21
15
6
—
—
—
3
Jacksonville, FL
3
—
1
2
—
—
—
Hartford, CT
49
38
10
—
—
1
5
Miami, FL
97
72
15
4
4
2
5
Lowell, MA
13
10
2
1
—
—
1
Norfolk, VA
44
22
17
3
1
1
2
Lynn, MA
9
5
3
1
—
—
1
Richmond, VA
59
31
23
4
1
—
1
New Bedford, MA
20
15
3
2
—
—
3
Savannah, GA
50
34
11
2
—
3
6
New Haven, CT
41
25
10
2
2
2
1
St. Petersburg, FL
50
37
9
2
2
—
3
Providence, RI
75
58
12
2
1
2
5
Tampa, FL
40
23
12
2
—
3
1
Somerville, MA
2
2
—
—
—
—
—
Washington, D.C.
U
U
U
U
U
U
U
Springfield, MA
29
21
4
4
—
—
1
Wilmington, DE
7
5
1
1
—
—
1
Waterbury, CT
32
24
5
1
—
2
2
E.S. Central
831
546
207
52
15
11
63
Worcester, MA
74
51
17
2
3
1
6
Birmingham, AL
162
112
39
7
4
—
15
Mid. Atlantic
2,097
1,449
460
106
41
40
104
Chattanooga, TN
91
70
15
6
—
—
5
Albany, NY
61
41
15
1
1
3
3
Knoxville, TN
109
72
23
5
5
4
12
Allentown, PA
24
22
1
—
—
1
1
Lexington, KY
73
43
21
6
1
2
5
Buffalo, NY
70
50
16
2
1
1
11
Memphis, TN
154
97
45
6
4
2
10
Camden, NJ
21
10
8
2
—
1
—
Mobile, AL
78
54
16
6
1
1
3
Elizabeth, NJ
25
16
6
1
2
—
2
Montgomery, AL
9
9
—
—
—
—
1
Erie, PA
55
42
11
2
—
—
5
Nashville, TN
155
89
48
16
—
2
12
Jersey City, NJ
17
15
1
—
—
1
3
W.S. Central
1,164
715
300
83
43
23
59
New York City, NY
945
672
207
40
13
12
32
Austin, TX
98
59
25
10
4
—
3
Newark, NJ
30
15
6
4
4
1
3
Baton Rouge, LA
69
49
12
7
1
—
—
Paterson, NJ
18
12
4
—
1
1
—
Corpus Christi, TX
80
47
20
8
4
1
4
Philadelphia, PA
482
295
121
38
14
14
28
Dallas, TX
178
100
54
9
10
5
13
Pittsburgh, PA§
47
36
8
3
—
—
4
El Paso, TX
94
69
14
6
4
1
7
Reading, PA
27
19
7
1
—
—
3
Fort Worth, TX
U
U
U
U
U
U
U
Rochester, NY
85
57
16
7
2
3
2
Houston, TX
130
61
37
14
10
8
8
Schenectady, NY
24
19
4
1
—
—
—
Little Rock, AR
95
61
24
5
2
3
3
Scranton, PA
22
18
4
—
—
—
1
New Orleans, LA
U
U
U
U
U
U
U
Syracuse, NY
69
54
12
3
—
—
4
San Antonio, TX
257
160
74
16
4
3
11
Trenton, NJ
38
25
9
—
2
2
—
Shreveport, LA
63
40
18
2
2
1
3
Utica, NY
22
19
1
1
1
—
2
Tulsa, OK
100
69
22
6
2
1
7
Yonkers, NY
15
12
3
—
—
—
—
Mountain
1,110
712
265
88
19
25
66
E.N. Central
2,064
1,352
516
110
49
37
123
Albuquerque, NM
111
69
29
10
1
2
9
Akron, OH
48
37
7
1
2
1
6
Boise, ID
62
46
12
3
—
1
2
Canton, OH
37
30
6
—
—
1
1
Colorado Springs, CO
61
38
17
6
—
—
1
Chicago, IL
221
137
55
14
7
8
9
Denver, CO
82
58
19
1
2
2
4
Cincinnati, OH
75
42
23
6
1
3
9
Las Vegas, NV
283
183
68
22
6
3
24
Cleveland, OH
267
194
58
11
3
1
16
Ogden, UT
32
22
8
1
1
—
1
Columbus, OH
277
176
73
15
7
6
13
Phoenix, AZ
168
98
43
16
3
8
7
Dayton, OH
137
100
30
3
2
2
9
Pueblo, CO
28
20
6
2
—
—
1
Detroit, MI
133
63
54
11
4
1
5
Salt Lake City, UT
139
81
32
15
5
6
10
Evansville, IN
35
18
11
3
—
3
3
Tucson, AZ
144
97
31
12
1
3
7
Fort Wayne, IN
77
52
16
8
1
—
4
Pacific
1,583
1,114
335
79
24
31
131
Gary, IN
10
2
5
2
—
1
—
Berkeley, CA
18
11
3
—
1
3
2
Grand Rapids, MI
61
45
11
1
4
—
6
Fresno, CA
116
79
24
9
2
2
12
Indianapolis, IN
216
133
58
16
6
3
18
Glendale, CA
22
21
1
—
—
—
3
Lansing, MI
65
45
13
4
2
1
3
Honolulu, HI
52
43
3
5
—
1
10
Milwaukee, WI
73
47
21
3
1
1
3
Long Beach, CA
57
42
12
1
2
—
5
Peoria, IL
55
36
12
5
1
1
3
Los Angeles, CA
246
160
65
14
5
2
26
Rockford, IL
52
34
14
1
2
1
2
Pasadena, CA
17
13
4
—
—
—
1
South Bend, IN
60
39
15
1
3
2
4
Portland, OR
119
80
32
3
1
3
8
Toledo, OH
90
63
21
3
2
1
6
Sacramento, CA
194
141
41
8
1
3
14
Youngstown, OH
75
59
13
2
1
—
3
San Diego, CA
145
95
35
9
—
6
11
W.N. Central
564
383
135
25
8
12
46
San Francisco, CA
91
61
18
8
1
3
7
Des Moines, IA
67
53
11
3
—
—
9
San Jose, CA
178
138
31
3
2
4
10
Duluth, MN
27
19
7
1
—
—
1
Santa Cruz, CA
27
20
6
1
—
—
3
Kansas City, KS
22
11
9
2
—
—
2
Seattle, WA
107
74
21
8
2
2
8
Kansas City, MO
60
41
13
4
—
2
3
Spokane, WA
65
47
14
2
1
1
1
Lincoln, NE
34
27
6
—
—
1
1
Tacoma, WA
129
89
25
8
6
1
10
Minneapolis, MN
63
36
20
2
2
3
7
Total¶
10,728
7,139
2,534
613
229
210
685
Omaha, NE
97
76
14
4
2
1
8
St. Louis, MO
63
31
22
5
1
3
3
St. Paul, MN
44
31
11
1
—
1
5
Wichita, KS
87
58
22
3
3
1
7
U: Unavailable. —: No reported cases.
* Mortality data in this table are voluntarily reported from 122 cities in the United States, most of which have populations of >100,000. A death is reported by the place of its occurrence and by the week that the death certificate was filed. Fetal deaths are not included.
† Pneumonia and influenza.
§ Because of changes in reporting methods in this Pennsylvania city, these numbers are partial counts for the current week. Complete counts will be available in 4 to 6 weeks.