Persons using assistive technology might not be able to fully access information in this file. For assistance, please send e-mail to: mmwrq@cdc.gov. Type 508 Accommodation and the title of the report in the subject line of e-mail.
Notifiable Diseases and Mortality Tables
Table I Summary of provisional cases of selected notifiable diseases, United States, cumulative, week ending May 26, 2012 (21st Week)
Figure I Selected notifiable disease reports, United States, comparison of provisional 4-week totals ending May 26, 2012, with historical data
Table II Provisional cases of selected notifiable diseases, United States, weeks ending May 26, 2012 and May 28, 2011 (21st Week)
Table III Deaths in 122 U.S. cities, week ending May 26, 2012 (21st Week)
TABLE I. Provisional cases of infrequently reported notifiable diseases (<1,000 cases reported during the preceding year) — United States, week ending May 26, 2012 (21st week)*
TABLE I. (Continued) Provisional cases of infrequently reported notifiable diseases (<1,000 cases reported during the preceding year) — United States, week ending May 26, 2012 (21st week)*
—: No reported cases. N: Not reportable. NN: Not Nationally Notifiable. Cum: Cumulative year-to-date counts.
§ Not reportable in all states. Data from states where the condition is not reportable are excluded from this table except starting in 2007 for the arboviral diseases, STD data, TB data, and influenza-associated pediatric mortality, and in 2003 for SARS-CoV. Reporting exceptions are available at http://www.cdc.gov/osels/ph_surveillance/nndss/phs/infdis.htm.
¶ Includes both neuroinvasive and nonneuroinvasive. Updated weekly from reports to the Division of Vector-Borne Infectious Diseases, National Center for Zoonotic, Vector-Borne, and Enteric Diseases (ArboNET Surveillance). Data for West Nile virus are available in Table II.
** Data for H. influenzae (all ages, all serotypes) are available in Table II.
†† Updated weekly from reports to the Influenza Division, National Center for Immunization and Respiratory Diseases. Since October 2, 2011, 26 influenza-associated pediatric deaths occurring during the 2011-12 influenza season have been reported.
§§ No measles cases were reported for the current week.
¶¶ Data for meningococcal disease (all serogroups) are available in Table II.
*** CDC discontinued reporting of individual confirmed and probable cases of 2009 pandemic influenza A (H1N1) virus infections on July 24, 2009. During 2009, four cases of human infection with novel influenza A viruses, different from the 2009 pandemic influenza A (H1N1) strain, were reported to CDC. The four cases of novel influenza A virus infection reported to CDC during 2010, the eight cases reported during 2011, and the one case reported in 2012 are different from the 2009 pandemic influenza A (H1N1) virus. Total case counts are provided by the Influenza Division, National Center for Immunization and Respiratory Diseases (NCIRD).
††† No rubella cases were reported for the current week.
§§§ Updated weekly from reports to the Division of STD Prevention, National Center for HIV/AIDS, Viral Hepatitis, STD, and TB Prevention.
¶¶¶ There were no cases of viral hemorrhagic fever reported during the current week. See Table II for dengue hemorrhagic fever.
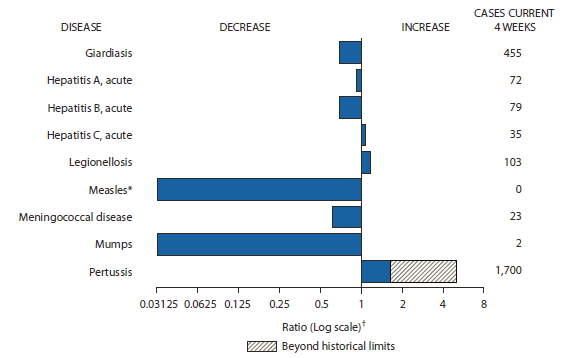
FIGURE I. Selected notifiable disease reports, United States, comparison of provisional 4-week totals May 26, 2012, with historical data
* No measles cases were reported for the current 4-week period yielding a ratio for week 21 of zero (0).
† Ratio of current 4-week total to mean of 15 4-week totals (from previous, comparable, and subsequent 4-week periods for the past 5 years). The point where the hatched area begins is based on the mean and two standard deviations of these 4-week totals.
Alternate Text: The figure above shows selected notifiable disease reports for the United States, with comparison 4-week totals through May 26, 2012, with historical data. Reports of acute hepatitis C, legionellosis, and pertussis increased, with pertussis increasing beyond historical limits. Reports of giardiasis, acute hepatitis A, acute hepatitis B, measles, meningococcal disease, and mumps decreased.
TABLE II. Provisional cases of selected notifiable diseases, United States, weeks ending May 26, 2012, and May 28, 2011 (21st week)*
Reporting area
Chlamydia trachomatis infection
Coccidioidomycosis
Cryptosporidiosis
Current week
Previous 52 weeks
Cum 2012
Cum 2011
Current week
Previous 52 weeks
Cum 2012
Cum 2011
Current week
Previous 52 weeks
Cum 2012
Cum 2011
Med
Max
Med
Max
Med
Max
United States
9,679
26,966
30,635
482,014
561,269
30
407
591
6,429
8,916
41
144
414
2,059
2,431
New England
685
884
1,807
16,428
17,594
—
0
1
1
1
1
6
22
93
132
Connecticut
—
221
1,268
2,539
3,639
N
0
0
N
N
—
1
8
13
22
Maine
—
60
99
1,144
1,234
N
0
0
N
N
—
1
3
17
22
Massachusetts
555
442
680
9,150
9,174
N
0
0
N
N
—
2
8
39
57
New Hampshire
—
61
86
1,057
1,167
—
0
0
—
1
—
1
5
9
16
Rhode Island
103
80
186
1,982
1,771
—
0
1
1
—
—
0
10
3
1
Vermont
27
26
66
556
609
N
0
0
N
N
1
1
5
12
14
Mid. Atlantic
2,149
3,520
4,469
70,809
72,190
—
0
0
—
—
7
15
44
209
281
New Jersey
170
532
634
10,649
10,540
N
0
0
N
N
—
1
4
11
19
New York (Upstate)
684
726
2,215
14,365
14,048
N
0
0
N
N
3
4
16
42
53
New York City
459
1,228
1,491
23,236
26,521
N
0
0
N
N
—
2
6
31
29
Pennsylvania
836
1,089
1,305
22,559
21,081
N
0
0
N
N
4
7
27
125
180
E.N. Central
868
4,192
4,785
71,967
89,175
2
1
5
21
20
5
34
150
506
547
Illinois
—
1,199
1,494
15,233
26,094
N
0
0
N
N
—
3
25
38
52
Indiana
153
539
699
10,082
11,463
N
0
0
N
N
—
4
11
51
103
Michigan
413
941
1,210
18,623
20,503
—
0
3
11
13
—
7
14
95
94
Ohio
190
1,031
1,180
19,140
21,156
2
0
2
10
7
5
13
95
200
153
Wisconsin
112
466
608
8,889
9,959
N
0
0
N
N
—
8
73
122
145
W.N. Central
—
1,447
1,825
12,188
31,373
—
1
7
4
65
1
16
92
228
375
Iowa
—
204
439
2,083
4,415
N
0
0
N
N
—
5
18
85
127
Kansas
—
204
277
128
4,095
N
0
0
N
N
—
0
11
4
—
Minnesota
—
328
408
5,304
6,558
—
0
6
—
54
—
3
17
—
79
Missouri
—
487
683
—
11,320
—
0
2
3
10
1
5
60
76
61
Nebraska
—
126
218
2,316
2,577
—
0
2
1
1
—
2
11
30
65
North Dakota
—
48
78
932
966
N
0
0
N
N
—
0
12
—
—
South Dakota
—
65
93
1,425
1,442
N
0
0
N
N
—
2
13
33
43
S. Atlantic
3,105
5,478
7,586
112,565
114,930
—
0
2
2
4
13
23
55
416
445
Delaware
83
81
182
1,549
1,797
—
0
0
—
—
—
0
4
7
2
District of Columbia
—
130
224
2,551
2,684
—
0
0
—
—
—
0
1
—
4
Florida
838
1,502
1,702
31,519
31,300
N
0
0
N
N
9
8
17
179
154
Georgia
955
1,061
1,568
21,130
21,556
N
0
0
N
N
1
5
13
81
136
Maryland
—
489
824
7,988
10,627
—
0
2
2
4
3
1
7
41
23
North Carolina
1,159
997
1,688
20,331
19,203
N
0
0
N
N
—
0
46
35
35
South Carolina
—
515
1,278
11,271
11,721
N
0
0
N
N
—
2
6
28
48
Virginia
—
677
1,780
14,331
14,338
N
0
0
N
N
—
3
8
44
34
West Virginia
70
86
146
1,895
1,704
N
0
0
N
N
—
0
4
1
9
E.S. Central
230
1,881
2,820
33,423
38,611
—
0
0
—
—
5
7
26
103
108
Alabama
—
520
1,284
5,966
11,061
N
0
0
N
N
3
2
7
40
48
Kentucky
—
323
524
6,331
6,368
N
0
0
N
N
—
1
18
12
24
Mississippi
—
429
1,168
8,138
8,664
N
0
0
N
N
—
1
4
17
12
Tennessee
230
628
828
12,988
12,518
N
0
0
N
N
2
2
6
34
24
W.S. Central
817
3,423
4,418
63,497
73,629
—
0
1
—
2
5
11
45
128
123
Arkansas
333
317
412
6,930
6,605
N
0
0
N
N
—
0
3
11
5
Louisiana
484
566
1,120
7,562
10,422
—
0
1
—
2
—
1
10
27
16
Oklahoma
—
115
1,035
881
5,265
N
0
0
N
N
—
2
6
22
25
Texas
—
2,412
3,101
48,124
51,337
N
0
0
N
N
5
6
41
68
77
Mountain
877
1,698
2,430
31,746
35,393
4
303
480
5,079
6,923
1
10
29
171
208
Arizona
—
556
865
10,086
11,171
—
298
479
5,003
6,826
—
1
4
8
13
Colorado
418
393
705
7,361
8,807
N
0
0
N
N
—
2
11
23
57
Idaho
74
85
277
1,445
1,635
N
0
0
N
N
—
2
9
41
33
Montana
55
70
99
1,621
1,360
N
0
0
N
N
1
2
6
33
22
Nevada
209
208
285
3,746
4,405
4
2
6
51
34
—
0
2
7
5
New Mexico
94
220
424
4,814
4,315
—
1
7
7
38
—
2
9
39
45
Utah
27
134
191
2,565
2,837
—
1
5
16
22
—
1
5
9
20
Wyoming
—
29
69
108
863
—
0
2
2
3
—
0
3
11
13
Pacific
948
4,034
5,070
69,391
88,374
24
102
178
1,322
1,901
3
12
23
205
212
Alaska
36
106
152
2,229
2,483
N
0
0
N
N
—
0
3
1
4
California
563
3,055
4,094
49,924
68,592
24
102
178
1,322
1,901
—
6
16
115
100
Hawaii
—
116
147
1,993
2,289
N
0
0
N
N
—
0
1
2
—
Oregon
—
269
367
5,625
5,552
N
0
0
N
N
1
3
10
65
81
Washington
349
457
764
9,620
9,458
N
0
0
N
N
2
1
8
22
27
Territories
American Samoa
—
0
0
—
—
N
0
0
N
N
N
0
0
N
N
C.N.M.I.
—
—
—
—
—
—
—
—
—
—
—
—
—
—
—
Guam
—
—
—
—
189
—
—
—
—
—
—
—
—
—
—
Puerto Rico
—
106
289
2,540
2,474
N
0
0
N
N
N
0
0
N
N
U.S. Virgin Islands
—
15
26
269
335
—
0
0
—
—
—
0
0
—
—
C.N.M.I.: Commonwealth of Northern Mariana Islands.
U: Unavailable. —: No reported cases. N: Not reportable. NN: Not Nationally Notifiable. Cum: Cumulative year-to-date counts. Med: Median. Max: Maximum.
† Data for meningococcal disease, invasive caused by serogroups A, C, Y, and W-135; serogroup B; other serogroup; and unknown serogroup are available in Table I.
TABLE II. (Continued) Provisional cases of selected notifiable diseases, United States, weeks ending May 26, 2012, and May 28, 2011 (21st week)*
Reporting area
Rabies, animal
Salmonellosis
Shiga toxin-producing E. coli (STEC)†
Current week
Previous 52 weeks
Cum 2012
Cum 2011
Current week
Previous 52 weeks
Cum 2012
Cum 2011
Current week
Previous 52 weeks
Cum 2012
Cum 2011
Med
Max
Med
Max
Med
Max
United States
36
73
136
1,126
1,582
423
961
1,948
11,152
12,891
24
108
256
1,222
1,336
New England
5
7
16
154
100
4
32
86
451
686
—
3
12
37
53
Connecticut
3
4
10
75
52
—
7
30
121
158
—
1
5
16
21
Maine
1
2
6
45
21
4
2
7
41
44
—
0
3
1
7
Massachusetts
—
0
0
—
—
—
15
44
206
307
—
1
9
16
14
New Hampshire
—
0
3
10
6
—
3
8
26
59
—
0
3
2
8
Rhode Island
—
0
6
8
7
—
1
12
33
101
—
0
2
—
1
Vermont
1
0
4
16
14
—
2
8
24
17
—
0
3
2
2
Mid. Atlantic
7
13
36
163
290
35
91
209
1,301
1,515
7
10
35
128
166
New Jersey
—
0
0
—
—
—
21
49
241
321
—
2
8
12
49
New York (Upstate)
7
7
20
119
109
22
26
67
388
334
5
4
13
51
39
New York City
—
0
3
—
3
—
20
44
295
328
—
2
6
24
24
Pennsylvania
—
7
16
44
178
13
28
114
377
532
2
3
17
41
54
E.N. Central
2
3
20
34
35
43
77
186
1,194
1,490
1
15
50
174
221
Illinois
—
0
6
12
8
—
27
80
364
523
—
3
14
29
47
Indiana
—
0
7
—
1
—
12
36
152
171
—
2
10
34
37
Michigan
2
1
6
15
11
6
16
42
258
221
—
3
13
62
34
Ohio
—
0
6
7
15
37
22
46
375
340
1
3
9
39
46
Wisconsin
N
0
0
N
N
—
8
48
45
235
—
4
22
10
57
W.N. Central
1
2
8
28
41
34
44
113
575
857
6
18
58
171
180
Iowa
—
0
4
—
5
2
7
19
125
154
—
2
15
19
34
Kansas
—
0
3
7
13
—
10
27
54
102
—
2
8
5
22
Minnesota
—
0
0
—
—
—
9
33
—
217
—
4
24
—
49
Missouri
1
0
4
14
7
24
16
42
277
249
3
6
31
114
46
Nebraska
—
0
3
—
12
8
4
13
83
66
3
1
7
22
22
North Dakota
—
0
4
7
4
—
0
15
—
—
—
0
4
—
—
South Dakota
—
0
0
—
—
—
2
9
36
69
—
1
4
11
7
S. Atlantic
16
17
55
366
488
183
300
711
3,411
3,384
2
11
31
175
196
Delaware
—
0
0
—
—
—
3
12
41
39
—
0
2
3
3
District of Columbia
—
0
0
—
—
—
0
6
—
24
—
0
1
1
3
Florida
—
0
34
50
120
96
107
201
1,467
1,304
2
2
11
80
43
Georgia
—
0
0
—
—
23
41
111
457
652
—
2
7
31
38
Maryland
—
5
14
104
122
11
18
45
285
271
—
1
4
14
20
North Carolina
—
0
0
—
—
30
35
251
537
519
—
1
26
19
45
South Carolina
N
0
0
N
N
14
25
71
295
284
—
0
2
6
7
Virginia
15
10
25
178
244
9
22
57
310
254
—
2
8
19
35
West Virginia
1
1
37
34
2
—
0
52
19
37
—
0
2
2
2
E.S. Central
—
2
6
30
74
31
64
191
745
793
3
5
18
95
53
Alabama
—
1
5
25
36
14
21
70
216
210
—
1
15
23
7
Kentucky
—
0
2
5
5
—
9
30
93
144
—
1
5
14
15
Mississippi
—
0
0
—
—
5
20
87
212
205
—
0
4
8
8
Tennessee
—
0
3
—
33
12
16
51
224
234
3
2
11
50
23
W.S. Central
5
18
40
289
500
49
156
374
1,430
1,654
2
13
92
161
127
Arkansas
1
0
15
60
37
12
13
52
148
165
2
1
6
24
7
Louisiana
—
0
0
—
—
—
23
69
199
309
—
0
2
4
6
Oklahoma
—
0
21
21
12
—
14
102
143
136
—
1
16
24
12
Texas
4
15
34
208
451
37
104
227
940
1,044
—
9
76
109
102
Mountain
—
1
5
31
4
9
43
97
634
838
2
9
46
123
171
Arizona
N
0
0
N
N
—
15
36
202
278
—
2
6
43
49
Colorado
—
0
0
—
—
—
10
23
164
186
—
3
9
26
44
Idaho
—
0
1
—
—
1
2
8
34
57
—
2
8
19
23
Montana
N
0
0
N
N
2
2
10
27
30
—
0
4
9
10
Nevada
—
0
3
1
—
6
3
6
55
65
2
0
7
9
14
New Mexico
—
0
4
28
3
—
6
21
66
81
—
0
3
9
15
Utah
—
0
2
2
1
—
5
12
67
118
—
1
29
3
14
Wyoming
—
0
0
—
—
—
1
9
19
23
—
0
7
5
2
Pacific
—
3
14
31
50
35
94
184
1,411
1,674
1
17
37
158
169
Alaska
—
0
1
5
11
—
1
6
21
26
—
0
1
1
—
California
—
3
13
26
35
15
64
140
984
1,254
—
8
20
66
122
Hawaii
—
0
0
—
—
1
6
20
82
111
—
0
2
5
2
Oregon
—
0
2
—
4
—
6
16
115
123
1
2
11
51
21
Washington
—
0
11
—
—
19
12
42
209
160
—
3
18
35
24
Territories
American Samoa
N
0
0
N
N
—
0
1
1
—
—
0
0
—
—
C.N.M.I.
—
—
—
—
—
—
—
—
—
—
—
—
—
—
—
Guam
—
—
—
—
—
—
—
—
—
6
—
—
—
—
—
Puerto Rico
—
1
6
27
21
—
6
21
22
170
—
0
0
—
—
U.S. Virgin Islands
—
0
0
—
—
—
0
0
—
—
—
0
0
—
—
C.N.M.I.: Commonwealth of Northern Mariana Islands.
U: Unavailable. —: No reported cases. N: Not reportable. NN: Not Nationally Notifiable. Cum: Cumulative year-to-date counts. Med: Median. Max: Maximum.
† Illnesses with similar clinical presentation that result from Spotted fever group rickettsia infections are reported as Spotted fever rickettsioses. Rocky Mountain spotted fever (RMSF) caused by Rickettsia rickettsii, is the most common and well-known spotted fever.
TABLE II. (Continued) Provisional cases of selected notifiable diseases, United States, weeks ending May 26, 2012, and May 28, 2011 (21st week)*
Reporting area
Streptococcus pneumoniae,† invasive disease
Syphilis, primary and secondary
All ages
Age <5
Current week
Previous 52 weeks
Cum 2012
Cum 2011
Current week
Previous 52 weeks
Cum 2012
Cum 2011
Current week
Previous 52 weeks
Cum 2012
Cum 2011
Med
Max
Med
Max
Med
Max
United States
106
272
766
6,469
9,130
11
20
56
434
613
50
267
323
4,712
5,451
New England
3
12
28
288
449
—
1
4
21
25
6
7
23
164
162
Connecticut
—
6
13
137
206
—
0
2
6
6
—
0
13
9
21
Maine
2
2
8
57
61
—
0
1
1
2
—
0
2
7
8
Massachusetts
—
0
4
18
18
—
0
3
9
9
5
5
10
107
102
New Hampshire
—
1
6
38
60
—
0
1
4
2
—
0
2
15
11
Rhode Island
—
1
5
14
63
—
0
1
1
1
1
1
6
23
16
Vermont
1
1
4
24
41
—
0
2
—
5
—
0
2
3
4
Mid. Atlantic
22
44
157
1,028
1,384
2
2
11
47
69
8
32
49
551
680
New Jersey
—
11
26
236
398
—
0
2
11
27
—
4
8
46
101
New York (Upstate)
22
19
108
484
596
2
1
10
25
23
6
4
12
76
62
New York City
—
12
23
308
390
—
0
3
11
19
2
17
27
270
370
Pennsylvania
N
0
0
N
N
N
0
0
N
N
—
7
17
159
147
E.N. Central
26
61
101
1,409
1,786
1
3
10
87
102
1
30
62
430
753
Illinois
N
0
0
N
N
—
0
0
—
—
—
11
54
147
348
Indiana
—
11
33
254
434
—
1
2
11
19
1
3
9
77
70
Michigan
—
13
25
283
382
—
0
3
20
22
—
4
13
79
121
Ohio
20
24
46
639
694
1
1
6
40
49
—
7
15
107
191
Wisconsin
6
9
26
233
276
—
0
2
16
12
—
1
6
20
23
W.N. Central
1
12
35
241
317
—
1
3
15
25
—
4
13
29
130
Iowa
N
0
0
N
N
N
0
0
N
N
—
0
3
4
10
Kansas
N
0
0
N
N
N
0
0
N
N
—
0
4
—
6
Minnesota
—
9
26
166
252
—
1
3
10
21
—
2
8
23
57
Missouri
N
0
0
N
N
—
0
0
—
—
—
1
8
—
53
Nebraska
1
2
8
75
65
—
0
2
5
4
—
0
2
1
4
North Dakota
—
0
26
—
—
—
0
1
—
—
—
0
1
1
—
South Dakota
N
0
0
N
N
—
0
0
—
—
—
0
0
—
—
S. Atlantic
24
59
194
1,488
2,286
3
4
21
105
164
19
67
98
1,260
1,329
Delaware
—
1
5
20
29
—
0
0
—
—
1
0
6
20
5
District of Columbia
—
0
5
2
27
—
0
1
1
4
—
3
9
78
78
Florida
9
21
48
498
779
2
2
8
39
69
2
25
36
503
480
Georgia
5
18
46
454
715
1
1
6
36
46
7
12
59
220
227
Maryland
9
7
22
170
328
—
1
5
13
21
—
8
15
134
181
North Carolina
N
0
0
N
N
N
0
0
N
N
9
7
21
137
177
South Carolina
1
6
16
186
283
—
0
2
8
19
—
4
11
82
85
Virginia
N
0
0
N
N
—
0
0
—
—
—
4
13
84
94
West Virginia
—
3
83
158
125
—
0
8
8
5
—
0
2
2
2
E.S. Central
7
19
50
476
647
—
2
5
28
43
—
15
32
231
302
Alabama
N
0
0
N
N
N
0
0
N
N
—
3
10
33
92
Kentucky
—
4
9
105
128
—
0
1
4
13
—
2
9
46
44
Mississippi
N
0
0
N
N
—
0
0
—
—
—
3
21
65
51
Tennessee
7
16
47
371
519
—
1
4
24
30
—
5
14
87
115
W.S. Central
21
32
188
777
1,066
5
3
12
68
97
5
39
51
808
702
Arkansas
3
4
14
91
125
—
0
3
10
10
3
4
15
90
73
Louisiana
—
3
18
75
128
—
0
2
5
13
2
8
19
111
162
Oklahoma
N
0
0
N
N
—
0
0
—
—
—
1
7
18
23
Texas
18
24
156
611
813
5
2
11
53
74
—
25
41
589
444
Mountain
2
28
48
707
1,102
—
2
7
52
83
2
11
21
171
255
Arizona
—
11
27
358
488
—
1
4
28
33
—
4
11
65
100
Colorado
—
8
17
194
290
—
0
3
11
21
1
2
6
43
51
Idaho
N
0
0
N
N
—
0
0
—
—
—
0
3
8
3
Montana
N
0
0
N
N
N
0
0
N
N
—
0
1
—
5
Nevada
N
0
0
N
N
N
0
0
N
N
1
2
7
32
62
New Mexico
1
5
15
139
195
—
0
4
12
14
—
1
4
18
28
Utah
—
1
8
4
112
—
0
2
—
15
—
0
2
5
6
Wyoming
1
0
3
12
17
—
0
1
1
—
—
0
0
—
—
Pacific
—
2
9
55
93
—
0
2
11
5
9
56
75
1,068
1,138
Alaska
—
2
9
53
92
—
0
2
11
5
—
0
2
4
—
California
N
0
0
N
N
N
0
0
N
N
5
47
66
893
944
Hawaii
—
0
1
2
1
—
0
1
—
—
—
0
3
2
6
Oregon
N
0
0
N
N
N
0
0
N
N
—
2
12
68
34
Washington
N
0
0
N
N
N
0
0
N
N
4
5
12
101
154
Territories
American Samoa
N
0
0
N
N
—
0
0
—
—
—
0
0
—
—
C.N.M.I.
—
—
—
—
—
—
—
—
—
—
—
—
—
—
—
Guam
—
—
—
—
—
—
—
—
—
—
—
—
—
—
—
Puerto Rico
—
0
0
—
—
—
0
0
—
—
—
5
15
96
86
U.S. Virgin Islands
—
0
0
—
—
—
0
0
—
—
—
0
0
—
—
C.N.M.I.: Commonwealth of Northern Mariana Islands.
U: Unavailable. —: No reported cases. N: Not reportable. NN: Not Nationally Notifiable. Cum: Cumulative year-to-date counts. Med: Median. Max: Maximum.
† Includes drug resistant and susceptible cases of invasive Streptococcus pneumoniae disease among children <5 years and among all ages. Case definition: Isolation of S. pneumoniae from a normally sterile body site (e.g., blood or cerebrospinal fluid).
TABLE II. (Continued) Provisional cases of selected notifiable diseases, United States, weeks ending May 26, 2012, and May 28, 2011 (21st week)*
Reporting area
Varicella (chickenpox)
West Nile virus disease†
Neuroinvasive
Nonneuroinvasive§
Current week
Previous 52 weeks
Cum 2012
Cum 2011
Current week
Previous 52 weeks
Cum 2012
Cum 2011
Current week
Previous 52 weeks
Cum 2012
Cum 2011
Med
Max
Med
Max
Med
Max
United States
190
276
397
5,813
6,723
—
0
63
1
3
—
0
33
—
2
New England
10
26
53
510
562
—
0
3
—
—
—
0
1
—
—
Connecticut
2
5
20
97
110
—
0
2
—
—
—
0
1
—
—
Maine
2
4
14
110
110
—
0
0
—
—
—
0
0
—
—
Massachusetts
—
10
19
207
209
—
0
2
—
—
—
0
1
—
—
New Hampshire
—
1
10
—
62
—
0
0
—
—
—
0
0
—
—
Rhode Island
2
1
6
30
19
—
0
1
—
—
—
0
0
—
—
Vermont
4
3
9
66
52
—
0
1
—
—
—
0
0
—
—
Mid. Atlantic
17
33
88
973
757
—
0
11
—
—
—
0
6
—
—
New Jersey
—
10
54
602
248
—
0
1
—
—
—
0
2
—
—
New York (Upstate)
N
0
0
N
N
—
0
5
—
—
—
0
4
—
—
New York City
—
0
0
—
—
—
0
4
—
—
—
0
1
—
—
Pennsylvania
17
19
34
371
509
—
0
2
—
—
—
0
1
—
—
E.N. Central
50
68
127
1,445
1,717
—
0
13
—
—
—
0
7
—
—
Illinois
—
17
38
395
397
—
0
6
—
—
—
0
5
—
—
Indiana
3
6
20
175
116
—
0
2
—
—
—
0
1
—
—
Michigan
12
19
45
433
481
—
0
7
—
—
—
0
2
—
—
Ohio
35
19
47
441
507
—
0
3
—
—
—
0
3
—
—
Wisconsin
—
4
14
1
216
—
0
1
—
—
—
0
1
—
—
W.N. Central
—
12
32
200
316
—
0
9
1
1
—
0
7
—
—
Iowa
N
0
0
N
N
—
0
2
1
—
—
0
2
—
—
Kansas
—
7
21
85
157
—
0
1
—
—
—
0
0
—
—
Minnesota
—
0
1
—
—
—
0
1
—
—
—
0
1
—
—
Missouri
—
5
18
94
105
—
0
2
—
1
—
0
2
—
—
Nebraska
—
0
3
9
11
—
0
4
—
—
—
0
3
—
—
North Dakota
—
0
7
—
17
—
0
1
—
—
—
0
1
—
—
South Dakota
—
1
6
12
26
—
0
0
—
—
—
0
1
—
—
S. Atlantic
18
30
55
615
936
—
0
12
—
—
—
0
6
—
—
Delaware
—
0
2
2
4
—
0
1
—
—
—
0
0
—
—
District of Columbia
—
0
2
—
9
—
0
3
—
—
—
0
3
—
—
Florida
15
17
50
488
459
—
0
4
—
—
—
0
2
—
—
Georgia
N
0
0
N
N
—
0
4
—
—
—
0
1
—
—
Maryland
N
0
0
N
N
—
0
5
—
—
—
0
3
—
—
North Carolina
N
0
0
N
N
—
0
1
—
—
—
0
0
—
—
South Carolina
—
0
2
1
12
—
0
0
—
—
—
0
0
—
—
Virginia
3
8
24
95
211
—
0
2
—
—
—
0
1
—
—
West Virginia
—
3
16
29
241
—
0
1
—
—
—
0
0
—
—
E.S. Central
8
5
14
111
155
—
0
11
—
—
—
0
5
—
1
Alabama
8
5
14
105
147
—
0
2
—
—
—
0
0
—
—
Kentucky
N
0
0
N
N
—
0
2
—
—
—
0
1
—
—
Mississippi
—
0
3
6
8
—
0
5
—
—
—
0
4
—
1
Tennessee
N
0
0
N
N
—
0
3
—
—
—
0
1
—
—
W.S. Central
72
55
213
1,270
1,274
—
0
4
—
1
—
0
3
—
—
Arkansas
2
4
28
83
155
—
0
1
—
—
—
0
0
—
—
Louisiana
—
1
6
20
44
—
0
1
—
—
—
0
2
—
—
Oklahoma
N
0
0
N
N
—
0
1
—
—
—
0
0
—
—
Texas
70
49
204
1,167
1,075
—
0
3
—
1
—
0
3
—
—
Mountain
10
28
62
632
939
—
0
11
—
1
—
0
5
—
1
Arizona
—
10
26
204
383
—
0
7
—
1
—
0
4
—
1
Colorado
4
7
32
201
200
—
0
2
—
—
—
0
2
—
—
Idaho
N
0
0
N
N
—
0
1
—
—
—
0
1
—
—
Montana
5
2
7
50
108
—
0
1
—
—
—
0
0
—
—
Nevada
N
0
0
N
N
—
0
4
—
—
—
0
2
—
—
New Mexico
1
1
8
51
24
—
0
1
—
—
—
0
0
—
—
Utah
—
5
20
118
217
—
0
1
—
—
—
0
1
—
—
Wyoming
—
0
2
8
7
—
0
1
—
—
—
0
1
—
—
Pacific
5
3
9
57
67
—
0
18
—
—
—
0
8
—
—
Alaska
3
1
4
33
27
—
0
0
—
—
—
0
0
—
—
California
—
0
4
7
19
—
0
18
—
—
—
0
8
—
—
Hawaii
2
0
4
17
21
—
0
0
—
—
—
0
0
—
—
Oregon
N
0
0
N
N
—
0
0
—
—
—
0
0
—
—
Washington
N
0
0
N
N
—
0
0
—
—
—
0
0
—
—
Territories
American Samoa
N
0
0
N
N
—
0
0
—
—
—
0
0
—
—
C.N.M.I.
—
—
—
—
—
—
—
—
—
—
—
—
—
—
—
Guam
—
—
—
—
16
—
—
—
—
—
—
—
—
—
—
Puerto Rico
—
6
14
60
193
—
0
0
—
—
—
0
0
—
—
U.S. Virgin Islands
—
0
0
—
—
—
0
0
—
—
—
0
0
—
—
C.N.M.I.: Commonwealth of Northern Mariana Islands.
U: Unavailable. —: No reported cases. N: Not reportable. NN: Not Nationally Notifiable. Cum: Cumulative year-to-date counts. Med: Median. Max: Maximum.
† Updated weekly from reports to the Division of Vector-Borne Infectious Diseases, National Center for Zoonotic, Vector-Borne, and Enteric Diseases (ArboNET Surveillance). Data for California serogroup, eastern equine, Powassan, St. Louis, and western equine diseases are available in Table I.
§ Not reportable in all states. Data from states where the condition is not reportable are excluded from this table, except starting in 2007 for the domestic arboviral diseases and influenza-associated pediatric mortality, and in 2003 for SARS-CoV. Reporting exceptions are available at http://www.cdc.gov/osels/ph_surveillance/nndss/phs/infdis.htm.
TABLE III. Deaths in 122 U.S. cities,* week ending May 26, 2012 (21st week)
Reporting area
All causes, by age (years)
P&I† Total
Reporting area (Continued)
All causes, by age (years)
P&I† Total
All Ages
=65
45–64
25–44
1–24
<1
All Ages
=65
45–64
25–44
1–24
<1
New England
499
337
120
23
5
14
46
S. Atlantic
925
530
287
68
23
17
56
Boston, MA
126
74
37
10
1
4
17
Atlanta, GA
138
63
60
10
4
1
6
Bridgeport, CT
19
12
6
1
—
—
3
Baltimore, MD
157
86
50
11
5
5
19
Cambridge, MA
13
10
3
—
—
—
—
Charlotte, NC
139
86
35
14
2
2
6
Fall River, MA
26
20
4
2
—
—
1
Jacksonville, FL
2
—
1
1
—
—
—
Hartford, CT
62
41
18
1
—
2
5
Miami, FL
101
64
29
5
2
1
5
Lowell, MA
23
19
4
—
—
—
—
Norfolk, VA
52
32
14
4
1
1
4
Lynn, MA
10
8
2
—
—
—
—
Richmond, VA
53
26
19
4
2
2
4
New Bedford, MA
20
17
3
—
—
—
1
Savannah, GA
81
58
17
5
1
—
5
New Haven, CT
36
22
8
2
2
2
5
St. Petersburg, FL
56
39
11
3
2
1
1
Providence, RI
49
31
13
3
—
2
2
Tampa, FL
39
21
14
1
3
—
1
Somerville, MA
—
—
—
—
—
—
—
Washington, D.C.
92
48
31
8
1
4
4
Springfield, MA
30
24
1
1
1
3
1
Wilmington, DE
15
7
6
2
—
—
1
Waterbury, CT
33
21
10
1
1
—
1
E.S. Central
922
622
213
45
27
15
77
Worcester, MA
52
38
11
2
—
1
10
Birmingham, AL
150
95
36
7
5
7
6
Mid. Atlantic
1,769
1,217
426
83
29
14
71
Chattanooga, TN
92
71
16
2
3
—
10
Albany, NY
40
27
12
1
—
—
—
Knoxville, TN
120
74
36
5
5
—
18
Allentown, PA
32
23
6
2
1
—
2
Lexington, KY
76
52
15
4
4
1
2
Buffalo, NY
71
49
16
2
3
1
2
Memphis, TN
164
105
44
11
3
1
22
Camden, NJ
15
9
4
—
1
1
—
Mobile, AL
135
92
31
7
1
4
9
Elizabeth, NJ
15
9
4
2
—
—
3
Montgomery, AL
56
44
9
3
—
—
4
Erie, PA
51
40
9
2
—
—
1
Nashville, TN
129
89
26
6
6
2
6
Jersey City, NJ
11
5
2
3
1
—
—
W.S. Central
1,116
685
259
100
41
30
66
New York City, NY
1,005
689
251
46
14
5
36
Austin, TX
88
57
22
6
2
1
8
Newark, NJ
28
14
10
2
2
—
2
Baton Rouge, LA
77
39
12
12
10
4
—
Paterson, NJ
22
14
4
3
—
1
—
Corpus Christi, TX
53
36
13
1
1
2
8
Philadelphia, PA
160
102
48
7
1
2
2
Dallas, TX
215
119
61
19
8
7
14
Pittsburgh, PA§
46
31
10
3
2
—
5
El Paso, TX
107
80
16
8
1
2
7
Reading, PA
31
24
5
—
1
1
1
Fort Worth, TX
U
U
U
U
U
U
U
Rochester, NY
79
54
18
3
1
3
4
Houston, TX
138
79
17
25
11
6
8
Schenectady, NY
18
13
4
1
—
—
—
Little Rock, AR
72
39
27
4
—
2
3
Scranton, PA
22
17
5
—
—
—
—
New Orleans, LA
U
U
U
U
U
U
U
Syracuse, NY
67
57
6
3
1
—
10
San Antonio, TX
256
171
57
16
7
5
14
Trenton, NJ
26
18
6
1
1
—
—
Shreveport, LA
45
24
14
5
1
1
—
Utica, NY
10
8
2
—
—
—
1
Tulsa, OK
65
41
20
4
—
—
4
Yonkers, NY
20
14
4
2
—
—
2
Mountain
1,217
805
298
69
24
21
59
E.N. Central
1,942
1,267
491
105
42
37
124
Albuquerque, NM
126
83
26
14
1
2
10
Akron, OH
63
39
19
1
2
2
7
Boise, ID
66
51
11
2
1
1
4
Canton, OH
41
30
10
—
—
1
3
Colorado Springs, CO
60
37
17
6
—
—
2
Chicago, IL
244
148
65
17
9
5
20
Denver, CO
85
45
34
4
2
—
—
Cincinnati, OH
89
51
22
9
4
3
7
Las Vegas, NV
307
200
85
11
5
6
21
Cleveland, OH
230
157
62
6
3
2
10
Ogden, UT
36
29
6
1
—
—
2
Columbus, OH
208
140
47
13
5
3
8
Phoenix, AZ
202
119
52
18
8
5
4
Dayton, OH
142
101
32
7
1
1
9
Pueblo, CO
26
18
8
—
—
—
—
Detroit, MI
143
73
55
9
2
4
6
Salt Lake City, UT
136
94
27
8
4
3
7
Evansville, IN
68
53
14
—
—
1
5
Tucson, AZ
173
129
32
5
3
4
9
Fort Wayne, IN
80
53
16
8
2
1
2
Pacific
1,699
1,216
347
87
30
18
164
Gary, IN
7
6
—
1
—
—
—
Berkeley, CA
11
10
1
—
—
—
1
Grand Rapids, MI
61
48
10
2
—
1
6
Fresno, CA
129
89
28
7
2
3
12
Indianapolis, IN
178
102
56
13
5
2
21
Glendale, CA
35
27
5
3
—
—
6
Lansing, MI
46
30
13
2
1
—
2
Honolulu, HI
60
47
11
2
—
—
10
Milwaukee, WI
57
38
14
3
1
1
2
Long Beach, CA
68
47
14
6
1
—
8
Peoria, IL
49
35
7
—
2
5
6
Los Angeles, CA
244
164
61
12
4
3
35
Rockford, IL
62
38
16
6
1
1
—
Pasadena, CA
26
22
3
1
—
—
6
South Bend, IN
39
28
9
1
1
—
4
Portland, OR
117
82
22
7
4
2
4
Toledo, OH
71
48
13
6
1
3
1
Sacramento, CA
205
147
39
13
4
2
11
Youngstown, OH
64
49
11
1
2
1
5
San Diego, CA
168
125
29
9
4
1
19
W.N. Central
620
408
154
32
7
19
43
San Francisco, CA
118
81
26
5
4
2
13
Des Moines, IA
87
65
21
1
—
—
10
San Jose, CA
198
149
37
8
2
1
15
Duluth, MN
27
20
6
1
—
—
3
Santa Cruz, CA
35
28
6
1
—
—
7
Kansas City, KS
32
18
7
4
1
2
3
Seattle, WA
101
73
18
8
1
1
7
Kansas City, MO
75
54
14
5
—
2
2
Spokane, WA
65
46
13
2
2
2
5
Lincoln, NE
28
22
3
—
2
1
2
Tacoma, WA
119
79
34
3
2
1
5
Minneapolis, MN
65
39
15
5
1
5
3
Total¶
10,709
7,087
2,595
612
228
185
706
Omaha, NE
81
59
14
5
1
2
5
St. Louis, MO
105
51
43
7
1
3
4
St. Paul, MN
55
40
12
2
—
1
5
Wichita, KS
65
40
19
2
1
3
6
U: Unavailable. —: No reported cases.
* Mortality data in this table are voluntarily reported from 122 cities in the United States, most of which have populations of >100,000. A death is reported by the place of its occurrence and by the week that the death certificate was filed. Fetal deaths are not included.
† Pneumonia and influenza.
§ Because of changes in reporting methods in this Pennsylvania city, these numbers are partial counts for the current week. Complete counts will be available in 4 to 6 weeks.