Persons using assistive technology might not be able to fully access information in this file. For assistance, please send e-mail to: mmwrq@cdc.gov. Type 508 Accommodation and the title of the report in the subject line of e-mail.
Notifiable Diseases and Mortality Tables
Table I Summary of provisional cases of selected notifiable diseases, United States, cumulative, week ending July 7, 2012 (27th Week)
Figure I Selected notifiable disease reports, United States, comparison of provisional 4-week totals ending July 7, 2012, with historical data
Table II Provisional cases of selected notifiable diseases, United States, weeks ending July 7, 2012 and July 9, 2011 (27th Week)
Table III Deaths in 122 U.S. cities, week ending July 7, 2012 (27th Week)
Table IV Provisional cases of selected notifiable diseases, United States, 2nd quarter ending June 30, 2012
TABLE I. Provisional cases of infrequently reported notifiable diseases (<1,000 cases reported during the preceding year) — United States, week ending July 7, 2012 (27th week)*
TABLE I. (Continued) Provisional cases of infrequently reported notifiable diseases (<1,000 cases reported during the preceding year) — United States, week ending July 7, 2012 (27th week)*
—: No reported cases. N: Not reportable. NN: Not Nationally Notifiable. Cum: Cumulative year-to-date counts.
§ Not reportable in all states. Data from states where the condition is not reportable are excluded from this table except starting in 2007 for the arboviral diseases, STD data, TB data, and influenza-associated pediatric mortality, and in 2003 for SARS-CoV. Reporting exceptions are available at http://www.cdc.gov/osels/ph_surveillance/nndss/phs/infdis.htm.
¶ Includes both neuroinvasive and nonneuroinvasive. Updated weekly from reports to the Division of Vector-Borne Infectious Diseases, National Center for Zoonotic, Vector-Borne, and Enteric Diseases (ArboNET Surveillance). Data for West Nile virus are available in Table II.
** Data for H. influenzae (all ages, all serotypes) are available in Table II.
†† Updated weekly from reports to the Influenza Division, National Center for Immunization and Respiratory Diseases. Since October 2, 2011, 32 influenza-associated pediatric deaths occurring during the 2011-12 influenza season have been reported.
§§ The one measles case reported for the current week was indigenous.
¶¶ Data for meningococcal disease (all serogroups) are available in Table II.
*** CDC discontinued reporting of individual confirmed and probable cases of 2009 pandemic influenza A (H1N1) virus infections on July 24, 2009. During 2009, four cases of human infection with novel influenza A viruses, different from the 2009 pandemic influenza A (H1N1) strain, were reported to CDC. The four cases of novel influenza A virus infection reported to CDC during 2010, the eight cases reported during 2011, and the one case reported in 2012 are different from the 2009 pandemic influenza A (H1N1) virus. Total case counts are provided by the Influenza Division, National Center for Immunization and Respiratory Diseases (NCIRD).
††† No rubella cases were reported for the current week.
§§§ Updated weekly from reports to the Division of STD Prevention, National Center for HIV/AIDS, Viral Hepatitis, STD, and TB Prevention.
¶¶¶ There were no cases of viral hemorrhagic fever reported during the current week. See Table II for dengue hemorrhagic fever.
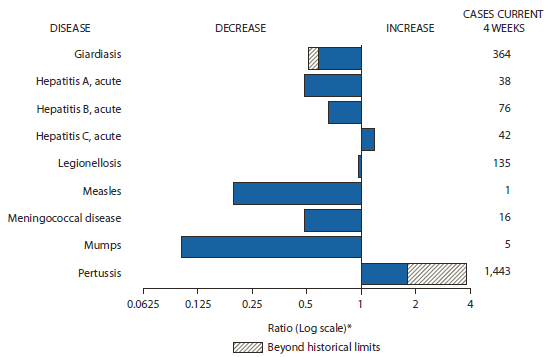
FIGURE I. Selected notifiable disease reports, United States, comparison of provisional 4-week totals July 7, 2012, with historical data
* Ratio of current 4-week total to mean of 15 4-week totals (from previous, comparable, and subsequent 4-week periods for the past 5 years). The point where the hatched area begins is based on the mean and two standard deviations of these 4-week totals.
Alternate Text: The figure above shows selected notifiable disease reports for the United States, with comparison of 4-week totals through July 7, 2012, with historical data. Reports of acute hepatitis C, and pertussis increased, with pertussis increasing beyond historical limits. Reports of giardiasis, acute hepatitis A, acute hepatitis B, legionellosis, measles, meningococcal disease, and mumps decreased, with giardiasis decreasing beyond historical limits.
TABLE II. Provisional cases of selected notifiable diseases, United States, weeks ending July 7, 2012, and July 9, 2011 (27th week)*
Reporting area
Chlamydia trachomatis infection
Coccidioidomycosis
Cryptosporidiosis
Current week
Previous 52 weeks
Cum 2012
Cum 2011
Current week
Previous 52 weeks
Cum 2012
Cum 2011
Current week
Previous 52 weeks
Cum 2012
Cum 2011
Med
Max
Med
Max
Med
Max
United States
8,586
26,669
30,645
637,825
714,682
198
410
591
9,050
11,274
37
119
416
2,726
3,598
New England
535
909
1,807
22,475
22,248
—
0
1
1
1
1
6
22
117
200
Connecticut
48
232
1,268
4,705
4,920
N
0
0
N
N
—
1
8
18
36
Maine
58
57
99
1,448
1,588
N
0
0
N
N
—
1
4
21
27
Massachusetts
374
453
680
11,686
11,402
N
0
0
N
N
—
2
8
39
85
New Hampshire
2
62
86
1,566
1,460
—
0
0
—
1
—
1
4
15
31
Rhode Island
8
80
186
2,299
2,128
—
0
1
1
—
1
0
10
6
1
Vermont
45
27
71
771
750
N
0
0
N
N
—
1
5
18
20
Mid. Atlantic
1,698
3,518
4,469
86,779
91,071
—
0
1
4
3
6
14
44
300
413
New Jersey
97
535
631
13,683
13,402
N
0
0
N
N
—
1
4
11
28
New York (Upstate)
579
727
2,215
18,608
17,915
N
0
0
N
N
3
4
19
68
73
New York City
314
1,218
1,491
26,019
33,456
N
0
0
N
N
—
2
6
46
39
Pennsylvania
708
1,095
1,305
28,469
26,298
N
0
1
N
N
3
7
27
175
273
E.N. Central
579
4,228
4,785
95,753
112,677
1
1
5
29
27
4
32
150
654
789
Illinois
16
1,187
1,494
25,689
32,983
N
0
0
N
N
—
3
25
66
78
Indiana
159
563
798
14,195
14,490
N
0
0
N
N
1
3
11
67
142
Michigan
342
940
1,210
20,389
25,775
1
0
3
16
17
1
7
13
118
146
Ohio
—
1,030
1,180
24,031
26,910
—
0
2
13
10
—
12
95
243
222
Wisconsin
62
467
608
11,449
12,519
N
0
0
N
N
2
8
73
160
201
W.N. Central
5
1,066
1,825
19,213
39,776
—
2
8
67
80
2
16
92
319
619
Iowa
3
213
514
5,797
5,556
N
0
0
N
N
—
5
18
115
197
Kansas
—
204
277
128
5,274
N
0
0
N
N
—
0
11
4
—
Minnesota
2
323
408
7,269
8,372
—
2
7
60
68
—
0
17
—
134
Missouri
—
198
683
—
14,308
—
0
2
6
10
1
5
60
101
97
Nebraska
—
127
218
3,154
3,279
—
0
2
1
2
1
2
11
53
95
North Dakota
—
48
78
1,235
1,203
N
0
0
N
N
—
0
12
—
12
South Dakota
—
66
93
1,630
1,784
N
0
0
N
N
—
2
10
46
84
S. Atlantic
2,412
5,457
7,543
142,959
147,350
—
0
1
2
4
7
20
55
507
589
Delaware
58
82
182
1,998
2,251
—
0
0
—
—
—
0
4
7
3
District of Columbia
—
129
224
3,395
3,329
—
0
0
—
—
—
0
0
—
—
Florida
540
1,501
1,735
39,911
39,804
N
0
0
N
N
4
8
17
219
211
Georgia
343
1,055
1,285
26,397
28,061
N
0
0
N
N
—
4
13
87
158
Maryland
—
478
824
10,539
13,465
—
0
1
2
4
1
1
7
51
39
North Carolina
733
991
1,686
25,782
25,977
N
0
0
N
N
—
0
46
43
35
South Carolina
—
509
1,278
14,132
14,819
N
0
0
N
N
—
2
6
30
74
Virginia
659
678
1,780
18,445
17,489
N
0
0
N
N
2
3
8
69
52
West Virginia
79
84
146
2,360
2,155
N
0
0
N
N
—
0
4
1
17
E.S. Central
853
1,982
2,820
50,312
49,764
—
0
0
—
—
3
6
26
129
164
Alabama
—
584
840
12,697
14,555
N
0
0
N
N
3
2
5
53
74
Kentucky
333
321
524
8,440
8,322
N
0
0
N
N
—
1
18
13
30
Mississippi
378
435
1,168
12,612
11,114
N
0
0
N
N
—
1
4
21
17
Tennessee
142
634
828
16,563
15,773
N
0
0
N
N
—
2
5
42
43
W.S. Central
634
3,422
4,436
83,320
94,727
—
0
1
—
2
8
10
45
184
209
Arkansas
289
317
412
8,674
8,487
N
0
0
N
N
—
1
4
16
8
Louisiana
261
500
1,120
10,603
14,434
—
0
1
—
2
—
1
10
38
39
Oklahoma
4
112
1,015
2,037
6,765
N
0
0
N
N
4
1
4
38
44
Texas
80
2,378
3,101
62,006
65,041
N
0
0
N
N
4
6
41
92
118
Mountain
846
1,718
2,430
42,809
44,570
190
296
477
7,090
8,732
2
10
29
237
306
Arizona
318
586
868
15,530
14,475
185
291
476
6,979
8,601
1
0
4
12
18
Colorado
217
392
705
8,741
10,597
N
0
0
N
N
—
2
11
34
71
Idaho
—
92
277
1,915
2,041
N
0
0
N
N
1
2
9
56
51
Montana
48
72
100
2,029
1,706
N
0
1
N
N
—
1
6
38
33
Nevada
146
206
285
4,911
5,603
4
2
6
69
48
—
0
2
8
8
New Mexico
90
224
453
6,100
5,502
—
1
7
13
44
—
2
9
53
69
Utah
27
139
191
3,475
3,557
1
1
4
23
33
—
1
3
19
33
Wyoming
—
19
69
108
1,089
—
0
2
4
3
—
0
9
17
23
Pacific
1,024
3,963
5,070
94,205
112,499
7
106
179
1,857
2,425
4
11
23
279
309
Alaska
28
106
152
2,832
3,063
N
0
0
N
N
—
0
3
2
5
California
582
3,055
4,094
69,771
87,537
7
105
179
1,855
2,418
2
6
16
154
153
Hawaii
—
120
147
2,841
2,954
N
0
0
N
N
—
0
1
2
—
Oregon
152
265
368
7,215
7,109
N
0
2
N
N
1
3
10
90
115
Washington
262
446
764
11,546
11,836
N
0
10
N
N
1
1
8
31
36
Territories
American Samoa
—
0
0
—
—
N
0
0
N
N
N
0
0
N
N
C.N.M.I.
—
—
—
—
—
—
—
—
—
—
—
—
—
—
—
Guam
—
21
30
—
545
—
0
0
—
—
—
0
0
—
—
Puerto Rico
—
104
289
3,093
3,245
N
0
0
N
N
N
0
0
N
N
U.S. Virgin Islands
—
15
26
326
418
—
0
0
—
—
—
0
0
—
—
C.N.M.I.: Commonwealth of Northern Mariana Islands.
U: Unavailable. —: No reported cases. N: Not reportable. NN: Not Nationally Notifiable. Cum: Cumulative year-to-date counts. Med: Median. Max: Maximum.
† Data for meningococcal disease, invasive caused by serogroups A, C, Y, and W-135; serogroup B; other serogroup; and unknown serogroup are available in Table I.
TABLE II. (Continued) Provisional cases of selected notifiable diseases, United States, weeks ending July 7, 2012, and July 9, 2011 (27th week)*
Reporting area
Rabies, animal
Salmonellosis
Shiga toxin-producing E. coli (STEC)†
Current week
Previous 52 weeks
Cum 2012
Cum 2011
Current week
Previous 52 weeks
Cum 2012
Cum 2011
Current week
Previous 52 weeks
Cum 2012
Cum 2011
Med
Max
Med
Max
Med
Max
United States
47
70
133
1,528
2,186
406
808
1,946
16,586
19,698
31
98
256
1,863
2,238
New England
1
7
16
182
144
4
28
80
605
1,015
—
3
12
56
96
Connecticut
—
4
10
88
81
—
7
20
195
247
—
1
5
23
28
Maine
1
1
6
50
29
2
3
9
79
58
—
0
3
4
13
Massachusetts
—
0
0
—
—
—
13
44
206
484
—
1
9
16
38
New Hampshire
—
0
3
15
10
—
3
8
47
90
—
0
3
6
13
Rhode Island
—
0
6
11
9
—
2
12
43
108
—
0
2
1
1
Vermont
—
0
4
18
15
2
2
8
35
28
—
0
3
6
3
Mid. Atlantic
15
12
36
219
388
52
88
209
1,927
2,410
7
12
35
211
258
New Jersey
—
0
0
—
—
—
17
48
319
562
—
2
8
32
67
New York (Upstate)
15
7
20
175
151
28
26
67
560
527
6
4
13
72
69
New York City
—
0
1
—
8
—
19
41
443
517
—
1
6
43
39
Pennsylvania
—
6
16
44
229
24
27
114
605
804
1
3
17
64
83
E.N. Central
1
3
20
62
65
5
78
186
1,719
2,306
—
13
50
259
364
Illinois
—
0
6
26
18
—
26
80
580
814
—
3
14
57
92
Indiana
—
0
7
1
5
—
11
36
237
261
—
2
10
55
56
Michigan
1
1
6
22
22
5
16
42
328
345
—
3
13
74
48
Ohio
—
0
6
13
20
—
22
46
491
510
—
3
9
57
72
Wisconsin
N
0
0
N
N
—
6
40
83
376
—
2
22
16
96
W.N. Central
—
2
13
32
83
14
43
113
834
1,319
3
15
58
243
361
Iowa
—
0
4
—
9
—
7
19
194
226
—
2
15
48
81
Kansas
—
0
3
7
18
—
10
27
54
164
—
2
8
5
49
Minnesota
—
0
6
—
19
—
3
33
—
340
—
0
24
—
79
Missouri
—
0
4
18
12
9
16
42
420
371
3
5
31
145
89
Nebraska
—
0
3
—
18
5
4
13
123
108
—
1
7
33
44
North Dakota
—
0
10
7
7
—
0
19
—
20
—
0
4
—
4
South Dakota
—
0
0
—
—
—
2
7
43
90
—
1
4
12
15
S. Atlantic
18
18
45
513
641
170
245
708
4,939
5,023
8
11
31
255
279
Delaware
—
0
0
—
—
—
3
12
55
63
—
0
2
5
8
District of Columbia
—
0
0
—
—
—
1
7
23
36
—
0
1
4
3
Florida
—
0
34
54
120
125
106
201
2,162
1,957
4
3
11
109
54
Georgia
—
0
0
—
—
—
27
109
480
940
—
2
6
36
60
Maryland
—
5
16
156
162
11
18
45
390
395
2
1
4
28
28
North Carolina
—
0
0
—
—
—
41
251
891
707
—
1
26
29
57
South Carolina
N
0
0
N
N
17
25
71
474
483
1
0
7
16
8
Virginia
15
11
25
264
299
17
22
57
445
402
1
1
8
26
58
West Virginia
3
1
9
39
60
—
0
52
19
40
—
0
2
2
3
E.S. Central
1
2
6
40
92
30
68
191
1,268
1,389
2
5
18
127
130
Alabama
1
1
5
34
44
12
21
70
353
371
—
1
15
25
36
Kentucky
—
0
2
6
8
—
8
30
137
220
—
1
5
22
24
Mississippi
—
0
0
—
—
4
24
87
390
420
—
0
3
11
14
Tennessee
—
0
2
—
40
14
17
51
388
378
2
2
12
69
56
W.S. Central
11
16
40
367
668
94
139
374
2,348
2,598
2
13
92
250
199
Arkansas
—
0
15
61
40
24
14
52
248
234
1
1
6
31
18
Louisiana
—
0
1
—
3
1
23
69
442
522
—
0
3
13
8
Oklahoma
—
0
21
26
31
23
15
102
282
215
1
2
16
42
19
Texas
11
14
29
280
594
46
86
227
1,376
1,627
—
8
76
164
154
Mountain
—
1
7
38
21
9
43
97
922
1,163
7
9
46
193
271
Arizona
N
0
0
N
N
5
14
36
294
359
3
2
6
67
66
Colorado
—
0
0
—
—
—
10
23
218
258
—
2
9
37
68
Idaho
—
0
1
—
—
1
2
8
59
73
3
1
8
33
44
Montana
N
0
0
N
N
1
2
10
41
54
—
0
4
11
19
Nevada
—
0
3
5
2
1
3
7
81
88
1
1
7
12
17
New Mexico
—
1
5
31
4
—
5
21
98
128
—
1
3
16
19
Utah
—
0
1
2
3
—
5
12
102
168
—
1
29
10
27
Wyoming
—
0
4
—
12
1
1
9
29
35
—
0
8
7
11
Pacific
—
4
14
75
84
28
89
179
2,024
2,475
2
15
36
269
280
Alaska
—
0
1
5
11
1
1
6
33
36
—
0
0
—
—
California
—
4
13
67
65
13
63
142
1,428
1,865
—
7
20
126
192
Hawaii
—
0
0
—
—
—
5
20
118
152
—
0
2
6
5
Oregon
—
0
2
3
8
—
6
16
168
185
1
2
11
74
32
Washington
—
0
11
—
—
14
12
42
277
237
1
3
18
63
51
Territories
American Samoa
N
0
0
N
N
—
0
1
1
—
—
0
0
—
—
C.N.M.I.
—
—
—
—
—
—
—
—
—
—
—
—
—
—
—
Guam
—
0
0
—
—
—
0
4
—
10
—
0
0
—
—
Puerto Rico
—
1
5
27
26
—
3
21
23
239
—
0
0
—
—
U.S. Virgin Islands
—
0
0
—
—
—
0
6
—
—
—
0
0
—
—
C.N.M.I.: Commonwealth of Northern Mariana Islands.
U: Unavailable. —: No reported cases. N: Not reportable. NN: Not Nationally Notifiable. Cum: Cumulative year-to-date counts. Med: Median. Max: Maximum.
† Illnesses with similar clinical presentation that result from Spotted fever group rickettsia infections are reported as Spotted fever rickettsioses. Rocky Mountain spotted fever (RMSF) caused by Rickettsia rickettsii, is the most common and well-known spotted fever.
TABLE II. (Continued) Provisional cases of selected notifiable diseases, United States, weeks ending July 7, 2012, and July 9, 2011 (27th week)*
Reporting area
Streptococcus pneumoniae,† invasive disease
Syphilis, primary and secondary
All ages
Age <5
Current week
Previous 52 weeks
Cum 2012
Cum 2011
Current week
Previous 52 weeks
Cum 2012
Cum 2011
Current week
Previous 52 weeks
Cum 2012
Cum 2011
Med
Max
Med
Max
Med
Max
United States
62
269
803
7,510
10,360
4
21
58
504
699
42
268
323
6,359
6,983
New England
2
11
27
339
521
—
1
4
23
31
1
8
23
220
208
Connecticut
—
6
13
162
232
—
0
2
8
6
—
0
13
19
30
Maine
1
2
7
66
80
—
0
1
1
3
—
0
2
7
10
Massachusetts
—
0
4
18
21
—
0
3
9
10
1
5
13
147
129
New Hampshire
—
1
6
44
71
—
0
1
4
5
—
0
2
15
12
Rhode Island
—
0
5
19
71
—
0
1
1
2
—
1
6
29
22
Vermont
1
1
4
30
46
—
0
1
—
5
—
0
2
3
5
Mid. Atlantic
13
43
157
1,203
1,610
—
2
11
53
82
5
32
47
692
879
New Jersey
—
9
26
247
439
—
0
2
11
30
—
4
8
77
127
New York (Upstate)
13
18
108
558
715
—
1
10
29
30
1
4
12
107
89
New York City
—
13
23
398
456
—
0
3
13
22
3
16
22
315
480
Pennsylvania
N
0
0
N
N
N
0
0
N
N
1
7
17
193
183
E.N. Central
3
61
101
1,627
2,040
1
3
10
102
116
2
29
62
635
964
Illinois
N
0
0
N
N
—
0
0
—
—
2
13
54
261
429
Indiana
—
12
33
326
499
—
1
2
13
23
—
3
10
96
98
Michigan
3
13
25
309
439
1
0
3
22
24
—
4
13
100
164
Ohio
—
23
46
723
796
—
1
6
48
55
—
7
15
147
241
Wisconsin
—
9
26
269
306
—
0
2
19
14
—
1
5
31
32
W.N. Central
2
12
58
280
395
1
1
3
20
29
—
3
13
51
166
Iowa
N
0
0
N
N
N
0
0
N
N
—
0
3
21
12
Kansas
N
0
0
N
N
N
0
0
N
N
—
0
4
—
10
Minnesota
—
8
26
192
304
—
1
3
13
25
—
2
8
25
71
Missouri
N
0
0
N
N
—
0
0
—
—
—
0
8
—
67
Nebraska
2
2
8
88
73
1
0
2
7
4
—
0
2
3
6
North Dakota
—
0
38
—
18
—
0
2
—
—
—
0
1
2
—
South Dakota
N
0
0
N
N
—
0
0
—
—
—
0
0
—
—
S. Atlantic
14
59
193
1,686
2,488
—
4
21
121
176
15
67
98
1,629
1,720
Delaware
—
1
5
21
33
—
0
0
—
—
—
0
6
23
12
District of Columbia
—
1
5
30
28
—
0
1
1
4
—
3
9
96
102
Florida
7
19
48
576
890
—
2
8
46
80
—
26
36
636
610
Georgia
—
17
48
460
744
—
1
6
36
43
6
11
59
292
318
Maryland
4
8
22
206
361
—
1
5
18
24
—
8
15
181
229
North Carolina
N
0
0
N
N
N
0
0
N
N
3
7
21
177
219
South Carolina
3
6
16
226
307
—
0
3
12
20
—
4
11
112
110
Virginia
N
0
0
N
N
—
0
0
—
—
6
3
13
110
118
West Virginia
—
3
83
167
125
—
0
8
8
5
—
0
2
2
2
E.S. Central
3
19
50
546
738
—
2
5
32
50
6
15
32
362
398
Alabama
N
0
0
N
N
N
0
0
N
N
—
3
8
75
123
Kentucky
2
4
9
122
145
—
0
1
4
13
4
2
9
63
60
Mississippi
N
0
0
N
N
—
0
0
—
—
1
3
21
98
70
Tennessee
1
14
47
424
593
—
1
4
28
37
1
5
14
126
145
W.S. Central
19
30
188
919
1,219
2
3
12
78
111
3
41
55
1,067
906
Arkansas
2
4
14
103
143
—
0
3
10
11
1
3
15
98
100
Louisiana
—
3
18
107
143
—
0
2
7
13
2
7
16
149
208
Oklahoma
N
0
0
N
N
—
0
0
—
—
—
1
7
23
29
Texas
17
23
156
709
933
2
2
11
61
87
—
27
43
797
569
Mountain
5
26
48
845
1,251
—
2
6
63
98
4
10
21
240
320
Arizona
3
11
27
424
542
—
1
3
31
41
1
4
11
88
129
Colorado
—
8
17
221
337
—
0
3
14
24
—
2
6
54
65
Idaho
N
0
0
N
N
—
0
0
—
—
—
0
3
8
3
Montana
N
0
0
N
N
N
0
0
N
N
—
0
1
—
5
Nevada
N
0
0
N
N
N
0
0
N
N
3
2
7
49
75
New Mexico
—
5
14
153
221
—
0
4
12
15
—
1
5
34
36
Utah
—
1
9
30
132
—
0
2
5
18
—
0
2
7
7
Wyoming
2
0
3
17
19
—
0
1
1
—
—
0
0
—
—
Pacific
1
2
8
65
98
—
0
2
12
6
6
58
76
1,463
1,422
Alaska
1
1
8
63
97
—
0
2
12
6
—
0
2
5
1
California
N
0
0
N
N
N
0
0
N
N
5
49
68
1,244
1,185
Hawaii
—
0
1
2
1
—
0
1
—
—
—
0
3
5
8
Oregon
N
0
0
N
N
N
0
0
N
N
—
2
12
89
44
Washington
N
0
0
N
N
N
0
0
N
N
1
5
12
120
184
Territories
American Samoa
N
0
0
N
N
—
0
0
—
—
—
0
0
—
—
C.N.M.I.
—
—
—
—
—
—
—
—
—
—
—
—
—
—
—
Guam
—
0
0
—
—
—
0
0
—
—
—
0
0
—
—
Puerto Rico
—
0
0
—
—
—
0
0
—
—
—
5
15
130
127
U.S. Virgin Islands
—
0
0
—
—
—
0
0
—
—
—
0
0
—
—
C.N.M.I.: Commonwealth of Northern Mariana Islands.
U: Unavailable. —: No reported cases. N: Not reportable. NN: Not Nationally Notifiable. Cum: Cumulative year-to-date counts. Med: Median. Max: Maximum.
† Includes drug resistant and susceptible cases of invasive Streptococcus pneumoniae disease among children <5 years and among all ages. Case definition: Isolation of S. pneumoniae from a normally sterile body site (e.g., blood or cerebrospinal fluid).
TABLE II. (Continued) Provisional cases of selected notifiable diseases, United States, weeks ending July 7, 2012, and July 9, 2011 (27th week)*
Reporting area
Varicella (chickenpox)
West Nile virus disease†
Neuroinvasive
Nonneuroinvasive§
Current week
Previous 52 weeks
Cum 2012
Cum 2011
Current week
Previous 52 weeks
Cum 2012
Cum 2011
Current week
Previous 52 weeks
Cum 2012
Cum 2011
Med
Max
Med
Max
Med
Max
United States
68
287
401
6,938
7,958
—
0
63
1
20
—
0
33
—
14
New England
2
25
50
638
732
—
0
3
—
—
—
0
1
—
—
Connecticut
1
6
12
143
150
—
0
2
—
—
—
0
1
—
—
Maine
1
4
22
143
128
—
0
0
—
—
—
0
0
—
—
Massachusetts
—
9
19
207
275
—
0
2
—
—
—
0
1
—
—
New Hampshire
—
0
10
—
85
—
0
0
—
—
—
0
0
—
—
Rhode Island
—
1
9
53
28
—
0
1
—
—
—
0
0
—
—
Vermont
—
2
13
92
66
—
0
1
—
—
—
0
0
—
—
Mid. Atlantic
4
33
89
1,128
915
—
0
11
—
—
—
0
6
—
1
New Jersey
—
10
55
669
289
—
0
1
—
—
—
0
2
—
1
New York (Upstate)
N
0
0
N
N
—
0
5
—
—
—
0
4
—
—
New York City
—
0
0
—
—
—
0
4
—
—
—
0
1
—
—
Pennsylvania
4
19
35
459
626
—
0
2
—
—
—
0
1
—
—
E.N. Central
3
71
128
1,674
1,927
—
0
13
—
—
—
0
7
—
—
Illinois
—
18
38
477
441
—
0
6
—
—
—
0
5
—
—
Indiana
1
7
21
221
103
—
0
2
—
—
—
0
1
—
—
Michigan
2
20
45
489
567
—
0
7
—
—
—
0
2
—
—
Ohio
—
19
47
486
563
—
0
3
—
—
—
0
3
—
—
Wisconsin
—
1
12
1
253
—
0
1
—
—
—
0
1
—
—
W.N. Central
—
12
35
220
363
—
0
9
—
1
—
0
7
—
1
Iowa
N
0
0
N
N
—
0
2
—
—
—
0
2
—
—
Kansas
—
8
21
85
176
—
0
1
—
—
—
0
0
—
—
Minnesota
—
0
1
—
—
—
0
1
—
—
—
0
1
—
—
Missouri
—
5
18
112
122
—
0
2
—
1
—
0
2
—
—
Nebraska
—
0
3
10
14
—
0
4
—
—
—
0
3
—
—
North Dakota
—
0
29
—
24
—
0
1
—
—
—
0
1
—
1
South Dakota
—
1
6
13
27
—
0
0
—
—
—
0
1
—
—
S. Atlantic
13
31
56
754
1,098
—
0
12
—
4
—
0
6
—
1
Delaware
—
0
2
3
4
—
0
1
—
—
—
0
0
—
—
District of Columbia
—
0
4
9
12
—
0
3
—
—
—
0
3
—
—
Florida
9
16
50
556
505
—
0
4
—
3
—
0
2
—
—
Georgia
N
1
4
N
N
—
0
4
—
—
—
0
1
—
1
Maryland
N
0
0
N
N
—
0
5
—
—
—
0
3
—
—
North Carolina
N
0
0
N
N
—
0
1
—
—
—
0
0
—
—
South Carolina
1
0
2
5
12
—
0
0
—
—
—
0
0
—
—
Virginia
3
8
24
134
287
—
0
2
—
1
—
0
1
—
—
West Virginia
—
2
14
29
274
—
0
1
—
—
—
0
0
—
—
E.S. Central
—
5
14
117
172
—
0
11
—
1
—
0
5
—
2
Alabama
—
4
14
111
163
—
0
2
—
—
—
0
0
—
—
Kentucky
N
0
0
N
N
—
0
2
—
—
—
0
1
—
—
Mississippi
—
0
3
6
9
—
0
5
—
1
—
0
4
—
2
Tennessee
N
0
0
N
N
—
0
3
—
—
—
0
1
—
—
W.S. Central
39
52
213
1,518
1,647
—
0
4
1
2
—
0
3
—
1
Arkansas
—
4
28
97
183
—
0
1
—
—
—
0
0
—
—
Louisiana
—
1
6
29
49
—
0
1
—
—
—
0
2
—
—
Oklahoma
N
0
0
N
N
—
0
1
—
—
—
0
0
—
—
Texas
39
47
204
1,392
1,415
—
0
3
1
2
—
0
3
—
1
Mountain
6
29
61
812
1,022
—
0
11
—
11
—
0
5
—
5
Arizona
—
10
26
262
408
—
0
7
—
11
—
0
4
—
2
Colorado
5
8
32
254
224
—
0
2
—
—
—
0
2
—
1
Idaho
N
0
0
N
N
—
0
1
—
—
—
0
1
—
1
Montana
1
2
7
62
116
—
0
1
—
—
—
0
0
—
—
Nevada
N
0
0
N
N
—
0
4
—
—
—
0
2
—
—
New Mexico
—
2
8
59
33
—
0
1
—
—
—
0
0
—
—
Utah
—
5
20
163
234
—
0
1
—
—
—
0
1
—
—
Wyoming
—
0
2
12
7
—
0
1
—
—
—
0
1
—
1
Pacific
1
3
9
77
82
—
0
18
—
1
—
0
8
—
3
Alaska
1
1
4
41
29
—
0
0
—
—
—
0
0
—
—
California
—
0
4
11
25
—
0
18
—
1
—
0
8
—
3
Hawaii
—
1
4
25
28
—
0
0
—
—
—
0
0
—
—
Oregon
N
0
0
N
N
—
0
0
—
—
—
0
0
—
—
Washington
N
0
0
N
N
—
0
0
—
—
—
0
0
—
—
Territories
American Samoa
N
0
0
N
N
—
0
0
—
—
—
0
0
—
—
C.N.M.I.
—
—
—
—
—
—
—
—
—
—
—
—
—
—
—
Guam
—
2
5
—
37
—
0
0
—
—
—
0
0
—
—
Puerto Rico
—
5
14
60
243
—
0
0
—
—
—
0
0
—
—
U.S. Virgin Islands
—
0
1
—
—
—
0
0
—
—
—
0
0
—
—
C.N.M.I.: Commonwealth of Northern Mariana Islands.
U: Unavailable. —: No reported cases. N: Not reportable. NN: Not Nationally Notifiable. Cum: Cumulative year-to-date counts. Med: Median. Max: Maximum.
† Updated weekly from reports to the Division of Vector-Borne Infectious Diseases, National Center for Zoonotic, Vector-Borne, and Enteric Diseases (ArboNET Surveillance). Data for California serogroup, eastern equine, Powassan, St. Louis, and western equine diseases are available in Table I.
§ Not reportable in all states. Data from states where the condition is not reportable are excluded from this table, except starting in 2007 for the domestic arboviral diseases and influenza-associated pediatric mortality, and in 2003 for SARS-CoV. Reporting exceptions are available at http://www.cdc.gov/osels/ph_surveillance/nndss/phs/infdis.htm.
TABLE III. Deaths in 122 U.S. cities,* week ending July 7, 2012 (27th week)
Reporting area
All causes, by age (years)
P&I† Total
Reporting area (Continued)
All causes, by age (years)
P&I† Total
All Ages
=65
45–64
25–44
1–24
<1
All Ages
=65
45–64
25–44
1–24
<1
New England
483
334
99
32
4
14
34
S. Atlantic
707
431
206
37
16
17
45
Boston, MA
119
72
24
11
2
10
6
Atlanta, GA
122
78
33
4
6
1
6
Bridgeport, CT
23
17
5
1
—
—
3
Baltimore, MD
144
74
54
10
2
4
17
Cambridge, MA
11
10
1
—
—
—
2
Charlotte, NC
100
57
30
7
2
4
1
Fall River, MA
39
28
8
2
—
1
2
Jacksonville, FL
1
1
—
—
—
—
—
Hartford, CT
42
26
11
4
—
1
5
Miami, FL
80
51
20
4
2
3
3
Lowell, MA
21
19
2
—
—
—
3
Norfolk, VA
35
21
11
1
1
1
—
Lynn, MA
5
4
1
—
—
—
—
Richmond, VA
32
23
8
1
—
—
3
New Bedford, MA
21
16
3
2
—
—
—
Savannah, GA
46
35
10
1
—
—
5
New Haven, CT
29
14
10
3
—
2
4
St. Petersburg, FL
39
26
10
2
1
—
3
Providence, RI
67
47
14
6
—
—
1
Tampa, FL
18
12
5
—
—
1
—
Somerville, MA
U
U
U
U
U
U
U
Washington, D.C.
74
43
19
7
2
3
5
Springfield, MA
30
21
6
1
2
—
—
Wilmington, DE
16
10
6
—
—
—
2
Waterbury, CT
24
20
3
1
—
—
1
E.S. Central
703
462
174
39
16
12
55
Worcester, MA
52
40
11
1
—
—
7
Birmingham, AL
138
87
36
12
3
—
12
Mid. Atlantic
1,723
1,192
392
82
31
26
86
Chattanooga, TN
63
42
19
2
—
—
1
Albany, NY
41
30
8
2
—
1
—
Knoxville, TN
100
70
19
6
1
4
11
Allentown, PA
24
17
6
—
1
—
1
Lexington, KY
58
36
17
3
1
1
3
Buffalo, NY
102
71
23
2
2
4
14
Memphis, TN
123
81
27
7
8
—
11
Camden, NJ
23
12
7
2
1
1
1
Mobile, AL
58
41
12
1
1
3
7
Elizabeth, NJ
26
18
6
2
—
—
—
Montgomery, AL
23
18
5
—
—
—
3
Erie, PA
51
40
10
1
—
—
1
Nashville, TN
140
87
39
8
2
4
7
Jersey City, NJ
22
17
2
2
1
—
1
W.S. Central
797
503
187
58
29
20
42
New York City, NY
980
690
221
42
14
13
38
Austin, TX
66
39
18
4
3
2
4
Newark, NJ
30
14
9
7
—
—
1
Baton Rouge, LA
26
11
8
4
—
3
—
Paterson, NJ
20
13
7
—
—
—
2
Corpus Christi, TX
57
34
14
8
1
—
5
Philadelphia, PA
108
59
33
10
4
2
8
Dallas, TX
155
82
47
12
9
5
6
Pittsburgh, PA§
35
21
6
1
5
2
3
El Paso, TX
60
45
10
3
1
1
—
Reading, PA
24
22
2
—
—
—
2
Fort Worth, TX
U
U
U
U
U
U
U
Rochester, NY
88
56
21
6
3
2
4
Houston, TX
103
67
14
10
8
4
5
Schenectady, NY
17
14
2
1
—
—
1
Little Rock, AR
58
35
17
4
1
1
4
Scranton, PA
38
30
7
1
—
—
5
New Orleans, LA
U
U
U
U
U
U
U
Syracuse, NY
37
28
8
1
—
—
2
San Antonio, TX
187
123
45
12
4
3
12
Trenton, NJ
17
8
6
2
—
1
—
Shreveport, LA
18
12
3
—
2
1
3
Utica, NY
21
16
5
—
—
—
1
Tulsa, OK
67
55
11
1
—
—
3
Yonkers, NY
19
16
3
—
—
—
1
Mountain
984
651
253
58
13
9
43
E.N. Central
1,580
1,059
375
82
33
31
87
Albuquerque, NM
103
66
31
3
1
2
5
Akron, OH
48
29
13
4
1
1
2
Boise, ID
47
34
10
3
—
—
2
Canton, OH
19
16
3
—
—
—
—
Colorado Springs, CO
87
62
21
3
1
—
1
Chicago, IL
212
141
50
14
6
1
9
Denver, CO
88
55
24
7
1
1
1
Cincinnati, OH
53
35
11
2
1
4
2
Las Vegas, NV
244
162
63
15
2
2
12
Cleveland, OH
206
155
40
7
1
3
14
Ogden, UT
25
21
3
1
—
—
2
Columbus, OH
170
123
31
8
4
4
10
Phoenix, AZ
111
67
29
10
3
2
9
Dayton, OH
101
61
30
6
1
3
5
Pueblo, CO
24
19
5
—
—
—
—
Detroit, MI
98
51
34
7
5
1
8
Salt Lake City, UT
104
63
24
10
5
2
6
Evansville, IN
41
30
7
3
—
1
1
Tucson, AZ
151
102
43
6
—
—
5
Fort Wayne, IN
55
39
14
1
1
—
2
Pacific
1,438
973
330
80
25
29
123
Gary, IN
8
4
4
—
—
—
—
Berkeley, CA
10
6
3
1
—
—
1
Grand Rapids, MI
43
27
9
3
2
2
3
Fresno, CA
123
87
22
7
4
3
11
Indianapolis, IN
190
111
57
11
5
6
11
Glendale, CA
20
14
4
—
—
2
2
Lansing, MI
36
28
4
1
2
1
2
Honolulu, HI
42
34
7
—
—
1
3
Milwaukee, WI
49
31
16
2
—
—
5
Long Beach, CA
42
30
11
—
—
1
4
Peoria, IL
38
28
8
2
—
—
5
Los Angeles, CA
203
125
53
20
3
2
18
Rockford, IL
57
41
9
3
2
2
3
Pasadena, CA
16
11
3
1
—
1
1
South Bend, IN
46
31
10
4
1
—
—
Portland, OR
88
66
14
4
3
1
6
Toledo, OH
74
49
20
2
1
2
3
Sacramento, CA
193
119
54
11
4
5
22
Youngstown, OH
36
29
5
2
—
—
2
San Diego, CA
142
88
38
11
1
3
14
W.N. Central
417
278
94
24
15
6
24
San Francisco, CA
97
71
19
5
1
1
9
Des Moines, IA
—
—
—
—
—
—
—
San Jose, CA
181
130
32
7
5
7
17
Duluth, MN
27
20
5
2
—
—
2
Santa Cruz, CA
27
19
7
1
—
—
2
Kansas City, KS
28
17
9
2
—
—
1
Seattle, WA
95
55
31
8
—
1
6
Kansas City, MO
39
22
12
2
1
2
2
Spokane, WA
55
41
11
1
1
1
1
Lincoln, NE
42
35
6
—
1
—
4
Tacoma, WA
104
77
21
3
3
—
6
Minneapolis, MN
47
31
11
4
1
—
5
Total¶
8,832
5,883
2,110
492
182
164
539
Omaha, NE
79
51
18
4
4
2
6
St. Louis, MO
58
36
15
5
1
1
1
St. Paul, MN
46
33
4
3
5
1
2
Wichita, KS
51
33
14
2
2
—
1
U: Unavailable. —: No reported cases.
* Mortality data in this table are voluntarily reported from 122 cities in the United States, most of which have populations of >100,000. A death is reported by the place of its occurrence and by the week that the death certificate was filed. Fetal deaths are not included.
† Pneumonia and influenza.
§ Because of changes in reporting methods in this Pennsylvania city, these numbers are partial counts for the current week. Complete counts will be available in 4 to 6 weeks.
¶ Total includes unknown ages.
TABLE IV. Provisional cases of selected notifiable disease, United States, 2nd quarter ending June 30, 2012
Reporting area
Tuberculosis*
Current quarter
Previous 4 quarters
Cum 2012
Cum 2011
Min
Max
United States
1,699
1,699
3,124
1,729
4,776
New England
49
49
88
71
166
Connecticut
7
7
20
18
48
Maine
7
2
7
6
5
Massachusetts
31
31
53
41
93
New Hampshire
—
0
5
—
4
Rhode Island
4
4
8
6
13
Vermont
—
0
5
—
3
Mid. Atlantic
349
325
415
325
701
New Jersey
74
50
99
50
138
New York (Upstate)
50
40
84
40
92
New York City
164
164
185
185
346
Pennsylvania
61
50
62
50
125
E.N. Central
140
127
235
127
386
Illinois
75
68
97
68
175
Indiana
25
19
28
19
44
Michigan
20
20
63
24
59
Ohio
—
0
50
—
64
Wisconsin
20
10
20
16
44
W.N. Central
29
29
98
44
125
Iowa
—
0
19
2
15
Kansas
—
0
9
1
19
Minnesota
25
25
51
27
57
Missouri
—
0
15
4
12
Nebraska
1
1
7
4
11
North Dakota
—
0
2
—
5
South Dakota
3
3
6
6
6
S. Atlantic
391
337
585
337
955
Delaware
5
5
6
5
10
District of Columbia
6
6
17
9
23
Florida
125
124
207
124
386
Georgia
54
54
84
82
180
Maryland
66
44
66
44
106
North Carolina
51
18
69
18
109
South Carolina
31
20
60
20
58
Virginia
53
31
76
31
78
West Virginia
—
0
5
4
5
E.S. Central
119
95
132
95
231
Alabama
45
34
45
34
76
Kentucky
—
0
33
2
33
Mississippi
20
20
26
21
43
Tennessee
54
32
54
38
79
W.S. Central
51
51
521
188
737
Arkansas
14
14
31
16
37
Louisiana
20
6
81
6
38
Oklahoma
16
16
23
16
48
Texas
1
1
386
150
614
Mountain
114
48
189
48
228
Arizona
73
6
112
6
94
Colorado
15
11
22
11
28
Idaho
3
2
6
2
4
Montana
—
0
4
—
2
Nevada
2
2
24
13
52
New Mexico
10
7
17
7
22
Utah
11
5
11
9
23
Wyoming
—
0
1
—
3
Pacific
457
457
861
494
1,247
Alaska
4
4
24
5
30
California
370
370
730
406
1,011
Hawaii
30
26
38
28
59
Oregon
6
6
17
14
42
Washington
47
41
52
41
105
Territories
American Samoa
—
0
2
—
1
C.N.M.I.
—
0
9
—
17
Guam
—
0
19
—
49
Puerto Rico
—
0
12
—
23
U.S. Virgin Islands
—
0
0
—
—
C.N.M.I.: Commonwealth of Northern Mariana Islands.
U: Unavailable. —: No reported cases. N: Not reportable. NN: Not Nationally Notifiable. Cum: Cumulative year-to-date counts. Med: Median. Max: Maximum.