Persons using assistive technology might not be able to fully access information in this file. For assistance, please send e-mail to: mmwrq@cdc.gov. Type 508 Accommodation and the title of the report in the subject line of e-mail.
Notifiable Diseases and Mortality Tables
Table I Summary of provisional cases of selected notifiable diseases, United States, cumulative, week ending June 16, 2012 (24th Week)
Figure I Selected notifiable disease reports, United States, comparison of provisional 4-week totals ending June 16, 2012, with historical data
Table II Provisional cases of selected notifiable diseases, United States, weeks ending June 16, 2012 and June 18, 2011 (24th Week)
Table III Deaths in 122 U.S. cities, week ending June 16, 2012 (24th Week)
TABLE I. Provisional cases of infrequently reported notifiable diseases (<1,000 cases reported during the preceding year) — United States, week ending June 16, 2012 (24th week)*
TABLE I. (Continued) Provisional cases of infrequently reported notifiable diseases (<1,000 cases reported during the preceding year) — United States, week ending June 16, 2012 (24th week)*
—: No reported cases. N: Not reportable. NN: Not Nationally Notifiable. Cum: Cumulative year-to-date counts.
§ Not reportable in all states. Data from states where the condition is not reportable are excluded from this table except starting in 2007 for the arboviral diseases, STD data, TB data, and influenza-associated pediatric mortality, and in 2003 for SARS-CoV. Reporting exceptions are available at http://www.cdc.gov/osels/ph_surveillance/nndss/phs/infdis.htm.
¶ Includes both neuroinvasive and nonneuroinvasive. Updated weekly from reports to the Division of Vector-Borne Infectious Diseases, National Center for Zoonotic, Vector-Borne, and Enteric Diseases (ArboNET Surveillance). Data for West Nile virus are available in Table II.
** Data for H. influenzae (all ages, all serotypes) are available in Table II.
†† Updated weekly from reports to the Influenza Division, National Center for Immunization and Respiratory Diseases. Since October 2, 2011, 29 influenza-associated pediatric deaths occurring during the 2011-12 influenza season have been reported.
§§ No measles cases were reported for the current week.
¶¶ Data for meningococcal disease (all serogroups) are available in Table II.
*** CDC discontinued reporting of individual confirmed and probable cases of 2009 pandemic influenza A (H1N1) virus infections on July 24, 2009. During 2009, four cases of human infection with novel influenza A viruses, different from the 2009 pandemic influenza A (H1N1) strain, were reported to CDC. The four cases of novel influenza A virus infection reported to CDC during 2010, the eight cases reported during 2011, and the one case reported in 2012 are different from the 2009 pandemic influenza A (H1N1) virus. Total case counts are provided by the Influenza Division, National Center for Immunization and Respiratory Diseases (NCIRD).
††† No rubella cases were reported for the current week.
§§§ Updated weekly from reports to the Division of STD Prevention, National Center for HIV/AIDS, Viral Hepatitis, STD, and TB Prevention.
¶¶¶ There were no cases of viral hemorrhagic fever reported during the current week. See Table II for dengue hemorrhagic fever.
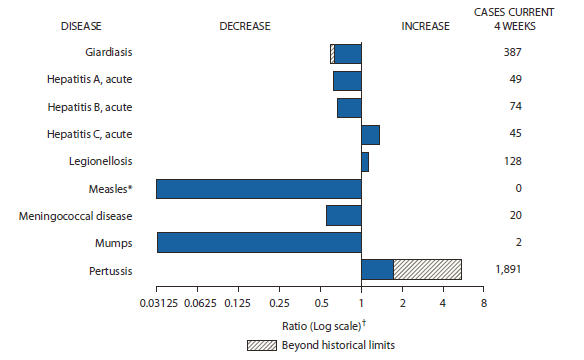
FIGURE I. Selected notifiable disease reports, United States, comparison of provisional 4-week totals June 16, 2012, with historical data
* No measles cases were reported for the current 4-week period yielding a ratio for week 24 of zero (0).
† Ratio of current 4-week total to mean of 15 4-week totals (from previous, comparable, and subsequent 4-week periods for the past 5 years). The point where the hatched area begins is based on the mean and two standard deviations of these 4-week totals.
Alternate Text: The figure above shows selected notifiable disease reports for the United States, with comparison of provisional 4-week totals through June 16, 2012, with historical data. Reports of acute hepatitis C, legionellosis, and pertussis all increased, with pertussis increasing beyond historical limits. Reports of giardiasis, acute hepatitis A, acute hepatitis B, measles, meningococcal disease, and mumps all decreased, with giardiasis decreasing beyond historical limits.
TABLE II. Provisional cases of selected notifiable diseases, United States, weeks ending June 16, 2012, and June 18, 2011 (24th week)*
Reporting area
Chlamydia trachomatis infection
Coccidioidomycosis
Cryptosporidiosis
Current week
Previous 52 weeks
Cum 2012
Cum 2011
Current week
Previous 52 weeks
Cum 2012
Cum 2011
Current week
Previous 52 weeks
Cum 2012
Cum 2011
Med
Max
Med
Max
Med
Max
United States
7,009
26,756
30,645
550,764
639,169
2
413
591
7,458
10,057
55
122
415
2,357
2,942
New England
677
904
1,807
19,627
20,085
—
0
1
1
1
2
6
22
103
166
Connecticut
—
219
1,268
3,828
4,374
N
0
0
N
N
—
1
8
16
26
Maine
82
59
99
1,277
1,416
N
0
0
N
N
—
1
3
19
23
Massachusetts
511
450
680
10,406
10,361
N
0
0
N
N
—
2
8
39
74
New Hampshire
—
62
86
1,310
1,314
—
0
0
—
1
—
1
4
9
23
Rhode Island
84
80
186
2,151
1,947
—
0
1
1
—
—
0
10
3
1
Vermont
—
27
71
655
673
N
0
0
N
N
2
1
5
17
19
Mid. Atlantic
1,570
3,530
4,469
78,616
81,539
—
0
1
3
3
7
14
44
244
335
New Jersey
104
533
634
12,220
11,978
N
0
0
N
N
—
1
4
11
26
New York (Upstate)
559
727
2,215
16,327
16,046
N
0
0
N
N
—
4
16
42
58
New York City
63
1,223
1,491
24,396
29,958
N
0
0
N
N
—
2
6
40
35
Pennsylvania
844
1,095
1,305
25,673
23,557
N
0
1
N
N
7
7
27
151
216
E.N. Central
378
4,202
4,785
81,933
100,591
—
1
5
24
21
13
33
150
572
647
Illinois
—
1,176
1,494
18,302
29,518
N
0
0
N
N
—
3
25
41
64
Indiana
—
545
699
11,337
12,841
N
0
0
N
N
—
4
11
59
123
Michigan
—
932
1,210
19,685
23,103
—
0
3
13
14
—
7
14
107
117
Ohio
249
1,034
1,180
22,401
23,948
—
0
2
11
7
11
13
95
229
184
Wisconsin
129
466
608
10,208
11,181
N
0
0
N
N
2
8
73
136
159
W.N. Central
84
1,253
1,825
14,017
35,542
—
2
7
54
74
4
15
92
260
492
Iowa
—
199
439
2,083
5,002
N
0
0
N
N
—
4
18
94
155
Kansas
—
205
277
128
4,643
N
0
0
N
N
—
0
11
4
—
Minnesota
1
325
408
6,304
7,513
—
2
6
49
63
—
2
17
—
104
Missouri
—
452
683
—
12,755
—
0
2
4
10
—
5
60
84
78
Nebraska
74
127
218
2,816
2,923
—
0
2
1
1
4
2
11
44
79
North Dakota
—
47
78
1,053
1,099
N
0
0
N
N
—
0
12
—
7
South Dakota
9
66
93
1,633
1,607
N
0
0
N
N
—
2
10
34
69
S. Atlantic
1,750
5,457
7,543
125,714
131,797
—
0
1
2
4
14
22
55
477
494
Delaware
—
82
182
1,683
2,064
—
0
0
—
—
—
0
4
7
3
District of Columbia
106
129
224
3,107
3,040
—
0
0
—
—
—
0
0
—
—
Florida
847
1,502
1,731
35,728
35,619
N
0
0
N
N
9
8
17
201
178
Georgia
598
1,055
1,568
23,216
24,270
N
0
0
N
N
1
5
13
87
136
Maryland
199
485
824
9,472
12,108
—
0
1
2
4
3
2
7
48
27
North Carolina
—
991
1,686
22,248
23,243
N
0
0
N
N
—
0
46
43
35
South Carolina
—
509
1,278
12,586
13,478
N
0
0
N
N
—
2
6
30
60
Virginia
—
673
1,780
15,617
16,029
N
0
0
N
N
1
3
8
60
42
West Virginia
—
83
146
2,057
1,946
N
0
0
N
N
—
0
4
1
13
E.S. Central
922
2,016
2,820
45,928
44,610
—
0
0
—
—
2
7
26
115
135
Alabama
—
596
1,283
12,697
13,085
N
0
0
N
N
—
2
7
46
60
Kentucky
255
314
524
7,315
7,378
N
0
0
N
N
—
1
18
13
27
Mississippi
355
435
1,168
11,036
10,042
N
0
0
N
N
—
1
4
18
13
Tennessee
312
634
828
14,880
14,105
N
0
0
N
N
2
2
6
38
35
W.S. Central
291
3,408
4,436
68,755
84,059
—
0
1
—
2
5
12
45
145
150
Arkansas
291
317
412
7,707
7,505
N
0
0
N
N
—
0
4
11
7
Louisiana
—
523
1,120
7,820
12,425
—
0
1
—
2
—
1
10
34
23
Oklahoma
—
112
1,015
881
6,023
N
0
0
N
N
—
1
6
22
31
Texas
—
2,393
3,101
52,347
58,106
N
0
0
N
N
5
6
41
78
89
Mountain
707
1,716
2,430
37,583
40,083
2
303
478
5,863
7,815
4
10
29
202
254
Arizona
311
569
869
13,312
12,817
—
298
477
5,770
7,700
—
0
4
8
16
Colorado
—
392
705
7,847
9,857
N
0
0
N
N
—
2
11
27
65
Idaho
—
86
277
1,643
1,830
N
0
0
N
N
1
2
9
48
41
Montana
53
73
100
1,861
1,528
N
0
1
N
N
—
2
6
35
24
Nevada
194
210
285
4,309
5,011
2
2
6
58
42
1
0
2
8
7
New Mexico
110
222
447
5,451
4,853
—
1
7
10
42
1
2
9
46
59
Utah
39
136
191
3,052
3,215
—
1
5
20
25
—
1
5
16
27
Wyoming
—
25
69
108
972
—
0
2
3
3
1
0
3
14
15
Pacific
630
3,952
5,070
78,591
100,863
—
104
179
1,511
2,137
4
12
23
239
269
Alaska
37
106
152
2,547
2,782
N
0
0
N
N
—
0
3
2
5
California
—
3,055
4,094
56,447
78,373
—
104
179
1,510
2,137
—
6
16
132
129
Hawaii
—
120
147
2,424
2,603
N
0
0
N
N
—
0
1
2
—
Oregon
264
266
368
6,594
6,408
N
0
1
N
N
4
3
10
78
102
Washington
329
452
764
10,579
10,697
N
0
10
N
N
—
1
8
25
33
Territories
American Samoa
—
0
0
—
—
N
0
0
N
N
N
0
0
N
N
C.N.M.I.
—
—
—
—
—
—
—
—
—
—
—
—
—
—
—
Guam
—
21
30
—
489
—
0
0
—
—
—
0
0
—
—
Puerto Rico
106
105
289
2,974
2,880
N
0
0
N
N
N
0
0
N
N
U.S. Virgin Islands
—
15
26
271
378
—
0
0
—
—
—
0
0
—
—
C.N.M.I.: Commonwealth of Northern Mariana Islands.
U: Unavailable. —: No reported cases. N: Not reportable. NN: Not Nationally Notifiable. Cum: Cumulative year-to-date counts. Med: Median. Max: Maximum.
† Data for meningococcal disease, invasive caused by serogroups A, C, Y, and W-135; serogroup B; other serogroup; and unknown serogroup are available in Table I.
TABLE II. (Continued) Provisional cases of selected notifiable diseases, United States, weeks ending June 16, 2012, and June 18, 2011 (24th week)*
Reporting area
Rabies, animal
Salmonellosis
Shiga toxin-producing E. coli (STEC)†
Current week
Previous 52 weeks
Cum 2012
Cum 2011
Current week
Previous 52 weeks
Cum 2012
Cum 2011
Current week
Previous 52 weeks
Cum 2012
Cum 2011
Med
Max
Med
Max
Med
Max
United States
25
73
132
1,345
1,896
428
881
1,946
13,681
16,023
44
107
256
1,511
1,733
New England
—
7
16
168
127
10
29
86
520
820
1
3
12
51
67
Connecticut
—
4
10
81
72
1
7
30
155
187
—
1
5
22
22
Maine
—
2
6
49
23
7
3
9
64
50
—
0
3
3
11
Massachusetts
—
0
0
—
—
—
15
44
206
386
—
1
9
16
20
New Hampshire
—
0
3
12
8
—
3
8
32
75
—
0
3
3
10
Rhode Island
—
0
6
9
9
1
1
12
37
101
1
0
2
1
1
Vermont
—
0
4
17
15
1
2
8
26
21
—
0
3
6
3
Mid. Atlantic
6
12
36
189
333
22
87
209
1,611
1,971
4
12
35
167
212
New Jersey
—
0
0
—
—
1
18
49
288
452
—
2
8
26
57
New York (Upstate)
6
7
20
145
126
2
26
67
440
427
—
3
13
52
57
New York City
—
0
3
—
7
4
20
44
399
427
—
2
6
38
31
Pennsylvania
—
6
16
44
200
15
27
114
484
665
4
3
17
51
67
E.N. Central
2
3
20
55
51
21
75
186
1,397
1,871
3
13
50
212
277
Illinois
—
0
6
22
14
—
25
80
409
652
—
3
14
35
67
Indiana
—
0
7
1
4
—
12
36
194
212
—
2
10
46
44
Michigan
—
1
6
19
15
—
16
42
296
283
—
3
13
70
42
Ohio
2
0
6
13
18
21
23
46
441
406
3
3
9
47
52
Wisconsin
N
0
0
N
N
—
6
40
57
318
—
3
22
14
72
W.N. Central
—
1
8
29
48
7
42
113
674
1,079
2
16
58
195
270
Iowa
—
0
4
—
6
—
7
19
152
192
—
2
15
25
52
Kansas
—
0
3
7
15
—
10
27
54
128
—
2
8
5
37
Minnesota
—
0
0
—
—
—
8
33
—
272
—
1
24
—
63
Missouri
—
0
4
15
8
—
16
42
322
304
—
6
31
126
70
Nebraska
—
0
3
—
12
7
4
13
103
86
2
1
7
27
33
North Dakota
—
0
4
7
7
—
0
8
—
15
—
0
4
—
4
South Dakota
—
0
0
—
—
—
2
9
43
82
—
1
4
12
11
S. Atlantic
—
17
45
437
596
223
283
708
4,237
4,048
11
11
31
224
231
Delaware
—
0
0
—
—
—
2
12
40
52
—
0
2
4
5
District of Columbia
—
0
0
—
—
—
1
7
19
26
—
0
1
4
3
Florida
—
0
34
51
120
128
103
201
1,774
1,600
6
2
11
94
47
Georgia
—
0
0
—
—
5
32
109
480
666
1
2
7
36
46
Maryland
—
5
16
137
147
22
18
45
346
335
3
1
4
25
23
North Carolina
—
0
0
—
—
36
44
251
803
632
—
1
26
28
51
South Carolina
N
0
0
N
N
18
25
71
385
368
—
0
2
8
8
Virginia
—
10
25
213
276
14
22
57
371
332
1
2
8
23
46
West Virginia
—
1
9
36
53
—
0
52
19
37
—
0
2
2
2
E.S. Central
—
2
6
33
87
33
68
191
974
1,036
2
5
18
121
89
Alabama
—
1
5
28
43
11
21
70
276
273
—
1
15
24
12
Kentucky
—
0
2
5
6
—
9
30
137
182
—
1
5
22
19
Mississippi
—
0
0
—
—
—
19
87
258
294
—
0
4
10
9
Tennessee
—
0
3
—
38
22
17
51
303
287
2
2
11
65
49
W.S. Central
17
17
40
338
586
66
148
374
1,849
2,085
4
12
92
188
150
Arkansas
—
0
15
61
39
16
13
52
194
192
2
1
6
28
11
Louisiana
—
0
0
—
—
1
23
69
345
393
—
0
3
13
7
Oklahoma
—
0
21
21
12
—
14
102
143
163
—
1
16
24
12
Texas
17
14
29
256
535
49
98
227
1,167
1,337
2
8
76
123
120
Mountain
—
1
5
32
7
12
43
97
769
994
2
9
46
152
220
Arizona
N
0
0
N
N
—
15
36
230
322
—
2
6
49
61
Colorado
—
0
0
—
—
—
11
23
192
215
—
2
9
31
55
Idaho
—
0
1
—
—
3
2
8
50
67
1
2
8
24
33
Montana
N
0
0
N
N
3
2
10
34
42
—
0
4
9
13
Nevada
—
0
3
1
—
5
3
7
69
72
—
1
7
10
15
New Mexico
—
0
4
29
4
1
5
21
87
103
—
0
3
14
17
Utah
—
0
1
2
3
—
5
12
86
144
—
1
29
8
18
Wyoming
—
0
0
—
—
—
1
9
21
29
1
0
8
7
8
Pacific
—
4
14
64
61
34
92
185
1,650
2,119
15
15
39
201
217
Alaska
—
0
1
5
11
1
1
6
27
29
—
0
0
—
—
California
—
4
13
56
45
—
63
142
1,136
1,598
—
7
21
79
155
Hawaii
—
0
0
—
—
—
6
20
103
128
—
0
2
5
4
Oregon
—
0
2
3
5
5
6
16
145
158
3
2
11
62
27
Washington
—
0
11
—
—
28
12
42
239
206
12
3
18
55
31
Territories
American Samoa
N
0
0
N
N
—
0
1
1
—
—
0
0
—
—
C.N.M.I.
—
—
—
—
—
—
—
—
—
—
—
—
—
—
—
Guam
—
0
0
—
—
—
0
4
—
10
—
0
0
—
—
Puerto Rico
—
1
5
27
23
—
3
21
22
204
—
0
0
—
—
U.S. Virgin Islands
—
0
0
—
—
—
0
6
—
—
—
0
0
—
—
C.N.M.I.: Commonwealth of Northern Mariana Islands.
U: Unavailable. —: No reported cases. N: Not reportable. NN: Not Nationally Notifiable. Cum: Cumulative year-to-date counts. Med: Median. Max: Maximum.
† Illnesses with similar clinical presentation that result from Spotted fever group rickettsia infections are reported as Spotted fever rickettsioses. Rocky Mountain spotted fever (RMSF) caused by Rickettsia rickettsii, is the most common and well-known spotted fever.
TABLE II. (Continued) Provisional cases of selected notifiable diseases, United States, weeks ending June 16, 2012, and June 18, 2011 (24th week)*
Reporting area
Streptococcus pneumoniae,† invasive disease
Syphilis, primary and secondary
All ages
Age <5
Current week
Previous 52 weeks
Cum 2012
Cum 2011
Current week
Previous 52 weeks
Cum 2012
Cum 2011
Current week
Previous 52 weeks
Cum 2012
Cum 2011
Med
Max
Med
Max
Med
Max
United States
67
264
765
7,064
9,902
4
21
56
482
666
56
267
323
5,402
6,255
New England
2
12
27
329
497
—
1
4
23
30
2
8
23
191
185
Connecticut
—
6
13
161
223
—
0
2
8
6
—
0
13
10
27
Maine
1
2
7
62
73
—
0
1
1
3
—
0
2
7
9
Massachusetts
—
0
4
18
19
—
0
3
9
10
2
5
10
128
115
New Hampshire
—
1
6
42
67
—
0
1
4
4
—
0
2
15
11
Rhode Island
—
0
5
19
70
—
0
1
1
2
—
1
6
28
19
Vermont
1
1
4
27
45
—
0
1
—
5
—
0
2
3
4
Mid. Atlantic
—
44
157
1,128
1,510
—
2
11
50
78
8
32
47
627
787
New Jersey
—
10
26
245
424
—
0
2
11
30
—
3
8
65
114
New York (Upstate)
—
19
108
515
657
—
1
10
28
27
5
4
12
92
76
New York City
—
13
23
368
429
—
0
3
11
21
2
16
22
293
430
Pennsylvania
N
0
0
N
N
N
0
0
N
N
1
7
17
177
167
E.N. Central
19
60
101
1,532
1,950
2
3
10
97
111
1
29
62
511
851
Illinois
N
0
0
N
N
—
0
0
—
—
—
11
54
179
387
Indiana
—
12
33
292
476
—
1
2
12
20
—
3
9
83
85
Michigan
—
12
25
296
422
—
0
3
21
24
—
4
13
81
141
Ohio
18
22
46
689
759
2
1
6
46
53
—
7
15
141
209
Wisconsin
1
9
26
255
293
—
0
2
18
14
1
1
6
27
29
W.N. Central
2
12
35
252
367
—
1
3
15
28
1
4
13
34
151
Iowa
N
0
0
N
N
N
0
0
N
N
—
0
3
4
11
Kansas
N
0
0
N
N
N
0
0
N
N
—
0
4
—
9
Minnesota
—
9
26
169
281
—
0
3
10
24
—
2
8
25
63
Missouri
N
0
0
N
N
—
0
0
—
—
—
0
8
—
63
Nebraska
2
2
8
83
68
—
0
2
5
4
1
0
2
3
5
North Dakota
—
0
26
—
18
—
0
1
—
—
—
0
1
2
—
South Dakota
N
0
0
N
N
—
0
0
—
—
—
0
0
—
—
S. Atlantic
21
59
193
1,610
2,395
—
4
21
118
169
23
68
98
1,446
1,540
Delaware
—
1
5
21
33
—
0
0
—
—
—
0
6
20
8
District of Columbia
—
1
5
30
28
—
0
1
1
4
3
3
9
90
97
Florida
13
20
48
547
847
—
2
8
45
76
1
27
36
566
549
Georgia
1
17
48
460
720
—
1
6
36
42
13
12
59
266
268
Maryland
3
8
22
187
345
—
1
5
17
22
6
8
15
165
208
North Carolina
N
0
0
N
N
N
0
0
N
N
—
7
21
150
207
South Carolina
4
6
16
207
297
—
0
3
11
20
—
4
11
98
98
Virginia
N
0
0
N
N
—
0
0
—
—
—
3
13
89
103
West Virginia
—
2
83
158
125
—
0
8
8
5
—
0
2
2
2
E.S. Central
4
18
50
512
715
1
2
5
32
47
14
15
32
323
346
Alabama
N
0
0
N
N
N
0
0
N
N
—
4
10
75
108
Kentucky
—
4
9
109
141
—
0
1
4
13
8
2
9
56
49
Mississippi
N
0
0
N
N
—
0
0
—
—
6
3
21
82
60
Tennessee
4
14
47
403
574
1
1
4
28
34
—
5
14
110
129
W.S. Central
14
30
188
842
1,165
1
3
12
74
104
—
39
51
870
825
Arkansas
—
3
14
94
137
—
0
3
10
10
—
3
15
94
87
Louisiana
—
3
18
85
137
—
0
2
6
13
—
7
16
115
201
Oklahoma
N
0
0
N
N
—
0
0
—
—
—
1
7
18
27
Texas
14
23
156
663
891
1
2
11
58
81
—
25
42
643
510
Mountain
3
28
48
799
1,200
—
2
7
61
94
4
10
21
202
283
Arizona
—
12
27
398
523
—
1
4
29
39
1
4
11
76
113
Colorado
—
8
17
211
322
—
0
3
14
24
—
2
6
44
56
Idaho
N
0
0
N
N
—
0
0
—
—
—
0
3
8
3
Montana
N
0
0
N
N
N
0
0
N
N
—
0
1
—
5
Nevada
N
0
0
N
N
N
0
0
N
N
3
2
7
42
68
New Mexico
2
5
15
149
210
—
0
4
12
14
—
1
4
27
31
Utah
—
2
9
26
128
—
0
2
5
17
—
0
2
5
7
Wyoming
1
0
3
15
17
—
0
1
1
—
—
0
0
—
—
Pacific
2
2
8
60
103
—
0
2
12
5
3
57
77
1,198
1,287
Alaska
2
2
8
58
102
—
0
2
12
5
—
0
2
5
—
California
N
0
0
N
N
N
0
0
N
N
—
48
68
999
1,072
Hawaii
—
0
1
2
1
—
0
1
—
—
—
0
3
4
7
Oregon
N
0
0
N
N
N
0
0
N
N
—
2
12
79
39
Washington
N
0
0
N
N
N
0
0
N
N
3
5
12
111
169
Territories
American Samoa
N
0
0
N
N
—
0
0
—
—
—
0
0
—
—
C.N.M.I.
—
—
—
—
—
—
—
—
—
—
—
—
—
—
—
Guam
—
0
0
—
—
—
0
0
—
—
—
0
0
—
—
Puerto Rico
—
0
0
—
—
—
0
0
—
—
10
5
15
122
109
U.S. Virgin Islands
—
0
0
—
—
—
0
0
—
—
—
0
0
—
—
C.N.M.I.: Commonwealth of Northern Mariana Islands.
U: Unavailable. —: No reported cases. N: Not reportable. NN: Not Nationally Notifiable. Cum: Cumulative year-to-date counts. Med: Median. Max: Maximum.
† Includes drug resistant and susceptible cases of invasive Streptococcus pneumoniae disease among children <5 years and among all ages. Case definition: Isolation of S. pneumoniae from a normally sterile body site (e.g., blood or cerebrospinal fluid).
TABLE II. (Continued) Provisional cases of selected notifiable diseases, United States, weeks ending June 16, 2012, and June 18, 2011 (24th week)*
Reporting area
Varicella (chickenpox)
West Nile virus disease†
Neuroinvasive
Nonneuroinvasive§
Current week
Previous 52 weeks
Cum 2012
Cum 2011
Current week
Previous 52 weeks
Cum 2012
Cum 2011
Current week
Previous 52 weeks
Cum 2012
Cum 2011
Med
Max
Med
Max
Med
Max
United States
75
279
400
6,453
7,509
—
0
63
1
3
—
0
33
1
3
New England
4
25
40
580
680
—
0
3
—
—
—
0
1
—
—
Connecticut
2
6
12
125
141
—
0
2
—
—
—
0
1
—
—
Maine
—
4
14
111
119
—
0
0
—
—
—
0
0
—
—
Massachusetts
—
10
19
207
249
—
0
2
—
—
—
0
1
—
—
New Hampshire
—
0
10
—
78
—
0
0
—
—
—
0
0
—
—
Rhode Island
—
1
5
45
28
—
0
1
—
—
—
0
0
—
—
Vermont
2
3
13
92
65
—
0
1
—
—
—
0
0
—
—
Mid. Atlantic
12
32
89
1,087
870
—
0
11
—
—
—
0
6
—
—
New Jersey
—
9
54
641
277
—
0
1
—
—
—
0
2
—
—
New York (Upstate)
N
0
0
N
N
—
0
5
—
—
—
0
4
—
—
New York City
—
0
0
—
—
—
0
4
—
—
—
0
1
—
—
Pennsylvania
12
19
35
446
593
—
0
2
—
—
—
0
1
—
—
E.N. Central
10
68
127
1,567
1,887
—
0
13
—
—
—
0
7
—
—
Illinois
—
16
38
408
431
—
0
6
—
—
—
0
5
—
—
Indiana
7
7
20
210
124
—
0
2
—
—
—
0
1
—
—
Michigan
—
19
45
476
545
—
0
7
—
—
—
0
2
—
—
Ohio
3
19
47
472
547
—
0
3
—
—
—
0
3
—
—
Wisconsin
—
3
12
1
240
—
0
1
—
—
—
0
1
—
—
W.N. Central
—
12
32
215
342
—
0
9
—
1
—
0
7
—
—
Iowa
N
0
0
N
N
—
0
2
—
—
—
0
2
—
—
Kansas
—
7
21
85
168
—
0
1
—
—
—
0
0
—
—
Minnesota
—
0
1
—
—
—
0
1
—
—
—
0
1
—
—
Missouri
—
5
18
107
117
—
0
2
—
1
—
0
2
—
—
Nebraska
—
0
3
10
14
—
0
4
—
—
—
0
3
—
—
North Dakota
—
0
7
—
17
—
0
1
—
—
—
0
1
—
—
South Dakota
—
1
6
13
26
—
0
0
—
—
—
0
1
—
—
S. Atlantic
13
31
54
704
1,047
—
0
12
—
—
—
0
6
—
—
Delaware
—
0
2
2
4
—
0
1
—
—
—
0
0
—
—
District of Columbia
—
0
0
—
12
—
0
3
—
—
—
0
3
—
—
Florida
12
16
50
522
489
—
0
4
—
—
—
0
2
—
—
Georgia
N
1
4
N
N
—
0
4
—
—
—
0
1
—
—
Maryland
N
0
0
N
N
—
0
5
—
—
—
0
3
—
—
North Carolina
N
0
0
N
N
—
0
1
—
—
—
0
0
—
—
South Carolina
—
0
2
3
12
—
0
0
—
—
—
0
0
—
—
Virginia
1
8
24
130
263
—
0
2
—
—
—
0
1
—
—
West Virginia
—
2
14
29
266
—
0
1
—
—
—
0
0
—
—
E.S. Central
—
5
14
113
169
—
0
11
—
—
—
0
5
—
1
Alabama
—
5
14
107
160
—
0
2
—
—
—
0
0
—
—
Kentucky
N
0
0
N
N
—
0
2
—
—
—
0
1
—
—
Mississippi
—
0
3
6
9
—
0
5
—
—
—
0
4
—
1
Tennessee
N
0
0
N
N
—
0
3
—
—
—
0
1
—
—
W.S. Central
25
53
213
1,412
1,450
—
0
4
1
1
—
0
3
—
1
Arkansas
—
4
28
85
173
—
0
1
—
—
—
0
0
—
—
Louisiana
—
1
6
29
47
—
0
1
—
—
—
0
2
—
—
Oklahoma
N
0
0
N
N
—
0
1
—
—
—
0
0
—
—
Texas
25
48
204
1,298
1,230
—
0
3
1
1
—
0
3
—
1
Mountain
11
28
62
706
986
—
0
11
—
1
—
0
5
—
1
Arizona
—
9
26
217
397
—
0
7
—
1
—
0
4
—
1
Colorado
6
7
32
231
212
—
0
2
—
—
—
0
2
—
—
Idaho
N
0
0
N
N
—
0
1
—
—
—
0
1
—
—
Montana
5
2
7
60
111
—
0
1
—
—
—
0
0
—
—
Nevada
N
0
0
N
N
—
0
4
—
—
—
0
2
—
—
New Mexico
—
1
8
52
27
—
0
1
—
—
—
0
0
—
—
Utah
—
5
20
137
232
—
0
1
—
—
—
0
1
—
—
Wyoming
—
0
2
9
7
—
0
1
—
—
—
0
1
—
—
Pacific
—
3
9
69
78
—
0
18
—
—
—
0
8
1
—
Alaska
—
1
4
37
30
—
0
0
—
—
—
0
0
—
—
California
—
0
4
11
23
—
0
18
—
—
—
0
8
1
—
Hawaii
—
1
4
21
25
—
0
0
—
—
—
0
0
—
—
Oregon
N
0
0
N
N
—
0
0
—
—
—
0
0
—
—
Washington
N
0
0
N
N
—
0
0
—
—
—
0
0
—
—
Territories
American Samoa
N
0
0
N
N
—
0
0
—
—
—
0
0
—
—
C.N.M.I.
—
—
—
—
—
—
—
—
—
—
—
—
—
—
—
Guam
—
2
5
—
33
—
0
0
—
—
—
0
0
—
—
Puerto Rico
—
6
14
60
223
—
0
0
—
—
—
0
0
—
—
U.S. Virgin Islands
—
0
1
—
—
—
0
0
—
—
—
0
0
—
—
C.N.M.I.: Commonwealth of Northern Mariana Islands.
U: Unavailable. —: No reported cases. N: Not reportable. NN: Not Nationally Notifiable. Cum: Cumulative year-to-date counts. Med: Median. Max: Maximum.
† Updated weekly from reports to the Division of Vector-Borne Infectious Diseases, National Center for Zoonotic, Vector-Borne, and Enteric Diseases (ArboNET Surveillance). Data for California serogroup, eastern equine, Powassan, St. Louis, and western equine diseases are available in Table I.
§ Not reportable in all states. Data from states where the condition is not reportable are excluded from this table, except starting in 2007 for the domestic arboviral diseases and influenza-associated pediatric mortality, and in 2003 for SARS-CoV. Reporting exceptions are available at http://www.cdc.gov/osels/ph_surveillance/nndss/phs/infdis.htm.
TABLE III. Deaths in 122 U.S. cities,* week ending June 16, 2012 (24th week)
Reporting area
All causes, by age (years)
P&I† Total
Reporting area (Continued)
All causes, by age (years)
P&I† Total
All Ages
=65
45–64
25–44
1–24
<1
All Ages
=65
45–64
25–44
1–24
<1
New England
543
352
136
29
11
15
42
S. Atlantic
842
503
241
69
16
13
54
Boston, MA
129
81
36
6
2
4
8
Atlanta, GA
150
93
40
13
2
2
9
Bridgeport, CT
42
28
11
2
—
1
4
Baltimore, MD
146
78
52
13
2
1
15
Cambridge, MA
21
19
2
—
—
—
3
Charlotte, NC
120
74
29
12
4
1
5
Fall River, MA
29
25
3
1
—
—
2
Jacksonville, FL
1
—
1
—
—
—
—
Hartford, CT
59
33
19
4
2
1
5
Miami, FL
44
28
8
6
1
1
3
Lowell, MA
30
19
8
2
1
—
1
Norfolk, VA
44
27
9
6
—
2
—
Lynn, MA
7
3
4
—
—
—
1
Richmond, VA
60
27
25
4
3
1
3
New Bedford, MA
19
13
5
1
—
—
4
Savannah, GA
79
56
19
3
—
1
6
New Haven, CT
35
22
11
1
1
—
3
St. Petersburg, FL
46
33
9
3
1
—
3
Providence, RI
60
36
16
5
—
3
1
Tampa, FL
30
19
7
3
—
1
2
Somerville, MA
2
2
—
—
—
—
—
Washington, D.C.
115
64
40
5
3
3
8
Springfield, MA
35
24
4
2
2
3
2
Wilmington, DE
7
4
2
1
—
—
—
Waterbury, CT
28
18
7
2
1
—
3
E.S. Central
880
586
200
59
21
13
73
Worcester, MA
47
29
10
3
2
3
5
Birmingham, AL
142
88
34
13
4
3
11
Mid. Atlantic
1,699
1,177
373
90
33
26
72
Chattanooga, TN
96
68
20
3
1
4
2
Albany, NY
40
31
9
—
—
—
3
Knoxville, TN
109
79
18
9
2
1
13
Allentown, PA
21
17
2
1
—
1
—
Lexington, KY
62
39
13
8
—
2
2
Buffalo, NY
72
50
17
3
2
—
6
Memphis, TN
202
132
57
7
6
—
21
Camden, NJ
38
18
14
2
1
3
3
Mobile, AL
92
68
18
3
1
2
9
Elizabeth, NJ
8
4
4
—
—
—
1
Montgomery, AL
19
16
2
—
—
—
3
Erie, PA
44
33
8
1
—
2
4
Nashville, TN
158
96
38
16
7
1
12
Jersey City, NJ
12
8
4
—
—
—
3
W.S. Central
1,182
736
277
98
41
30
54
New York City, NY
934
660
203
41
18
12
32
Austin, TX
98
55
32
11
—
—
2
Newark, NJ
41
19
12
8
1
1
2
Baton Rouge, LA
77
41
12
15
6
3
—
Paterson, NJ
16
12
1
2
—
1
—
Corpus Christi, TX
47
33
10
2
—
2
1
Philadelphia, PA
169
102
39
19
7
2
4
Dallas, TX
187
114
46
14
2
11
8
Pittsburgh, PA§
43
33
8
1
—
1
3
El Paso, TX
108
70
27
5
4
2
4
Reading, PA
36
24
9
3
—
—
3
Fort Worth, TX
U
U
U
U
U
U
U
Rochester, NY
65
45
13
4
1
2
1
Houston, TX
165
84
31
25
19
6
4
Schenectady, NY
22
18
2
1
1
—
—
Little Rock, AR
90
62
19
4
3
2
3
Scranton, PA
23
18
4
1
—
—
3
New Orleans, LA
U
U
U
U
U
U
U
Syracuse, NY
59
43
12
1
2
1
4
San Antonio, TX
236
151
67
11
5
2
17
Trenton, NJ
27
21
4
2
—
—
—
Shreveport, LA
83
56
18
6
2
1
7
Utica, NY
14
11
3
—
—
—
—
Tulsa, OK
91
70
15
5
—
1
8
Yonkers, NY
15
10
5
—
—
—
—
Mountain
1,176
778
273
82
27
15
71
E.N. Central
1,710
1,158
393
91
42
26
111
Albuquerque, NM
109
80
21
4
3
1
14
Akron, OH
39
25
10
2
1
1
3
Boise, ID
59
43
9
4
2
1
2
Canton, OH
26
18
7
1
—
—
1
Colorado Springs, CO
61
35
16
4
4
2
1
Chicago, IL
228
144
57
16
9
2
12
Denver, CO
81
55
18
5
—
3
5
Cincinnati, OH
71
43
20
2
3
3
5
Las Vegas, NV
325
211
84
22
5
3
16
Cleveland, OH
239
173
52
8
5
1
12
Ogden, UT
29
20
7
1
1
—
3
Columbus, OH
218
141
57
9
7
4
17
Phoenix, AZ
176
104
48
16
4
3
10
Dayton, OH
126
91
24
5
5
1
13
Pueblo, CO
22
15
4
2
1
—
—
Detroit, MI
U
U
U
U
U
U
U
Salt Lake City, UT
140
92
28
15
3
2
9
Evansville, IN
60
44
11
3
1
1
5
Tucson, AZ
174
123
38
9
4
—
11
Fort Wayne, IN
74
52
18
1
1
2
1
Pacific
1,466
963
363
85
37
18
117
Gary, IN
12
3
5
4
—
—
—
Berkeley, CA
15
12
1
—
—
2
3
Grand Rapids, MI
45
32
8
1
2
2
2
Fresno, CA
107
63
28
10
5
1
10
Indianapolis, IN
161
102
44
9
2
4
9
Glendale, CA
30
21
8
—
—
1
4
Lansing, MI
55
44
9
2
—
—
5
Honolulu, HI
48
32
12
2
—
2
7
Milwaukee, WI
58
31
18
6
1
2
2
Long Beach, CA
61
40
14
5
2
—
4
Peoria, IL
39
27
6
3
1
2
5
Los Angeles, CA
243
155
65
13
7
3
28
Rockford, IL
45
29
10
5
—
1
2
Pasadena, CA
26
21
4
1
—
—
1
South Bend, IN
45
37
5
2
1
—
4
Portland, OR
133
83
38
10
1
1
6
Toledo, OH
107
73
26
7
1
—
9
Sacramento, CA
U
U
U
U
U
U
U
Youngstown, OH
62
49
6
5
2
—
4
San Diego, CA
143
86
40
11
5
1
11
W.N. Central
593
395
125
28
15
12
40
San Francisco, CA
118
67
36
7
5
3
4
Des Moines, IA
78
58
13
3
2
2
12
San Jose, CA
214
153
47
9
3
2
14
Duluth, MN
42
25
12
3
2
—
4
Santa Cruz, CA
40
26
12
2
—
—
4
Kansas City, KS
21
14
6
1
—
—
—
Seattle, WA
120
83
27
4
4
2
7
Kansas City, MO
67
46
2
—
1
1
1
Spokane, WA
60
41
12
5
2
—
6
Lincoln, NE
42
30
10
1
1
—
—
Tacoma, WA
108
80
19
6
3
—
8
Minneapolis, MN
60
33
16
3
3
5
4
Total¶
10,091
6,648
2,381
631
243
168
634
Omaha, NE
95
69
21
3
1
1
9
St. Louis, MO
47
19
16
6
3
2
4
St. Paul, MN
60
46
10
3
—
1
4
Wichita, KS
81
55
19
5
2
—
2
U: Unavailable. —: No reported cases.
* Mortality data in this table are voluntarily reported from 122 cities in the United States, most of which have populations of >100,000. A death is reported by the place of its occurrence and by the week that the death certificate was filed. Fetal deaths are not included.
† Pneumonia and influenza.
§ Because of changes in reporting methods in this Pennsylvania city, these numbers are partial counts for the current week. Complete counts will be available in 4 to 6 weeks.