Persons using assistive technology might not be able to fully access information in this file. For assistance, please send e-mail to: mmwrq@cdc.gov. Type 508 Accommodation and the title of the report in the subject line of e-mail.
Notifiable Diseases and Mortality Tables
Table I Summary of provisional cases of selected notifiable diseases, United States, cumulative, week ending August 18, 2012 (33rd Week)
Figure I Selected notifiable disease reports, United States, comparison of provisional 4-week totals ending August 18, 2012, with historical data
Table II Provisional cases of selected notifiable diseases, United States, weeks ending August 18, 2012 and August 20, 2011 (33rd Week)
Table III Deaths in 122 U.S. cities, week ending August 18, 2012 (33rd Week)
TABLE I. Provisional cases of infrequently reported notifiable diseases (<1,000 cases reported during the preceding year) — United States, week ending August 18, 2012 (33rd week)*
MD (1), NC (1), FL (1), AL (1), AZ (1), WA (7), CA (2)
Viral hemorrhagic fever¶¶¶
—
—
—
—
1
NN
NN
NN
Yellow fever
—
—
—
—
—
—
—
—
See Table 1 footnotes on next page.
TABLE I. (Continued) Provisional cases of infrequently reported notifiable diseases (<1,000 cases reported during the preceding year) — United States, week ending August 18, 2012 (33rd week)*
—: No reported cases. N: Not reportable. NN: Not Nationally Notifiable. Cum: Cumulative year-to-date counts.
† Calculated by summing the incidence counts for the current week, the 2 weeks preceding the current week, and the 2 weeks following the current week, for a total of 5 preceding years. The total sum of incident cases is then divided by 25 weeks. Additional information is available at http://wwwn.cdc.gov/nndss/document/5yearweeklyaverage.pdf.
§ Not reportable in all states. Data from states where the condition is not reportable are excluded from this table except starting in 2007 for the arboviral diseases, STD data, TB data, and influenza-associated pediatric mortality, and in 2003 for SARS-CoV. Reporting exceptions are available at http://wwwn.cdc.gov/nndss/document/SRCA_FINAL_REPORT_2006-2010.xlsx.
¶ Includes both neuroinvasive and nonneuroinvasive. Updated weekly from reports to the Division of Vector-Borne Infectious Diseases, National Center for Zoonotic, Vector-Borne, and Enteric Diseases (ArboNET Surveillance). Data for West Nile virus are available in Table II.
** Data for H. influenzae (all ages, all serotypes) are available in Table II.
†† Updated weekly from reports to the Influenza Division, National Center for Immunization and Respiratory Diseases. Since October 2, 2011, 34 influenza-associated pediatric deaths occurring during the 2011-12 influenza season have been reported.
§§ No measles cases were reported for the current week.
¶¶ Data for meningococcal disease (all serogroups) are available in Table II.
*** CDC discontinued reporting of individual confirmed and probable cases of 2009 pandemic influenza A (H1N1) virus infections on July 24, 2009. During 2009, four cases of human infection with novel influenza A viruses, different from the 2009 pandemic influenza A (H1N1) strain, were reported to CDC. The four cases of novel influenza A virus infection reported to CDC during 2010, the fourteen cases reported during 2011, and the one case reported in 2012 are different from the 2009 pandemic influenza A (H1N1) virus. Total case counts are provided by the Influenza Division, National Center for Immunization and Respiratory Diseases (NCIRD).
††† The one rubella case reported for the current week was unknown.
§§§ Updated weekly from reports to the Division of STD Prevention, National Center for HIV/AIDS, Viral Hepatitis, STD, and TB Prevention.
¶¶¶ There were no cases of viral hemorrhagic fever reported during the current week. See Table II for dengue hemorrhagic fever.
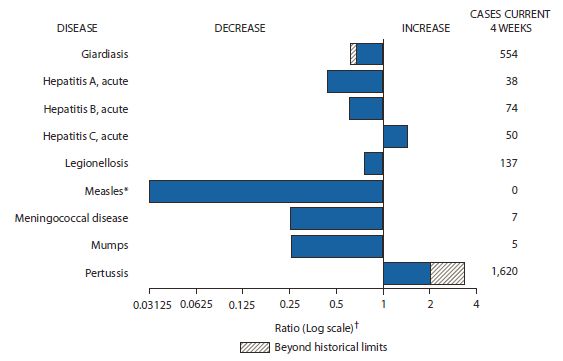
FIGURE I. Selected notifiable disease reports, United States, comparison of provisional 4-week totals August 18, 2012, with historical data
* No measles cases were reported for the current 4-week period yielding a ratio for week 33 of zero (0).
† Ratio of current 4-week total to mean of 15 4-week totals (from previous, comparable, and subsequent 4-week periods for the past 5 years). The point where the hatched area begins is based on the mean and two standard deviations of these 4-week totals.
Alternate Text: The figure above shows selected notifiable disease reports for the United States, with comparison of provisional 4-week totals through August 18, 2012, with historical data. Reports of acute hepatitis C, and pertussis increased, with pertussis increasing beyond historical limits. Reports of giardiasis, acute hepatitis A, acute hepatitis B, legionellosis, measles, meningococcal disease, and mumps decreased, with giardiasis decreasing beyond historical limits.
TABLE II. Provisional cases of selected notifiable diseases, United States, weeks ending August 18, 2012, and August 20, 2011 (33rd week)*
Reporting area
Chlamydia trachomatis infection
Coccidioidomycosis
Cryptosporidiosis
Current week
Previous 52 weeks
Cum 2012
Cum 2011
Current week
Previous 52 weeks
Cum 2012
Cum 2011
Current week
Previous 52 weeks
Cum 2012
Cum 2011
Med
Max
Med
Max
Med
Max
United States
14,223
26,480
30,645
811,473
881,411
167
409
578
11,975
14,184
75
125
416
3,854
5,484
New England
900
933
1,807
28,710
27,928
—
0
1
1
1
—
6
17
212
282
Connecticut
—
250
1,268
6,657
6,337
N
0
0
N
N
—
1
4
22
54
Maine
—
57
99
1,655
2,005
N
0
0
N
N
—
1
4
44
36
Massachusetts
748
450
680
14,747
14,238
—
0
0
—
—
—
3
7
84
112
New Hampshire
44
62
86
1,927
1,816
—
0
0
—
1
—
1
4
24
49
Rhode Island
87
80
186
2,772
2,608
—
0
1
1
—
—
0
10
7
1
Vermont
21
27
71
952
924
N
0
0
N
N
—
1
6
31
30
Mid. Atlantic
2,310
3,550
4,469
111,451
112,553
—
0
1
4
3
17
14
44
402
593
New Jersey
198
539
629
17,320
16,759
N
0
0
N
N
—
0
4
11
35
New York (Upstate)
697
726
2,215
22,961
22,199
N
0
0
N
N
9
4
17
111
116
New York City
444
1,180
1,491
36,467
41,128
N
0
0
N
N
—
2
7
51
52
Pennsylvania
971
1,088
1,305
34,703
32,467
—
0
1
4
3
8
7
21
229
390
E.N. Central
1,325
4,031
4,785
120,701
139,123
1
1
4
34
36
17
32
150
951
1,424
Illinois
44
1,146
1,494
31,942
40,870
N
0
0
N
N
—
3
10
90
147
Indiana
202
566
822
17,576
17,765
N
0
0
N
N
—
3
10
81
192
Michigan
585
931
1,210
25,764
31,734
—
0
3
18
21
2
7
30
188
208
Ohio
285
1,010
1,180
31,396
33,339
1
0
2
16
15
12
12
95
326
426
Wisconsin
209
466
608
14,023
15,415
—
0
0
—
—
3
8
50
266
451
W.N. Central
89
1,046
1,825
28,831
49,347
—
2
8
84
96
5
18
92
536
998
Iowa
28
211
387
6,879
6,897
N
0
0
N
N
1
5
16
195
280
Kansas
57
213
308
6,970
6,522
N
0
0
N
N
—
0
7
23
21
Minnesota
—
320
408
7,888
10,374
—
1
7
73
77
—
0
15
—
215
Missouri
—
0
683
—
17,830
—
0
2
10
13
1
5
60
150
217
Nebraska
—
128
218
3,855
4,076
—
0
1
1
6
3
2
8
80
132
North Dakota
4
50
78
1,609
1,480
N
0
0
N
N
—
0
12
19
15
South Dakota
—
66
93
1,630
2,168
N
0
0
N
N
—
2
5
69
118
S. Atlantic
4,265
5,502
7,543
176,799
179,939
—
0
1
2
4
12
18
55
618
791
Delaware
57
82
182
2,377
2,695
—
0
0
—
—
1
0
4
11
6
District of Columbia
139
133
224
4,340
4,080
—
0
0
—
—
N
0
0
N
N
Florida
958
1,507
1,738
49,590
49,025
N
0
0
N
N
10
8
15
274
291
Georgia
842
1,042
1,285
32,958
34,766
N
0
0
N
N
—
3
11
87
208
Maryland
571
459
824
14,459
16,653
—
0
1
2
4
—
1
7
62
47
North Carolina
886
981
1,686
30,108
31,451
N
0
0
N
N
—
0
46
58
35
South Carolina
—
510
1,278
17,391
17,677
N
0
0
N
N
1
1
4
35
96
Virginia
726
693
1,780
22,625
20,962
N
0
0
N
N
—
3
6
90
85
West Virginia
86
89
146
2,951
2,630
N
0
0
N
N
—
0
4
1
23
E.S. Central
812
1,995
2,820
64,768
62,065
—
0
0
—
—
1
5
26
157
234
Alabama
—
589
796
18,722
18,330
N
0
0
N
N
1
2
5
67
91
Kentucky
550
329
760
10,819
9,891
N
0
0
N
N
—
1
18
19
58
Mississippi
—
429
1,168
14,858
14,252
N
0
0
N
N
—
1
4
24
24
Tennessee
262
641
828
20,369
19,592
N
0
0
N
N
—
1
5
47
61
W.S. Central
2,363
3,291
4,436
106,178
117,076
—
0
1
—
2
8
10
45
263
321
Arkansas
300
316
412
10,610
10,438
N
0
0
N
N
—
1
4
23
14
Louisiana
204
587
1,231
13,837
17,950
—
0
1
—
2
1
1
6
62
62
Oklahoma
—
108
1,015
2,446
8,552
N
0
0
N
N
6
1
5
55
58
Texas
1,859
2,413
3,101
79,285
80,136
N
0
0
N
N
1
6
41
123
187
Mountain
1,089
1,712
2,430
53,177
55,333
161
296
477
9,562
10,890
4
10
29
338
441
Arizona
255
594
873
19,384
18,018
158
291
475
9,426
10,732
—
1
3
20
26
Colorado
416
392
705
10,587
13,049
N
0
0
N
N
—
2
7
48
106
Idaho
59
85
193
2,096
2,677
N
0
0
N
N
4
2
21
95
79
Montana
83
72
99
2,413
2,094
—
0
1
2
3
—
1
5
47
51
Nevada
210
211
285
6,324
6,916
3
2
7
85
62
—
0
2
8
10
New Mexico
55
218
461
7,240
6,824
—
0
7
19
51
—
2
7
63
97
Utah
10
142
191
4,211
4,384
—
1
4
26
39
—
1
5
33
42
Wyoming
1
34
61
922
1,371
—
0
2
4
3
—
0
9
24
30
Pacific
1,070
4,011
5,070
120,858
138,047
5
101
179
2,288
3,152
11
11
23
377
400
Alaska
23
108
152
3,452
3,690
N
0
0
N
N
—
0
3
3
5
California
730
3,072
4,094
90,878
107,486
5
101
179
2,285
3,142
3
6
16
201
214
Hawaii
—
116
147
3,130
3,697
N
0
0
N
N
—
0
1
5
—
Oregon
—
263
368
8,501
8,614
—
0
1
3
10
7
4
10
127
134
Washington
317
460
612
14,897
14,560
—
0
10
—
—
1
1
8
41
47
Territories
American Samoa
—
0
59
59
—
N
0
0
N
N
N
0
0
N
N
C.N.M.I.
—
—
—
—
—
—
—
—
—
—
—
—
—
—
—
Guam
—
22
30
—
678
—
0
0
—
—
—
0
0
—
—
Puerto Rico
118
104
289
3,692
3,669
N
0
0
N
N
N
0
0
N
N
U.S. Virgin Islands
—
14
26
326
533
—
0
0
—
—
—
0
0
—
—
C.N.M.I.: Commonwealth of Northern Mariana Islands.
U: Unavailable. —: No reported cases. N: Not reportable. NN: Not Nationally Notifiable. Cum: Cumulative year-to-date counts. Med: Median. Max: Maximum.
† Data for meningococcal disease, invasive caused by serogroups A, C, Y, and W-135; serogroup B; other serogroup; and unknown serogroup are available in Table I.
TABLE II. (Continued) Provisional cases of selected notifiable diseases, United States, weeks ending August 18, 2012, and August 20, 2011 (33rd week)*
Reporting area
Rabies, animal
Salmonellosis
Shiga toxin-producing E. coli (STEC)†
Current week
Previous 52 weeks
Cum 2012
Cum 2011
Current week
Previous 52 weeks
Cum 2012
Cum 2011
Current week
Previous 52 weeks
Cum 2012
Cum 2011
Med
Max
Med
Max
Med
Max
United States
70
66
133
2,005
2,773
711
911
1,692
24,529
29,451
74
99
243
2,689
3,558
New England
10
7
14
239
209
7
37
80
1,164
1,430
2
3
12
110
139
Connecticut
6
3
10
116
122
—
7
15
267
338
—
1
5
29
38
Maine
1
1
6
60
40
2
3
9
95
86
—
0
2
5
21
Massachusetts
—
0
0
—
—
—
17
49
615
707
—
1
7
50
51
New Hampshire
2
0
3
19
16
—
2
6
77
123
1
0
4
14
16
Rhode Island
—
0
6
16
15
5
2
12
60
132
—
0
2
1
4
Vermont
1
1
4
28
16
—
1
8
50
44
1
0
3
11
9
Mid. Atlantic
20
12
36
322
514
78
91
207
2,738
3,571
16
10
30
292
411
New Jersey
—
0
0
—
—
—
16
36
418
800
—
2
8
37
95
New York (Upstate)
20
7
20
278
220
43
25
67
773
810
13
3
13
113
126
New York City
—
0
1
—
9
10
19
41
642
710
—
1
5
46
57
Pennsylvania
—
4
15
44
285
25
28
66
905
1,251
3
3
14
96
133
E.N. Central
12
3
20
106
113
45
80
186
2,658
3,279
16
13
46
384
618
Illinois
5
1
6
49
30
—
27
68
895
1,117
—
2
10
62
154
Indiana
—
0
7
5
17
—
13
36
354
392
—
2
8
64
91
Michigan
—
0
6
29
40
5
16
42
476
505
1
3
11
89
95
Ohio
7
0
6
23
26
40
22
53
809
737
15
3
20
124
103
Wisconsin
N
0
0
N
N
—
5
25
124
528
—
2
22
45
175
W.N. Central
—
3
15
99
113
31
51
113
1,584
1,850
8
16
44
426
619
Iowa
—
0
4
13
15
3
8
30
351
297
—
2
12
91
139
Kansas
—
1
4
44
21
1
9
27
285
255
—
2
8
46
62
Minnesota
—
0
6
—
32
—
0
26
—
472
—
0
17
—
175
Missouri
—
0
3
22
16
26
16
42
649
535
7
5
31
198
141
Nebraska
—
0
3
—
21
1
4
15
181
151
1
1
8
53
72
North Dakota
—
0
13
20
8
—
0
19
25
22
—
0
4
14
4
South Dakota
—
0
0
—
—
—
2
9
93
118
—
1
3
24
26
S. Atlantic
16
18
45
611
776
309
237
643
6,753
7,917
6
11
31
322
377
Delaware
—
0
0
—
—
1
2
11
86
115
—
0
2
8
12
District of Columbia
—
0
0
—
—
—
1
7
23
48
—
0
1
4
3
Florida
—
0
34
64
120
171
110
201
3,014
2,980
4
3
11
138
73
Georgia
—
0
0
—
—
—
24
101
480
1,520
—
1
6
36
79
Maryland
—
5
16
177
208
18
17
45
523
594
1
1
4
39
40
North Carolina
—
0
0
—
—
112
41
230
1,281
1,120
1
1
26
38
77
South Carolina
N
0
0
N
N
7
25
71
687
850
—
0
7
16
12
Virginia
15
10
25
327
385
—
21
57
584
619
—
1
7
40
78
West Virginia
1
1
9
43
63
—
1
52
75
71
—
0
2
3
3
E.S. Central
—
2
6
50
109
37
70
186
2,030
2,286
1
5
14
158
207
Alabama
—
1
5
41
54
15
21
55
563
641
—
1
3
34
61
Kentucky
—
0
2
9
10
—
8
39
222
331
—
1
5
29
42
Mississippi
—
0
0
—
—
1
24
87
650
731
1
0
3
17
24
Tennessee
—
0
2
—
45
21
18
51
595
583
—
2
12
78
80
W.S. Central
12
14
40
441
767
87
145
374
3,397
4,116
5
10
92
323
303
Arkansas
—
0
20
76
40
40
14
52
418
408
2
1
6
35
27
Louisiana
—
0
1
—
3
8
25
50
684
864
1
0
3
18
13
Oklahoma
—
0
21
27
31
20
15
102
407
353
2
2
16
51
37
Texas
12
11
29
338
693
19
77
227
1,888
2,491
—
8
76
219
226
Mountain
—
1
7
45
39
27
43
88
1,258
1,633
3
9
46
280
460
Arizona
N
0
0
N
N
12
15
28
404
514
—
2
6
86
87
Colorado
—
0
0
—
—
—
9
23
272
345
—
2
6
41
107
Idaho
—
0
1
—
2
—
2
7
75
96
1
1
8
44
64
Montana
N
0
0
N
N
3
2
7
67
87
2
0
5
24
26
Nevada
—
0
3
6
4
9
3
12
116
115
—
0
2
14
30
New Mexico
—
1
5
33
7
—
5
19
139
210
—
0
3
22
31
Utah
—
0
2
6
6
—
5
12
144
213
—
1
29
35
101
Wyoming
—
0
4
—
20
3
1
8
41
53
—
0
8
14
14
Pacific
—
4
14
92
133
90
91
179
2,947
3,369
17
15
36
394
424
Alaska
—
0
1
6
11
—
1
5
36
40
—
0
0
—
—
California
—
3
13
78
111
48
64
142
2,113
2,559
1
7
20
186
274
Hawaii
—
0
0
—
—
8
5
20
176
205
—
0
2
8
5
Oregon
—
0
2
8
11
5
6
16
230
243
4
2
11
105
70
Washington
—
0
11
—
—
29
12
42
392
322
12
2
18
95
75
Territories
American Samoa
N
0
0
N
N
—
1
2
4
—
—
0
0
—
—
C.N.M.I.
—
—
—
—
—
—
—
—
—
—
—
—
—
—
—
Guam
—
0
0
—
—
—
0
4
—
16
—
0
0
—
—
Puerto Rico
—
0
5
27
30
—
2
19
29
313
—
0
0
—
—
U.S. Virgin Islands
—
0
0
—
—
—
0
6
—
—
—
0
0
—
—
C.N.M.I.: Commonwealth of Northern Mariana Islands.
U: Unavailable. —: No reported cases. N: Not reportable. NN: Not Nationally Notifiable. Cum: Cumulative year-to-date counts. Med: Median. Max: Maximum.
† Illnesses with similar clinical presentation that result from Spotted fever group rickettsia infections are reported as Spotted fever rickettsioses. Rocky Mountain spotted fever (RMSF) caused by Rickettsia rickettsii, is the most common and well-known spotted fever.
TABLE II. (Continued) Provisional cases of selected notifiable diseases, United States, weeks ending August 18, 2012, and August 20, 2011 (33rd week)*
Reporting area
Streptococcus pneumoniae,† invasive disease
Syphilis, primary and secondary
All ages
Age <5
Current week
Previous 52 weeks
Cum 2012
Cum 2011
Current week
Previous 52 weeks
Cum 2012
Cum 2011
Current week
Previous 52 weeks
Cum 2012
Cum 2011
Med
Max
Med
Max
Med
Max
United States
45
274
803
8,336
11,217
5
21
58
562
771
106
271
323
8,227
8,667
New England
—
12
27
399
549
—
1
4
29
31
1
8
23
267
240
Connecticut
—
6
13
200
241
—
0
2
8
6
—
0
13
21
32
Maine
—
2
7
71
88
—
0
1
2
3
—
0
6
13
11
Massachusetts
—
1
4
25
21
—
0
3
14
10
1
6
13
182
152
New Hampshire
—
1
6
49
75
—
0
1
4
5
—
0
2
15
13
Rhode Island
—
0
5
20
72
—
0
1
1
2
—
1
6
33
27
Vermont
—
1
4
34
52
—
0
1
—
5
—
0
2
3
5
Mid. Atlantic
7
43
157
1,305
1,718
—
2
11
59
85
17
33
47
1,031
1,079
New Jersey
—
9
26
258
471
—
0
2
10
32
—
4
8
102
151
New York (Upstate)
5
17
108
606
755
—
1
10
34
31
4
4
12
130
110
New York City
2
13
24
441
492
—
0
3
15
22
5
17
22
503
589
Pennsylvania
N
0
0
N
N
N
0
0
N
N
8
9
17
296
229
E.N. Central
12
61
101
1,781
2,183
1
3
10
113
122
6
28
62
810
1,189
Illinois
N
0
0
N
N
—
0
0
—
—
3
11
54
308
535
Indiana
—
13
33
362
526
—
1
2
16
24
2
3
10
125
115
Michigan
—
12
25
340
478
—
0
3
23
26
—
4
13
115
205
Ohio
8
23
46
789
851
1
1
6
55
58
—
7
15
221
289
Wisconsin
4
9
27
290
328
—
0
2
19
14
1
1
3
41
45
W.N. Central
2
12
58
310
429
1
1
3
23
36
—
3
11
70
217
Iowa
N
0
0
N
N
N
0
0
N
N
—
1
3
30
12
Kansas
N
0
0
N
N
N
0
0
N
N
—
0
4
9
16
Minnesota
—
8
26
193
334
—
0
3
13
29
—
1
4
26
100
Missouri
N
0
0
N
N
—
0
0
—
—
—
0
8
—
83
Nebraska
2
2
8
102
77
1
0
2
9
7
—
0
2
3
6
North Dakota
—
0
38
15
18
—
0
2
1
—
—
0
1
2
—
South Dakota
—
0
0
—
—
—
0
0
—
—
—
0
0
—
—
S. Atlantic
13
58
193
1,917
2,770
1
4
21
133
201
34
65
98
2,029
2,136
Delaware
—
1
5
23
35
—
0
0
—
—
—
0
6
24
13
District of Columbia
—
1
5
39
35
—
0
1
1
5
5
3
9
119
120
Florida
10
20
48
652
946
—
1
8
49
87
3
26
36
809
782
Georgia
—
17
48
460
784
—
1
6
36
46
12
11
59
363
386
Maryland
1
7
22
222
417
—
0
5
20
31
5
7
15
228
292
North Carolina
N
0
0
N
N
N
0
0
N
N
7
6
21
204
273
South Carolina
2
7
16
252
327
1
0
3
14
20
—
4
11
142
135
Virginia
N
0
0
N
N
—
0
0
—
—
2
3
15
137
133
West Virginia
—
5
83
269
226
—
0
8
13
12
—
0
2
3
2
E.S. Central
1
19
50
602
790
—
2
5
35
55
8
15
32
457
495
Alabama
—
0
0
—
—
—
0
0
—
—
—
3
9
110
150
Kentucky
—
4
9
132
154
—
0
1
4
16
7
2
9
84
75
Mississippi
—
0
0
—
—
—
0
0
—
—
—
3
21
105
97
Tennessee
1
15
47
470
636
—
1
4
31
39
1
5
14
158
173
W.S. Central
4
30
188
992
1,330
1
3
12
86
126
29
42
53
1,361
1,136
Arkansas
1
3
14
107
152
—
0
3
10
11
3
3
15
112
126
Louisiana
—
4
18
131
156
—
0
2
9
14
1
7
16
177
268
Oklahoma
N
0
0
N
N
—
0
0
—
—
1
1
6
40
44
Texas
3
22
156
754
1,022
1
2
11
67
101
24
28
44
1,032
698
Mountain
6
27
48
945
1,341
1
2
6
71
108
5
10
21
315
401
Arizona
6
11
27
469
590
1
1
3
35
45
1
4
11
110
170
Colorado
—
7
17
238
358
—
0
3
14
25
1
2
6
71
76
Idaho
N
0
0
N
N
—
0
0
—
—
—
0
3
16
4
Montana
—
0
0
—
—
N
0
0
N
N
—
0
1
—
5
Nevada
—
0
0
—
—
—
0
0
—
—
3
2
7
62
88
New Mexico
—
5
14
173
237
—
0
4
12
18
—
1
5
46
49
Utah
—
2
9
45
137
—
0
2
9
20
—
0
2
8
9
Wyoming
—
0
3
20
19
—
0
1
1
—
—
0
1
2
—
Pacific
—
2
8
85
107
—
0
2
13
7
6
58
84
1,887
1,774
Alaska
—
2
8
83
105
—
0
2
13
7
—
0
2
6
1
California
N
0
0
N
N
N
0
0
N
N
5
49
71
1,583
1,497
Hawaii
—
0
1
2
2
—
0
1
—
—
—
0
3
6
8
Oregon
N
0
0
N
N
N
0
0
N
N
—
3
12
117
57
Washington
N
0
0
N
N
N
0
0
N
N
1
6
12
175
211
Territories
American Samoa
N
0
0
N
N
—
0
0
—
—
—
0
0
—
—
C.N.M.I.
—
—
—
—
—
—
—
—
—
—
—
—
—
—
—
Guam
—
0
0
—
—
—
0
0
—
—
—
0
0
—
—
Puerto Rico
—
0
0
—
—
—
0
0
—
—
—
5
15
151
144
U.S. Virgin Islands
—
0
0
—
—
—
0
0
—
—
—
0
0
—
—
C.N.M.I.: Commonwealth of Northern Mariana Islands.
U: Unavailable. —: No reported cases. N: Not reportable. NN: Not Nationally Notifiable. Cum: Cumulative year-to-date counts. Med: Median. Max: Maximum.
† Includes drug resistant and susceptible cases of invasive Streptococcus pneumoniae disease among children <5 years and among all ages. Case definition: Isolation of S. pneumoniae from a normally sterile body site (e.g., blood or cerebrospinal fluid).
TABLE II. (Continued) Provisional cases of selected notifiable diseases, United States, weeks ending August 18, 2012, and August 20, 2011 (33rd week)*
Reporting area
Varicella (chickenpox)
West Nile virus disease†
Neuroinvasive
Nonneuroinvasive§
Current week
Previous 52 weeks
Cum 2012
Cum 2011
Current week
Previous 52 weeks
Cum 2012
Cum 2011
Current week
Previous 52 weeks
Cum 2012
Cum 2011
Med
Max
Med
Max
Med
Max
United States
52
286
401
7,469
8,818
1
1
129
629
185
3
0
113
489
108
New England
6
28
49
906
829
—
0
3
3
4
—
0
1
—
—
Connecticut
1
7
12
176
170
—
0
2
2
3
—
0
1
—
—
Maine
4
4
22
177
142
—
0
0
—
—
—
0
0
—
—
Massachusetts
—
12
21
391
316
—
0
2
1
—
—
0
1
—
—
New Hampshire
—
0
10
—
100
—
0
0
—
—
—
0
0
—
—
Rhode Island
—
1
9
61
30
—
0
1
—
—
—
0
0
—
—
Vermont
1
2
13
101
71
—
0
0
—
1
—
0
0
—
—
Mid. Atlantic
4
26
56
804
1,038
—
0
11
10
11
—
0
6
4
14
New Jersey
—
8
25
300
335
—
0
1
1
—
—
0
1
1
4
New York (Upstate)
N
0
0
N
N
—
0
5
3
6
—
0
4
—
8
New York City
—
0
0
—
—
—
0
4
1
4
—
0
1
—
1
Pennsylvania
4
18
35
504
703
—
0
2
5
1
—
0
1
3
1
E.N. Central
14
71
128
1,800
2,076
—
0
23
54
21
—
0
7
21
10
Illinois
—
18
38
497
470
—
0
10
19
6
—
0
5
2
3
Indiana
—
7
21
240
117
—
0
2
2
4
—
0
3
5
1
Michigan
7
19
45
524
611
—
0
10
20
9
—
0
4
10
—
Ohio
7
19
47
538
600
—
0
5
12
2
—
0
2
4
5
Wisconsin
—
0
12
1
278
—
0
1
1
—
—
0
0
—
1
W.N. Central
2
15
35
377
426
1
0
14
54
6
—
0
37
93
10
Iowa
N
0
0
N
N
—
0
2
1
1
—
0
2
2
—
Kansas
—
5
21
85
214
—
0
3
9
—
—
0
2
6
—
Minnesota
—
0
1
—
—
1
0
3
10
—
—
0
4
10
1
Missouri
2
5
23
246
136
—
0
2
2
2
—
0
2
1
1
Nebraska
—
0
3
10
14
—
0
4
3
3
—
0
4
14
5
North Dakota
—
0
29
17
30
—
0
2
5
—
—
0
5
12
3
South Dakota
—
1
6
19
32
—
0
11
24
—
—
0
22
48
—
S. Atlantic
5
31
57
859
1,234
—
0
12
27
34
1
0
6
15
16
Delaware
—
0
2
3
5
—
0
1
—
—
—
0
0
—
—
District of Columbia
—
0
4
12
12
—
0
3
—
6
—
0
1
—
4
Florida
5
16
50
599
571
—
0
4
8
10
—
0
2
5
2
Georgia
—
0
4
18
11
—
0
4
10
7
—
0
3
4
5
Maryland
N
0
0
N
N
—
0
5
4
3
1
0
2
5
5
North Carolina
N
0
0
N
N
—
0
1
1
1
—
0
0
—
—
South Carolina
—
0
2
5
12
—
0
2
3
—
—
0
0
—
—
Virginia
—
8
24
193
331
—
0
2
1
6
—
0
1
1
—
West Virginia
—
0
14
29
292
—
0
1
—
1
—
0
0
—
—
E.S. Central
2
4
14
127
187
—
0
12
51
24
—
0
9
41
8
Alabama
2
4
14
119
177
—
0
2
4
2
—
0
1
4
—
Kentucky
N
0
0
N
N
—
0
2
1
—
—
0
1
—
—
Mississippi
—
0
3
8
10
—
0
11
44
18
—
0
9
35
8
Tennessee
N
0
0
N
N
—
0
3
2
4
—
0
2
2
—
W.S. Central
17
52
213
1,650
1,841
—
0
91
402
19
2
0
72
286
11
Arkansas
—
4
28
116
194
—
0
4
9
1
—
0
1
1
—
Louisiana
—
1
6
31
58
—
0
14
47
3
—
0
7
26
4
Oklahoma
N
0
0
N
N
—
0
13
48
—
—
0
7
20
—
Texas
17
46
204
1,503
1,589
—
0
66
298
15
2
0
63
239
7
Mountain
2
30
61
858
1,093
—
0
11
11
32
—
0
5
12
19
Arizona
—
11
26
281
439
—
0
7
7
26
—
0
4
5
10
Colorado
—
8
32
261
247
—
0
2
2
—
—
0
2
3
2
Idaho
N
0
0
N
N
—
0
1
1
—
—
0
1
2
1
Montana
2
2
7
72
121
—
0
1
—
—
—
0
1
1
—
Nevada
N
0
0
N
N
—
0
4
—
4
—
0
2
—
3
New Mexico
—
2
8
63
36
—
0
1
1
1
—
0
1
1
—
Utah
—
5
20
169
242
—
0
1
—
—
—
0
1
—
2
Wyoming
—
0
2
12
8
—
0
1
—
1
—
0
1
—
1
Pacific
—
3
9
88
94
—
0
18
17
34
—
0
8
17
20
Alaska
—
1
4
44
33
—
0
0
—
—
—
0
0
—
—
California
—
0
4
14
27
—
0
18
17
34
—
0
8
17
20
Hawaii
—
1
3
30
34
—
0
0
—
—
—
0
0
—
—
Oregon
N
0
0
N
N
—
0
0
—
—
—
0
0
—
—
Washington
N
0
0
N
N
—
0
0
—
—
—
0
0
—
—
Territories
American Samoa
N
0
0
N
N
—
0
0
—
—
—
0
0
—
—
C.N.M.I.
—
—
—
—
—
—
—
—
—
—
—
—
—
—
—
Guam
—
3
5
—
48
—
0
0
—
—
—
0
0
—
—
Puerto Rico
1
4
14
70
283
—
0
0
—
—
—
0
0
—
—
U.S. Virgin Islands
—
0
1
—
—
—
0
0
—
—
—
0
0
—
—
C.N.M.I.: Commonwealth of Northern Mariana Islands.
U: Unavailable. —: No reported cases. N: Not reportable. NN: Not Nationally Notifiable. Cum: Cumulative year-to-date counts. Med: Median. Max: Maximum.
† Updated weekly from reports to the Division of Vector-Borne Infectious Diseases, National Center for Zoonotic, Vector-Borne, and Enteric Diseases (ArboNET Surveillance). Data for California serogroup, eastern equine, Powassan, St. Louis, and western equine diseases are available in Table I.
§ Not reportable in all states. Data from states where the condition is not reportable are excluded from this table, except starting in 2007 for the domestic arboviral diseases and influenza-associated pediatric mortality, and in 2003 for SARS-CoV. Reporting exceptions are available at http://wwwn.cdc.gov/nndss/document/SRCA_FINAL_REPORT_2006-2010.xlsx.
TABLE III. Deaths in 122 U.S. cities,* week ending August 18, 2012 (33rd week)
Reporting area
All causes, by age (years)
P&I† Total
Reporting area (Continued)
All causes, by age (years)
P&I† Total
All Ages
=65
45–64
25–44
1–24
<1
All Ages
=65
45–64
25–44
1–24
<1
New England
441
309
90
27
10
5
29
S. Atlantic
791
477
216
56
26
16
54
Boston, MA
132
82
37
9
4
—
9
Atlanta, GA
130
83
35
10
2
—
17
Bridgeport, CT
30
23
5
2
—
—
—
Baltimore, MD
142
80
37
16
5
4
6
Cambridge, MA
16
14
1
1
—
—
—
Charlotte, NC
109
70
27
7
5
—
5
Fall River, MA
18
15
3
—
—
—
—
Jacksonville, FL
1
1
—
—
—
—
—
Hartford, CT
43
32
8
2
—
1
5
Miami, FL
45
26
10
7
2
—
2
Lowell, MA
20
17
2
—
1
—
1
Norfolk, VA
57
32
19
1
3
2
—
Lynn, MA
6
4
—
1
1
—
—
Richmond, VA
54
33
15
2
4
—
2
New Bedford, MA
24
15
3
5
1
—
1
Savannah, GA
44
27
12
3
—
2
4
New Haven, CT
U
U
U
U
U
U
U
St. Petersburg, FL
45
27
13
3
—
2
3
Providence, RI
33
26
6
1
—
—
4
Tampa, FL
20
14
4
—
1
1
1
Somerville, MA
1
1
—
—
—
—
—
Washington, D.C.
126
74
36
7
4
5
13
Springfield, MA
37
21
11
2
3
—
4
Wilmington, DE
18
10
8
—
—
—
1
Waterbury, CT
18
14
4
—
—
—
1
E.S. Central
808
547
185
48
10
17
59
Worcester, MA
63
45
10
4
—
4
4
Birmingham, AL
160
113
34
11
1
—
12
Mid. Atlantic
1,727
1,180
398
109
20
20
85
Chattanooga, TN
77
56
16
3
—
2
4
Albany, NY
47
32
13
1
—
1
3
Knoxville, TN
103
75
21
6
—
1
12
Allentown, PA
32
25
6
—
—
1
—
Lexington, KY
60
43
12
3
1
1
—
Buffalo, NY
81
52
20
8
—
1
3
Memphis, TN
173
111
38
13
3
8
23
Camden, NJ
23
9
11
2
—
1
2
Mobile, AL
56
35
17
2
1
1
1
Elizabeth, NJ
10
2
7
1
—
—
—
Montgomery, AL
26
19
6
1
—
—
2
Erie, PA
48
34
12
2
—
—
6
Nashville, TN
153
95
41
9
4
4
5
Jersey City, NJ
12
12
—
—
—
—
1
W.S. Central
1,131
726
293
72
18
21
50
New York City, NY
1,024
728
210
66
10
10
42
Austin, TX
78
54
16
4
3
1
4
Newark, NJ
26
10
13
2
—
1
1
Baton Rouge, LA
32
19
10
2
1
—
—
Paterson, NJ
20
13
2
3
1
1
—
Corpus Christi, TX
57
32
19
4
2
—
4
Philadelphia, PA
136
81
40
12
2
1
6
Dallas, TX
148
87
36
13
6
6
11
Pittsburgh, PA§
60
42
15
2
1
—
3
El Paso, TX
140
102
31
4
2
1
2
Reading, PA
29
19
8
1
1
—
2
Fort Worth, TX
U
U
U
U
U
U
U
Rochester, NY
53
32
14
2
3
2
6
Houston, TX
282
180
68
23
2
9
8
Schenectady, NY
18
14
4
—
—
—
3
Little Rock, AR
80
47
29
3
—
1
1
Scranton, PA
22
18
3
1
—
—
3
New Orleans, LA
U
U
U
U
U
U
U
Syracuse, NY
30
23
6
—
1
—
3
San Antonio, TX
210
133
59
14
2
2
13
Trenton, NJ
24
13
5
5
—
1
—
Shreveport, LA
33
21
7
3
—
1
—
Utica, NY
13
8
4
—
1
—
—
Tulsa, OK
71
51
18
2
—
—
7
Yonkers, NY
19
13
5
1
—
—
1
Mountain
1,093
722
265
63
22
20
60
E.N. Central
1,969
1,298
489
110
29
43
126
Albuquerque, NM
110
81
21
5
1
2
10
Akron, OH
31
18
10
3
—
—
3
Boise, ID
48
35
10
1
—
2
1
Canton, OH
36
18
16
2
—
—
2
Colorado Springs, CO
63
38
18
5
2
—
—
Chicago, IL
264
163
61
23
8
9
9
Denver, CO
72
42
24
5
—
1
—
Cincinnati, OH
61
44
11
2
2
2
7
Las Vegas, NV
281
184
63
19
10
5
23
Cleveland, OH
257
181
57
15
3
1
22
Ogden, UT
30
20
7
3
—
—
1
Columbus, OH
260
172
68
15
1
4
15
Phoenix, AZ
190
110
58
12
5
4
8
Dayton, OH
127
96
23
4
—
4
13
Pueblo, CO
32
26
4
2
—
—
1
Detroit, MI
160
90
50
13
3
4
14
Salt Lake City, UT
131
86
31
8
2
4
11
Evansville, IN
43
29
10
4
—
—
1
Tucson, AZ
136
100
29
3
2
2
5
Fort Wayne, IN
67
46
12
5
1
3
2
Pacific
1,611
1,089
379
80
39
24
114
Gary, IN
15
6
9
—
—
—
1
Berkeley, CA
18
12
5
1
—
—
1
Grand Rapids, MI
79
54
17
—
1
7
4
Fresno, CA
107
73
20
11
3
—
14
Indianapolis, IN
171
105
47
10
5
4
11
Glendale, CA
27
20
7
—
—
—
1
Lansing, MI
51
35
12
1
3
—
3
Honolulu, HI
48
34
10
—
4
—
8
Milwaukee, WI
56
36
17
3
—
—
5
Long Beach, CA
50
35
11
2
2
—
5
Peoria, IL
48
30
15
1
1
1
4
Los Angeles, CA
247
140
73
20
5
9
25
Rockford, IL
50
36
12
1
1
—
2
Pasadena, CA
25
18
4
2
1
—
5
South Bend, IN
43
32
10
1
—
—
2
Portland, OR
107
68
31
4
3
1
1
Toledo, OH
94
68
18
5
—
3
—
Sacramento, CA
192
133
43
7
7
2
14
Youngstown, OH
56
39
14
2
—
1
6
San Diego, CA
167
112
39
8
5
3
6
W.N. Central
599
367
154
39
20
18
39
San Francisco, CA
129
90
31
8
—
—
10
Des Moines, IA
79
52
18
6
1
2
8
San Jose, CA
172
130
30
5
2
5
10
Duluth, MN
30
21
7
—
2
—
2
Santa Cruz, CA
28
18
7
2
1
—
3
Kansas City, KS
30
15
10
2
3
—
1
Seattle, WA
123
79
35
3
2
4
4
Kansas City, MO
68
42
18
5
2
1
1
Spokane, WA
71
53
13
5
—
—
5
Lincoln, NE
44
34
7
2
1
—
1
Tacoma, WA
100
74
20
2
4
—
2
Minneapolis, MN
77
44
22
5
—
6
6
Total¶
10,170
6,715
2,469
604
194
184
616
Omaha, NE
82
54
16
5
3
4
8
St. Louis, MO
59
29
19
6
3
1
2
St. Paul, MN
60
32
16
5
4
3
5
Wichita, KS
70
44
21
3
1
1
5
U: Unavailable. —: No reported cases.
* Mortality data in this table are voluntarily reported from 122 cities in the United States, most of which have populations of >100,000. A death is reported by the place of its occurrence and by the week that the death certificate was filed. Fetal deaths are not included.
† Pneumonia and influenza.
§ Because of changes in reporting methods in this Pennsylvania city, these numbers are partial counts for the current week. Complete counts will be available in 4 to 6 weeks.