Persons using assistive technology might not be able to fully access information in this file. For assistance, please send e-mail to: mmwrq@cdc.gov. Type 508 Accommodation and the title of the report in the subject line of e-mail.
Notifiable Diseases and Mortality Tables
Table I Summary of provisional cases of selected notifiable diseases, United States, cumulative, week ending August 25, 2012 (34th Week)
Figure I Selected notifiable disease reports, United States, comparison of provisional 4-week totals ending August 25, 2012, with historical data
Table II Provisional cases of selected notifiable diseases, United States, weeks ending August 25, 2012 and August 27, 2011 (34th Week)
Table III Deaths in 122 U.S. cities, week ending August 25, 2012 (34th Week)
TABLE I. Provisional cases of infrequently reported notifiable diseases (<1,000 cases reported during the preceding year) — United States, week ending August 25, 2012 (34th week)*
OH (1), MD (2), VA (2), SC (1), FL (4), TX (1), WA (6), CA (2)
Viral hemorrhagic fever¶¶¶
—
—
—
—
1
NN
NN
NN
Yellow fever
—
—
—
—
—
—
—
—
See Table 1 footnotes on next page.
TABLE I. (Continued) Provisional cases of infrequently reported notifiable diseases (<1,000 cases reported during the preceding year) — United States, week ending August 25, 2012 (34th week)*
—: No reported cases. N: Not reportable. NN: Not Nationally Notifiable. Cum: Cumulative year-to-date counts.
† Calculated by summing the incidence counts for the current week, the 2 weeks preceding the current week, and the 2 weeks following the current week, for a total of 5 preceding years. The total sum of incident cases is then divided by 25 weeks. Additional information is available at http://wwwn.cdc.gov/nndss/document/5yearweeklyaverage.pdf.
§ Not reportable in all states. Data from states where the condition is not reportable are excluded from this table except starting in 2007 for the arboviral diseases, STD data, TB data, and influenza-associated pediatric mortality, and in 2003 for SARS-CoV. Reporting exceptions are available at http://wwwn.cdc.gov/nndss/document/SRCA_FINAL_REPORT_2006-2010.xlsx.
¶ Includes both neuroinvasive and nonneuroinvasive. Updated weekly from reports to the Division of Vector-Borne Infectious Diseases, National Center for Zoonotic, Vector-Borne, and Enteric Diseases (ArboNET Surveillance). Data for West Nile virus are available in Table II.
** Data for H. influenzae (all ages, all serotypes) are available in Table II.
†† Updated weekly from reports to the Influenza Division, National Center for Immunization and Respiratory Diseases. Since October 2, 2011, 34 influenza-associated pediatric deaths occurring during the 2011-12 influenza season have been reported.
§§ No measles cases were reported for the current week.
¶¶ Data for meningococcal disease (all serogroups) are available in Table II.
*** CDC discontinued reporting of individual confirmed and probable cases of 2009 pandemic influenza A (H1N1) virus infections on July 24, 2009. During 2009, four cases of human infection with novel influenza A viruses, different from the 2009 pandemic influenza A (H1N1) strain, were reported to CDC. The four cases of novel influenza A virus infection reported to CDC during 2010, the fourteen cases reported during 2011, and 277 cases reported in 2012 are different from the 2009 pandemic influenza A (H1N1) virus. Total case counts are provided by the Influenza Division, National Center for Immunization and Respiratory Diseases (NCIRD).
††† No rubella cases were reported for the current week.
§§§ Updated weekly from reports to the Division of STD Prevention, National Center for HIV/AIDS, Viral Hepatitis, STD, and TB Prevention.
¶¶¶ There were no cases of viral hemorrhagic fever reported during the current week. See Table II for dengue hemorrhagic fever.
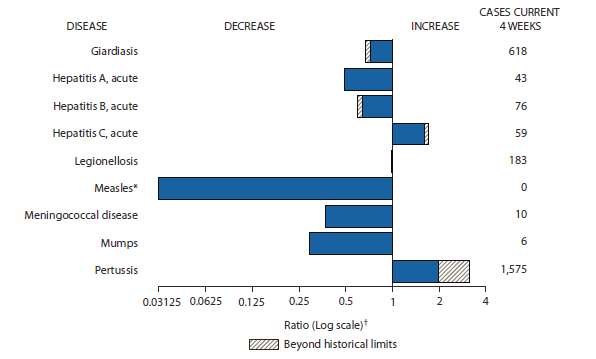
FIGURE I. Selected notifiable disease reports, United States, comparison of provisional 4-week totals August 25, 2012, with historical data
* No measles cases were reported for the current 4-week period yielding a ratio for week 34 of zero (0).
† Ratio of current 4-week total to mean of 15 4-week totals (from previous, comparable, and subsequent 4-week periods for the past 5 years). The point where the hatched area begins is based on the mean and two standard deviations of these 4-week totals.
Alternate Text: The figure above shows selected notifiable disease reports for the United States, with comparison of provisional 4-week totals through August 25, 2012, with historical data. Reports of acute hepatitis C and pertussis both increased beyond historical limits. Reports of giardiasis, acute hepatitis A, acute hepatitis B, legionellosis, measles, meningococcal disease, and mumps all decreased, with giardiasis and acute hepatitis B both decreasing beyond historical limits.
TABLE II. Provisional cases of selected notifiable diseases, United States, weeks ending August 25, 2012, and August 27, 2011 (34th week)*
Reporting area
Chlamydia trachomatis infection
Coccidioidomycosis
Cryptosporidiosis
Current week
Previous 52 weeks
Cum 2012
Cum 2011
Current week
Previous 52 weeks
Cum 2012
Cum 2011
Current week
Previous 52 weeks
Cum 2012
Cum 2011
Med
Max
Med
Max
Med
Max
United States
12,677
26,515
30,645
837,985
910,406
139
403
578
12,241
14,574
100
127
416
4,100
5,874
New England
686
933
1,807
30,343
28,845
1
0
1
2
1
3
6
18
234
295
Connecticut
82
256
1,268
7,717
6,508
N
0
0
N
N
—
1
4
22
57
Maine
—
56
99
1,655
2,079
N
0
0
N
N
—
1
4
45
36
Massachusetts
551
450
726
15,267
14,726
—
0
0
—
—
1
3
8
97
118
New Hampshire
—
62
86
1,927
1,902
1
0
0
1
1
—
1
4
27
51
Rhode Island
—
81
186
2,772
2,683
—
0
1
1
—
—
0
10
7
1
Vermont
53
27
71
1,005
947
N
0
0
N
N
2
1
6
36
32
Mid. Atlantic
2,453
3,528
4,469
114,537
116,150
—
0
1
4
3
15
14
44
426
619
New Jersey
206
541
629
17,951
17,311
N
0
0
N
N
—
0
4
14
37
New York (Upstate)
828
723
2,215
23,720
22,972
N
0
0
N
N
4
4
17
114
126
New York City
408
1,174
1,491
36,979
42,345
N
0
0
N
N
—
1
7
52
55
Pennsylvania
1,011
1,088
1,305
35,887
33,522
—
0
1
4
3
11
7
21
246
401
E.N. Central
1,251
4,051
4,785
125,302
143,646
—
1
4
34
37
24
32
150
1,014
1,560
Illinois
31
1,146
1,494
33,323
42,167
N
0
0
N
N
—
3
8
90
152
Indiana
217
564
825
18,183
18,464
N
0
0
N
N
—
3
10
88
196
Michigan
561
935
1,210
26,865
32,655
—
0
3
18
22
4
7
34
198
219
Ohio
248
1,002
1,180
32,483
34,395
—
0
2
16
15
16
12
95
342
492
Wisconsin
194
466
608
14,448
15,965
—
0
0
—
—
4
8
50
296
501
W.N. Central
137
1,052
1,825
31,285
50,965
—
2
8
89
97
11
17
92
576
1,090
Iowa
43
212
387
7,135
7,108
N
0
0
N
N
1
5
17
211
291
Kansas
36
212
308
7,145
6,759
N
0
0
N
N
—
1
7
25
28
Minnesota
—
322
408
9,297
10,691
—
2
7
78
78
—
0
10
—
223
Missouri
—
0
683
—
18,412
—
0
2
10
13
1
4
60
151
277
Nebraska
47
137
218
4,437
4,203
—
0
1
1
6
9
2
8
93
137
North Dakota
11
50
78
1,641
1,545
N
0
0
N
N
—
0
12
27
15
South Dakota
—
66
93
1,630
2,247
N
0
0
N
N
—
2
5
69
119
S. Atlantic
4,078
5,503
7,543
181,848
185,394
1
0
1
3
4
15
18
55
636
819
Delaware
66
82
182
2,443
2,769
—
0
0
—
—
—
0
4
11
6
District of Columbia
141
135
224
4,484
4,218
—
0
0
—
—
N
0
0
N
N
Florida
1,058
1,507
1,738
51,315
50,470
N
0
0
N
N
9
8
15
283
303
Georgia
876
1,040
1,285
34,062
35,829
N
0
0
N
N
—
3
11
87
213
Maryland
363
459
824
14,891
17,055
1
0
1
3
4
2
1
7
65
51
North Carolina
1,000
968
1,686
31,111
32,591
N
0
0
N
N
—
0
46
58
35
South Carolina
—
510
1,278
17,391
18,175
N
0
0
N
N
2
1
4
37
99
Virginia
499
697
1,780
23,124
21,610
N
0
0
N
N
2
3
6
94
89
West Virginia
75
88
146
3,027
2,677
N
0
0
N
N
—
0
4
1
23
E.S. Central
1,454
2,000
2,820
67,007
64,167
—
0
0
—
—
—
5
26
161
259
Alabama
—
589
796
18,722
19,053
N
0
0
N
N
—
2
5
67
96
Kentucky
793
329
759
11,611
10,326
N
0
0
N
N
—
1
18
19
70
Mississippi
408
421
1,168
15,632
14,487
N
0
0
N
N
—
1
4
26
27
Tennessee
253
637
828
21,042
20,301
N
0
0
N
N
—
1
5
49
66
W.S. Central
405
3,283
4,436
106,624
121,236
—
0
1
—
2
6
10
45
276
355
Arkansas
395
312
412
11,005
10,760
N
0
0
N
N
3
1
4
29
16
Louisiana
—
544
1,231
13,837
18,584
—
0
1
—
2
—
1
6
62
64
Oklahoma
10
106
1,015
2,497
8,655
N
0
0
N
N
3
1
6
58
60
Texas
—
2,413
3,101
79,285
83,237
N
0
0
N
N
—
5
41
127
215
Mountain
700
1,710
2,430
55,242
57,434
124
293
477
9,740
11,164
15
10
31
374
458
Arizona
397
596
873
20,079
18,640
122
290
475
9,597
11,002
—
1
3
20
28
Colorado
—
392
705
10,587
13,632
N
0
0
N
N
—
1
7
48
111
Idaho
25
93
193
2,859
2,810
N
0
0
N
N
12
2
22
120
82
Montana
—
72
99
2,413
2,158
—
0
1
2
3
2
1
5
50
52
Nevada
188
212
285
6,520
7,144
2
2
7
87
65
—
0
2
8
11
New Mexico
63
219
461
7,465
7,101
—
0
7
20
51
1
2
7
67
99
Utah
23
141
191
4,373
4,537
—
1
4
30
40
—
1
5
37
45
Wyoming
4
34
61
946
1,412
—
0
2
4
3
—
0
9
24
30
Pacific
1,513
4,016
5,070
125,797
142,569
13
101
179
2,369
3,266
11
11
23
403
419
Alaska
42
108
152
3,555
3,824
N
0
0
N
N
1
0
3
4
5
California
913
3,070
4,094
94,946
110,984
13
101
179
2,366
3,256
3
6
16
216
224
Hawaii
—
116
147
3,130
3,838
N
0
0
N
N
—
0
1
5
—
Oregon
217
263
368
8,928
8,906
—
0
1
3
10
5
4
10
135
138
Washington
341
460
612
15,238
15,017
—
0
10
—
—
2
1
8
43
52
Territories
American Samoa
—
0
59
59
—
N
0
0
N
N
N
0
0
N
N
C.N.M.I.
—
—
—
—
—
—
—
—
—
—
—
—
—
—
—
Guam
—
21
30
—
708
—
0
0
—
—
—
0
0
—
—
Puerto Rico
99
105
289
3,791
3,671
N
0
0
N
N
N
0
0
N
N
U.S. Virgin Islands
—
14
26
326
548
—
0
0
—
—
—
0
0
—
—
C.N.M.I.: Commonwealth of Northern Mariana Islands.
U: Unavailable. —: No reported cases. N: Not reportable. NN: Not Nationally Notifiable. Cum: Cumulative year-to-date counts. Med: Median. Max: Maximum.
† Data for meningococcal disease, invasive caused by serogroups A, C, Y, and W-135; serogroup B; other serogroup; and unknown serogroup are available in Table I.
TABLE II. (Continued) Provisional cases of selected notifiable diseases, United States, weeks ending August 25, 2012, and August 27, 2011 (34th week)*
Reporting area
Rabies, animal
Salmonellosis
Shiga toxin-producing E. coli (STEC)†
Current week
Previous 52 weeks
Cum 2012
Cum 2011
Current week
Previous 52 weeks
Cum 2012
Cum 2011
Current week
Previous 52 weeks
Cum 2012
Cum 2011
Med
Max
Med
Max
Med
Max
United States
47
66
133
2,078
2,906
776
918
1,692
26,098
31,143
72
99
182
2,855
3,740
New England
7
7
14
250
217
14
39
72
1,267
1,482
—
3
12
124
143
Connecticut
—
3
7
117
128
—
7
15
282
342
—
1
5
32
38
Maine
3
1
6
66
42
9
3
9
108
88
—
0
3
10
22
Massachusetts
—
0
0
—
—
5
18
54
679
743
—
1
7
56
54
New Hampshire
1
0
3
20
16
—
2
7
84
127
—
0
4
14
16
Rhode Island
—
0
6
16
15
—
2
8
60
137
—
0
2
1
4
Vermont
3
1
4
31
16
—
2
8
54
45
—
0
3
11
9
Mid. Atlantic
10
12
36
332
550
59
91
187
2,855
3,748
11
10
28
306
428
New Jersey
—
0
0
—
—
—
16
36
422
828
—
1
8
37
98
New York (Upstate)
10
7
20
288
240
36
25
67
809
857
10
3
12
123
134
New York City
—
0
1
—
10
5
19
41
674
747
—
1
5
46
59
Pennsylvania
—
3
15
44
300
18
28
65
950
1,316
1
3
14
100
137
E.N. Central
6
3
20
115
133
50
80
186
2,810
3,436
11
13
41
404
659
Illinois
4
1
6
54
36
—
27
68
968
1,158
—
2
10
64
158
Indiana
—
0
7
5
24
—
12
36
363
410
—
2
8
64
92
Michigan
—
0
5
31
45
8
16
42
500
539
—
3
10
94
101
Ohio
2
0
7
25
28
42
22
53
851
778
11
3
20
136
111
Wisconsin
N
0
0
N
N
—
5
25
128
551
—
2
22
46
197
W.N. Central
2
3
15
101
121
47
51
113
1,687
1,938
7
16
44
450
654
Iowa
—
0
4
13
19
5
8
30
371
308
—
2
12
95
146
Kansas
2
1
4
46
21
4
9
27
298
271
—
2
8
47
64
Minnesota
—
0
5
—
33
—
0
25
—
496
—
0
13
—
186
Missouri
—
0
3
22
17
30
16
42
689
562
3
5
31
202
150
Nebraska
—
0
3
—
23
8
4
21
205
158
4
1
8
60
76
North Dakota
—
0
13
20
8
—
1
19
31
22
—
0
4
22
4
South Dakota
—
0
0
—
—
—
2
9
93
121
—
1
3
24
28
S. Atlantic
17
19
45
631
800
303
245
643
7,170
8,446
16
11
31
348
394
Delaware
—
0
0
—
—
—
2
8
91
121
—
0
1
8
12
District of Columbia
—
0
0
—
—
—
1
7
23
51
—
0
1
4
3
Florida
—
0
34
67
120
178
110
201
3,192
3,163
11
3
8
149
74
Georgia
—
0
0
—
—
—
24
101
480
1,608
—
1
6
36
82
Maryland
—
5
16
177
219
29
17
45
563
638
1
1
4
42
43
North Carolina
—
0
0
—
—
32
43
230
1,313
1,207
1
1
26
39
83
South Carolina
N
0
0
N
N
37
25
69
771
919
1
0
7
17
12
Virginia
17
11
25
344
398
27
23
57
662
662
2
2
7
50
82
West Virginia
—
1
9
43
63
—
1
52
75
77
—
0
2
3
3
E.S. Central
1
2
6
51
114
24
70
186
2,123
2,472
1
5
14
162
216
Alabama
—
1
5
41
59
—
20
55
563
696
—
1
3
34
61
Kentucky
1
0
2
10
10
—
7
39
222
350
—
1
5
29
44
Mississippi
—
0
0
—
—
6
24
87
697
795
—
0
3
17
24
Tennessee
—
0
2
—
45
18
18
50
641
631
1
2
12
82
87
W.S. Central
3
15
40
459
789
129
145
374
3,623
4,374
2
10
92
327
315
Arkansas
—
0
20
76
40
46
14
58
482
455
—
1
6
35
27
Louisiana
—
0
1
—
3
—
24
50
684
911
—
0
3
18
13
Oklahoma
—
0
21
27
31
23
15
102
430
380
1
2
16
52
39
Texas
3
11
29
356
715
60
77
227
2,027
2,628
1
7
76
222
236
Mountain
1
1
5
47
44
27
42
79
1,326
1,699
10
9
28
305
486
Arizona
N
0
0
N
N
11
15
28
425
533
—
2
6
86
90
Colorado
—
0
0
—
—
—
8
23
272
360
—
2
6
41
112
Idaho
—
0
1
—
3
5
2
7
82
103
9
1
8
57
70
Montana
N
0
0
N
N
8
2
7
78
87
—
0
5
25
28
Nevada
1
0
3
8
6
2
3
12
119
118
1
0
2
15
30
New Mexico
—
0
5
33
9
1
5
13
157
222
—
1
3
27
31
Utah
—
0
2
6
6
—
5
12
152
223
—
1
10
40
111
Wyoming
—
0
3
—
20
—
1
8
41
53
—
0
8
14
14
Pacific
—
3
14
92
138
123
95
179
3,237
3,548
14
15
36
429
445
Alaska
—
0
1
6
11
2
1
5
37
41
—
0
0
—
—
California
—
3
12
78
115
80
65
142
2,279
2,701
2
7
20
206
287
Hawaii
—
0
0
—
—
11
5
58
265
213
1
0
2
9
5
Oregon
—
0
2
8
12
4
6
16
240
249
6
3
11
116
72
Washington
—
0
11
—
—
26
12
42
416
344
5
3
18
98
81
Territories
American Samoa
N
0
0
N
N
—
1
2
4
—
—
0
0
—
—
C.N.M.I.
—
—
—
—
—
—
—
—
—
—
—
—
—
—
—
Guam
—
0
0
—
—
—
0
2
—
16
—
0
0
—
—
Puerto Rico
—
0
5
27
31
1
2
19
32
325
2
0
0
2
—
U.S. Virgin Islands
—
0
0
—
—
—
0
6
—
—
—
0
0
—
—
C.N.M.I.: Commonwealth of Northern Mariana Islands.
U: Unavailable. —: No reported cases. N: Not reportable. NN: Not Nationally Notifiable. Cum: Cumulative year-to-date counts. Med: Median. Max: Maximum.
† Illnesses with similar clinical presentation that result from Spotted fever group rickettsia infections are reported as Spotted fever rickettsioses. Rocky Mountain spotted fever (RMSF) caused by Rickettsia rickettsii, is the most common and well-known spotted fever.
TABLE II. (Continued) Provisional cases of selected notifiable diseases, United States, weeks ending August 25, 2012, and August 27, 2011 (34th week)*
Reporting area
Streptococcus pneumoniae,† invasive disease
Syphilis, primary and secondary
All ages
Age <5
Current week
Previous 52 weeks
Cum 2012
Cum 2011
Current week
Previous 52 weeks
Cum 2012
Cum 2011
Current week
Previous 52 weeks
Cum 2012
Cum 2011
Med
Max
Med
Max
Med
Max
United States
57
275
803
8,499
11,336
3
21
58
575
779
93
269
323
8,517
8,947
New England
—
12
27
402
555
—
1
4
29
32
3
8
23
279
246
Connecticut
—
6
13
200
243
—
0
2
8
7
—
0
13
28
32
Maine
—
2
7
72
88
—
0
1
2
3
—
0
6
13
11
Massachusetts
—
1
4
25
21
—
0
3
14
10
2
6
13
186
153
New Hampshire
—
1
6
50
76
—
0
1
4
5
—
0
2
15
14
Rhode Island
—
0
5
21
75
—
0
1
1
2
—
0
6
33
31
Vermont
—
1
4
34
52
—
0
1
—
5
1
0
2
4
5
Mid. Atlantic
2
43
157
1,307
1,732
—
2
11
59
85
20
33
47
1,077
1,105
New Jersey
—
9
26
258
474
—
0
2
10
32
—
4
8
111
153
New York (Upstate)
1
17
108
606
762
—
1
10
34
31
6
4
12
136
114
New York City
1
13
24
443
496
—
0
3
15
22
3
17
22
520
604
Pennsylvania
N
0
0
N
N
N
0
0
N
N
11
9
17
310
234
E.N. Central
15
61
101
1,819
2,208
—
3
10
115
124
3
29
62
858
1,233
Illinois
N
0
0
N
N
—
0
0
—
—
2
11
54
323
556
Indiana
2
13
33
382
534
—
1
2
17
25
—
3
10
133
119
Michigan
1
12
25
345
482
—
0
3
24
26
1
4
13
118
210
Ohio
10
23
46
799
859
—
1
6
55
59
—
7
15
242
302
Wisconsin
2
9
27
293
333
—
0
2
19
14
—
1
3
42
46
W.N. Central
—
13
58
362
435
—
1
3
29
36
—
3
11
71
223
Iowa
N
0
0
N
N
N
0
0
N
N
—
1
3
31
13
Kansas
N
0
0
N
N
N
0
0
N
N
—
0
4
9
16
Minnesota
—
8
26
243
340
—
1
3
19
29
—
1
4
26
101
Missouri
N
0
0
N
N
—
0
0
—
—
—
0
8
—
87
Nebraska
—
2
8
102
77
—
0
2
9
7
—
0
2
3
6
North Dakota
—
0
38
17
18
—
0
2
1
—
—
0
1
2
—
South Dakota
—
0
0
—
—
—
0
0
—
—
—
0
0
—
—
S. Atlantic
17
58
193
1,938
2,791
1
4
21
134
203
48
65
98
2,111
2,203
Delaware
1
1
5
24
36
—
0
0
—
—
1
0
6
25
13
District of Columbia
—
1
5
39
36
—
0
1
1
5
4
3
9
122
120
Florida
8
20
48
660
953
1
1
8
50
87
5
26
36
838
800
Georgia
—
17
48
460
790
—
1
6
36
48
10
11
59
380
403
Maryland
4
7
22
228
418
—
0
5
20
31
6
7
15
238
299
North Carolina
N
0
0
N
N
N
0
0
N
N
16
6
21
220
284
South Carolina
4
7
16
258
328
—
0
3
14
20
—
4
11
142
140
Virginia
N
0
0
N
N
—
0
0
—
—
6
3
15
143
142
West Virginia
—
5
83
269
230
—
0
8
13
12
—
0
2
3
2
E.S. Central
4
19
50
613
803
—
2
5
35
56
4
15
32
465
523
Alabama
—
0
0
—
—
—
0
0
—
—
—
3
9
110
157
Kentucky
—
4
9
132
158
—
0
1
4
16
4
2
9
88
76
Mississippi
—
0
0
—
—
—
0
0
—
—
—
3
21
108
108
Tennessee
4
15
47
481
645
—
1
4
31
40
—
5
14
159
182
W.S. Central
15
30
188
1,013
1,345
2
3
12
90
127
—
42
53
1,363
1,178
Arkansas
2
3
14
109
152
—
0
3
10
11
—
3
15
112
127
Louisiana
—
4
18
131
158
—
0
2
9
14
—
7
16
177
280
Oklahoma
N
0
0
N
N
—
0
0
—
—
—
1
6
42
46
Texas
13
22
156
773
1,035
2
2
11
71
102
—
28
44
1,032
725
Mountain
3
27
48
958
1,355
—
2
6
71
109
1
10
21
325
414
Arizona
3
12
27
477
599
—
1
3
35
46
—
4
11
116
181
Colorado
—
7
17
238
362
—
0
3
14
25
—
2
6
71
77
Idaho
N
0
0
N
N
—
0
0
—
—
—
0
3
16
4
Montana
—
0
0
—
—
N
0
0
N
N
—
0
1
—
5
Nevada
—
0
0
—
—
—
0
0
—
—
1
2
7
62
89
New Mexico
—
5
14
176
238
—
0
4
12
18
—
1
5
48
49
Utah
—
2
9
45
137
—
0
2
9
20
—
0
2
10
9
Wyoming
—
0
3
22
19
—
0
1
1
—
—
0
1
2
—
Pacific
1
2
8
87
112
—
0
2
13
7
14
59
85
1,968
1,822
Alaska
1
1
8
85
109
—
0
2
13
7
—
0
2
6
1
California
N
0
0
N
N
N
0
0
N
N
9
49
71
1,649
1,536
Hawaii
—
0
1
2
3
—
0
1
—
—
—
0
3
6
9
Oregon
N
0
0
N
N
N
0
0
N
N
4
3
11
131
59
Washington
N
0
0
N
N
N
0
0
N
N
1
6
12
176
217
Territories
American Samoa
N
0
0
N
N
—
0
0
—
—
—
0
0
—
—
C.N.M.I.
—
—
—
—
—
—
—
—
—
—
—
—
—
—
—
Guam
—
0
0
—
—
—
0
0
—
—
—
0
0
—
—
Puerto Rico
—
0
0
—
—
—
0
0
—
—
5
5
15
156
146
U.S. Virgin Islands
—
0
0
—
—
—
0
0
—
—
—
0
0
—
—
C.N.M.I.: Commonwealth of Northern Mariana Islands.
U: Unavailable. —: No reported cases. N: Not reportable. NN: Not Nationally Notifiable. Cum: Cumulative year-to-date counts. Med: Median. Max: Maximum.
† Includes drug resistant and susceptible cases of invasive Streptococcus pneumoniae disease among children <5 years and among all ages. Case definition: Isolation of S. pneumoniae from a normally sterile body site (e.g., blood or cerebrospinal fluid).
TABLE II. (Continued) Provisional cases of selected notifiable diseases, United States, weeks ending August 25, 2012, and August 27, 2011 (34th week)*
Reporting area
Varicella (chickenpox)
West Nile virus disease†
Neuroinvasive
Nonneuroinvasive§
Current week
Previous 52 weeks
Cum 2012
Cum 2011
Current week
Previous 52 weeks
Cum 2012
Cum 2011
Current week
Previous 52 weeks
Cum 2012
Cum 2011
Med
Max
Med
Max
Med
Max
United States
43
287
401
7,662
9,000
5
1
179
889
246
1
0
163
701
124
New England
12
28
49
930
844
—
0
3
7
7
—
0
1
—
—
Connecticut
—
7
12
176
175
—
0
2
3
5
—
0
1
—
—
Maine
5
4
22
182
145
—
0
0
—
—
—
0
0
—
—
Massachusetts
7
12
21
410
321
—
0
2
3
—
—
0
1
—
—
New Hampshire
—
0
10
—
102
—
0
1
1
—
—
0
0
—
—
Rhode Island
—
1
9
61
30
—
0
1
—
1
—
0
0
—
—
Vermont
—
2
13
101
71
—
0
0
—
1
—
0
0
—
—
Mid. Atlantic
4
26
56
815
1,057
—
0
11
20
22
—
0
3
9
17
New Jersey
—
8
25
307
344
—
0
1
2
1
—
0
1
2
4
New York (Upstate)
N
0
0
N
N
—
0
5
5
11
—
0
3
1
11
New York City
—
0
0
—
—
—
0
4
5
8
—
0
1
2
1
Pennsylvania
4
18
35
508
713
—
0
2
8
2
—
0
1
4
1
E.N. Central
13
71
128
1,819
2,118
2
0
30
107
31
—
0
13
41
11
Illinois
3
18
38
506
480
—
0
10
19
8
—
0
5
2
3
Indiana
1
7
21
241
129
—
0
2
3
5
—
0
5
9
1
Michigan
5
19
45
530
619
2
0
15
53
14
—
0
5
18
—
Ohio
4
19
47
541
608
—
0
14
31
3
—
0
5
12
6
Wisconsin
—
0
12
1
282
—
0
1
1
1
—
0
0
—
1
W.N. Central
—
15
35
377
441
—
0
19
78
10
1
0
44
128
12
Iowa
N
0
0
N
N
—
0
2
1
1
—
0
2
4
—
Kansas
—
5
21
85
222
—
0
3
9
—
—
0
4
10
—
Minnesota
—
0
1
—
—
—
0
4
16
—
1
0
8
19
1
Missouri
—
5
23
246
141
—
0
2
3
2
—
0
2
3
2
Nebraska
—
0
3
10
15
—
0
4
8
6
—
0
6
18
6
North Dakota
—
0
29
17
31
—
0
2
5
1
—
0
5
12
3
South Dakota
—
1
6
19
32
—
0
14
36
—
—
0
24
62
—
S. Atlantic
7
33
70
980
1,255
—
0
12
43
45
—
0
8
28
18
Delaware
—
0
2
3
5
—
0
1
—
—
—
0
0
—
—
District of Columbia
—
0
4
12
12
—
0
2
1
7
—
0
1
—
4
Florida
5
16
50
603
577
—
0
4
8
14
—
0
5
11
2
Georgia
—
0
4
18
14
—
0
5
16
11
—
0
3
5
6
Maryland
N
0
0
N
N
—
0
5
7
4
—
0
2
5
6
North Carolina
N
0
0
N
N
—
0
2
3
2
—
0
0
—
—
South Carolina
—
0
2
5
12
—
0
3
5
—
—
0
2
3
—
Virginia
2
11
24
310
339
—
0
2
1
6
—
0
2
4
—
West Virginia
—
0
14
29
296
—
0
1
2
1
—
0
0
—
—
E.S. Central
1
4
14
128
192
1
0
14
67
29
—
0
10
52
12
Alabama
—
4
14
119
181
—
0
2
8
4
—
0
1
5
—
Kentucky
N
0
0
N
N
—
0
2
3
—
—
0
1
—
—
Mississippi
1
0
3
9
11
1
0
11
52
18
—
0
9
46
11
Tennessee
N
0
0
N
N
—
0
3
4
7
—
0
1
1
1
W.S. Central
5
52
213
1,658
1,887
1
0
97
513
19
—
0
88
398
11
Arkansas
—
4
28
119
202
—
0
4
20
1
—
0
1
5
—
Louisiana
—
1
6
31
59
—
0
14
47
3
—
0
7
26
4
Oklahoma
N
0
0
N
N
—
0
15
54
—
—
0
8
26
—
Texas
5
46
204
1,508
1,626
1
0
75
392
15
—
0
78
341
7
Mountain
1
30
61
866
1,109
1
0
11
30
43
—
0
6
24
21
Arizona
1
10
26
284
445
—
0
6
11
32
—
0
4
5
10
Colorado
—
8
32
261
252
—
0
5
12
—
—
0
4
11
4
Idaho
N
0
0
N
N
—
0
1
2
1
—
0
1
2
1
Montana
—
2
7
72
121
—
0
1
—
—
—
0
1
1
—
Nevada
N
0
0
N
N
—
0
4
—
8
—
0
1
—
3
New Mexico
—
2
8
64
37
1
0
1
4
1
—
0
1
2
—
Utah
—
5
20
171
246
—
0
1
—
—
—
0
1
2
2
Wyoming
—
0
2
14
8
—
0
1
1
1
—
0
1
1
1
Pacific
—
3
9
89
97
—
0
18
24
40
—
0
8
21
22
Alaska
—
1
4
44
34
—
0
0
—
—
—
0
0
—
—
California
—
0
4
15
28
—
0
18
24
40
—
0
8
20
22
Hawaii
—
1
3
30
35
—
0
0
—
—
—
0
0
—
—
Oregon
N
0
0
N
N
—
0
0
—
—
—
0
1
1
—
Washington
N
0
0
N
N
—
0
0
—
—
—
0
0
—
—
Territories
American Samoa
N
0
0
N
N
—
0
0
—
—
—
0
0
—
—
C.N.M.I.
—
—
—
—
—
—
—
—
—
—
—
—
—
—
—
Guam
—
3
5
—
50
—
0
0
—
—
—
0
0
—
—
Puerto Rico
—
4
14
70
291
—
0
0
—
—
—
0
0
—
—
U.S. Virgin Islands
—
0
1
—
—
—
0
0
—
—
—
0
0
—
—
C.N.M.I.: Commonwealth of Northern Mariana Islands.
U: Unavailable. —: No reported cases. N: Not reportable. NN: Not Nationally Notifiable. Cum: Cumulative year-to-date counts. Med: Median. Max: Maximum.
† Updated weekly from reports to the Division of Vector-Borne Infectious Diseases, National Center for Zoonotic, Vector-Borne, and Enteric Diseases (ArboNET Surveillance). Data for California serogroup, eastern equine, Powassan, St. Louis, and western equine diseases are available in Table I.
§ Not reportable in all states. Data from states where the condition is not reportable are excluded from this table, except starting in 2007 for the domestic arboviral diseases and influenza-associated pediatric mortality, and in 2003 for SARS-CoV. Reporting exceptions are available at http://wwwn.cdc.gov/nndss/document/SRCA_FINAL_REPORT_2006-2010.xlsx.
TABLE III. Deaths in 122 U.S. cities,* week ending August 25, 2012 (34th week)
Reporting area
All causes, by age (years)
P&I† Total
Reporting area (Continued)
All causes, by age (years)
P&I† Total
All Ages
=65
45–64
25–44
1–24
<1
All Ages
=65
45–64
25–44
1–24
<1
New England
510
338
116
35
11
10
36
S. Atlantic
873
548
221
60
23
21
48
Boston, MA
142
83
38
9
6
6
12
Atlanta, GA
138
92
34
10
2
—
13
Bridgeport, CT
27
20
5
2
—
—
1
Baltimore, MD
153
71
54
20
3
5
6
Cambridge, MA
9
7
2
—
—
—
—
Charlotte, NC
126
85
28
6
4
3
4
Fall River, MA
22
18
2
2
—
—
—
Jacksonville, FL
—
—
—
—
—
—
—
Hartford, CT
55
37
10
5
1
2
2
Miami, FL
111
76
23
6
4
2
2
Lowell, MA
16
11
4
1
—
—
3
Norfolk, VA
39
23
10
2
1
3
—
Lynn, MA
11
7
4
—
—
—
1
Richmond, VA
54
30
17
3
3
1
2
New Bedford, MA
20
17
3
—
—
—
—
Savannah, GA
62
45
11
2
1
3
2
New Haven, CT
17
10
5
2
—
—
1
St. Petersburg, FL
37
29
5
2
1
—
3
Providence, RI
65
44
14
4
2
1
3
Tampa, FL
15
10
5
—
—
—
—
Somerville, MA
3
2
—
1
—
—
—
Washington, D.C.
121
75
29
9
4
4
15
Springfield, MA
24
11
9
3
—
1
2
Wilmington, DE
17
12
5
—
—
—
1
Waterbury, CT
32
23
6
2
1
—
1
E.S. Central
823
513
224
43
9
33
53
Worcester, MA
67
48
14
4
1
—
10
Birmingham, AL
145
89
36
8
1
10
10
Mid. Atlantic
2,129
1,434
504
117
39
35
94
Chattanooga, TN
90
59
25
2
1
3
3
Albany, NY
50
33
15
—
1
1
4
Knoxville, TN
75
51
20
4
—
—
5
Allentown, PA
28
26
2
—
—
—
—
Lexington, KY
72
40
25
6
1
—
1
Buffalo, NY
72
48
15
4
3
2
4
Memphis, TN
187
113
57
9
4
4
18
Camden, NJ
17
10
5
2
—
—
2
Mobile, AL
62
37
16
1
—
8
—
Elizabeth, NJ
9
6
1
1
1
—
—
Montgomery, AL
34
24
8
1
—
1
6
Erie, PA
58
42
12
3
1
—
2
Nashville, TN
158
100
37
12
2
7
10
Jersey City, NJ
16
10
2
3
1
—
1
W.S. Central
1,246
770
317
91
33
35
50
New York City, NY
858
617
185
41
7
8
31
Austin, TX
84
52
24
6
1
1
2
Newark, NJ
57
20
30
3
3
1
—
Baton Rouge, LA
U
U
U
U
U
U
U
Paterson, NJ
18
11
4
2
—
1
—
Corpus Christi, TX
60
42
13
4
1
—
4
Philadelphia, PA
625
379
166
42
17
21
34
Dallas, TX
251
146
64
19
11
11
10
Pittsburgh, PA§
47
42
3
2
—
—
3
El Paso, TX
71
42
12
11
1
5
1
Reading, PA
26
18
8
—
—
—
3
Fort Worth, TX
U
U
U
U
U
U
U
Rochester, NY
64
45
16
1
2
—
5
Houston, TX
369
236
88
28
7
10
12
Schenectady, NY
19
11
3
4
1
—
1
Little Rock, AR
98
55
32
7
3
1
8
Scranton, PA
26
21
4
1
—
—
—
New Orleans, LA
U
U
U
U
U
U
U
Syracuse, NY
96
62
23
8
2
1
4
San Antonio, TX
247
148
69
14
9
7
9
Trenton, NJ
20
14
6
—
—
—
—
Shreveport, LA
13
11
2
—
—
—
2
Utica, NY
13
12
1
—
—
—
—
Tulsa, OK
53
38
13
2
—
—
2
Yonkers, NY
10
7
3
—
—
—
—
Mountain
1,126
777
229
77
26
17
54
E.N. Central
1,997
1,277
500
130
52
38
115
Albuquerque, NM
99
69
16
9
2
3
2
Akron, OH
46
31
10
4
1
—
5
Boise, ID
50
39
7
3
1
—
3
Canton, OH
35
26
8
1
—
—
—
Colorado Springs, CO
81
61
14
5
1
—
3
Chicago, IL
269
159
72
20
10
8
18
Denver, CO
93
66
19
4
3
1
6
Cincinnati, OH
76
50
15
5
4
2
8
Las Vegas, NV
279
190
63
18
5
3
18
Cleveland, OH
290
195
73
13
7
2
21
Ogden, UT
31
20
7
3
—
1
3
Columbus, OH
181
113
46
15
4
3
10
Phoenix, AZ
178
107
42
13
9
7
7
Dayton, OH
154
109
31
6
3
5
8
Pueblo, CO
29
23
5
1
—
—
—
Detroit, MI
148
73
51
13
9
2
6
Salt Lake City, UT
123
85
26
8
3
1
8
Evansville, IN
53
40
9
3
1
—
4
Tucson, AZ
163
117
30
13
2
1
4
Fort Wayne, IN
77
48
21
4
2
2
3
Pacific
1,618
1,114
332
100
39
33
126
Gary, IN
6
3
2
1
—
—
1
Berkeley, CA
12
7
5
—
—
—
—
Grand Rapids, MI
58
37
15
3
1
2
3
Fresno, CA
126
92
22
5
4
3
9
Indianapolis, IN
172
104
45
14
2
7
10
Glendale, CA
38
33
3
2
—
—
5
Lansing, MI
50
35
10
3
—
2
3
Honolulu, HI
83
56
13
9
1
4
9
Milwaukee, WI
89
55
23
8
2
1
4
Long Beach, CA
63
41
16
2
4
—
8
Peoria, IL
46
30
14
2
—
—
2
Los Angeles, CA
250
168
47
17
9
9
30
Rockford, IL
57
38
14
4
1
—
2
Pasadena, CA
19
17
1
1
—
—
2
South Bend, IN
53
38
11
1
3
—
3
Portland, OR
120
79
26
9
3
3
8
Toledo, OH
89
60
20
7
1
1
3
Sacramento, CA
179
118
42
13
3
3
16
Youngstown, OH
48
33
10
3
1
1
1
San Diego, CA
150
112
23
11
2
2
15
W.N. Central
612
386
156
39
20
11
33
San Francisco, CA
124
80
30
10
3
1
6
Des Moines, IA
58
43
12
2
1
—
4
San Jose, CA
165
119
33
4
5
4
5
Duluth, MN
33
28
5
—
—
—
4
Santa Cruz, CA
28
18
6
3
1
—
—
Kansas City, KS
37
21
8
3
2
3
2
Seattle, WA
103
65
28
4
4
2
3
Kansas City, MO
59
37
17
3
—
2
1
Spokane, WA
58
43
10
3
—
2
5
Lincoln, NE
35
27
7
1
—
—
—
Tacoma, WA
100
66
27
7
—
—
5
Minneapolis, MN
62
36
18
3
3
2
5
Total¶
10,934
7,157
2,599
692
252
233
609
Omaha, NE
95
65
22
5
3
—
7
St. Louis, MO
101
33
41
15
9
3
3
St. Paul, MN
47
37
5
3
1
1
3
Wichita, KS
85
59
21
4
1
—
4
U: Unavailable. —: No reported cases.
* Mortality data in this table are voluntarily reported from 122 cities in the United States, most of which have populations of >100,000. A death is reported by the place of its occurrence and by the week that the death certificate was filed. Fetal deaths are not included.
† Pneumonia and influenza.
§ Because of changes in reporting methods in this Pennsylvania city, these numbers are partial counts for the current week. Complete counts will be available in 4 to 6 weeks.