Persons using assistive technology might not be able to fully access information in this file. For assistance, please send e-mail to: mmwrq@cdc.gov. Type 508 Accommodation and the title of the report in the subject line of e-mail.
Household Preparedness for Public Health Emergencies — 14 States, 2006–2010
Please note: An erratum has been published for this article. To view the erratum, please click here.
Populations affected by disaster increase the demand on emergency response and public health systems and on acute care hospitals, often causing disruptions of services (1). Household preparedness measures, such as having a 3-day supply of food, water, and medication and a written household evacuation plan, can improve a population's ability to cope with service disruption, decreasing the number of persons who might otherwise overwhelm emergency services and health-care systems (2).To estimate current levels of self-reported household preparedness by state and sociodemographic characteristics, CDC analyzed Behavioral Risk Factor Surveillance System (BRFSS) survey data collected in 14 states during 2006–2010. The results of this analysis indicated that an estimated 94.8% of households had a working battery-operated flashlight, 89.7% had a 3-day supply of medications for everyone who required them, 82.9% had a 3-day supply of food, 77.7% had a working battery-operated radio, 53.6% had a 3-day supply of water, and 21.1% had a written evacuation plan. Non-English speaking and minority respondents, particularly Hispanics, were less likely to report household preparedness for an emergency or disaster, suggesting that more outreach activities should be directed toward these populations.
BRFSS is a state-based, random-digit–dialed telephone survey of the noninstitutionalized U.S. civilian population aged =18 years.* The survey collects information on health risk behaviors, preventive health practices, health-care access, and disease status. The General Preparedness module was included in BRFSS surveys conducted by 14 states during 2006–2010. Two states, Nebraska and Montana, collected data for multiple years. Comparison of data collected by these two states showed no significant increases or decreases in preparedness measures over time. Therefore, data for Nebraska and Montana were combined across years. Significance of differences between percentages was determined by chi-square test (p<0.05).
During 2006–2010, preparedness data were collected (with Council of American Survey and Research Organizations response rates indicated) from the following states: 2006, Connecticut (44.3%), Montana (54.8%), Nevada (50.1%), and Tennessee (56.7%); 2007, Delaware (43.2%), Louisiana (41.0%), Maryland (31.4%), Nebraska (65.4%), and New Hampshire (37.7%); 2008, Georgia (55.1%), Montana (48.3%), Nebraska (65.5%), New York (40.0%), and Pennsylvania (45.6%); 2009, Mississippi (49.3%); and 2010, Montana (65.4%) and North Carolina (41.1%).
Household disaster preparedness measures, as defined by the BRFSS questionnaire, included the following items: having 3-day supplies of food, prescription medications, and water, a written evacuation plan, a working battery-powered radio, and a working battery-powered flashlight. Respondents were asked the following six questions: 1) "Does your household have a 3-day supply of nonperishable food for everyone who lives there? By nonperishable we mean food that does not require refrigeration or cooking." 2) "Does your household have a 3-day supply of water for everyone who lives there? A 3-day supply of water is 1 gallon of water per person per day." 3) "Does your household have a 3-day supply of prescription medications for each person in your household who takes prescription medications?" 4) "Does your household have a working battery-operated radio and working batteries for use if the electricity is out?" 5) "Does your household have a working flashlight and working batteries for use if the electricity is out?" 6) "Does your household have a written evacuation plan for how you will leave your home in case of a large-scale disaster or emergency that requires evacuation?"
Overall, an estimated 94.8% of households had a working battery-operated flashlight, 89.7% had a 3-day supply of medications for everyone who required them, 82.9% had a 3-day supply of food, 77.7% had a working battery-operated radio, 53.6% had a 3-day supply of water, and 21.1% had a written evacuation plan (Table 1). With the exception of having a 3-day supply of medication and a written evacuation plan, which were not significantly different by sex, men were significantly more likely than women to report their households were prepared. Significant differences ranged from 1.6 percentage points (95.6% compared with 94.0%) for having a working, battery-powered flashlight to 6.9 percentage points (57.2% compared with 50.3%) for having a 3-day supply of water (Table 1). By race/ethnicity, Hispanics were significantly less likely than all other race/ethnicities to have a 3-day supply of food (75.0%), a 3-day supply of medication (69.0%), and a working battery-operated radio (67.1%), and flashlight (84.4%). In general, as the age of respondents increased, reported household preparedness increased. With the exceptions of having a 3-day supply of water and a written evacuation plan, persons with a high school diploma were more likely to indicate preparedness than those with less than a high school diploma. With the exception of having a written evacuation plan, which was most prevalent among respondents who were unable to work, in general, retired respondents were most likely to indicate that their household was prepared.
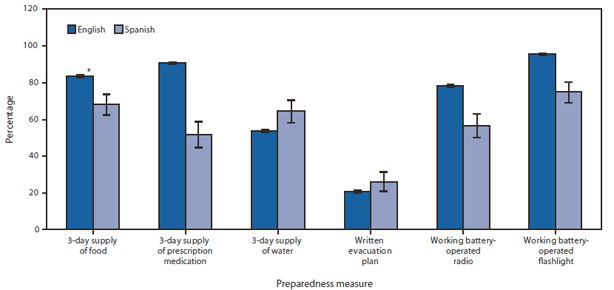
Respondents who requested that the survey be conducted in Spanish (68.2%) were less likely to report their households had a 3-day supply of food than those administered the survey in English (83.2%) (Figure). A similar pattern was observed for having a 3-day supply of medication (Spanish, 51.7%; English, 90.6%), a working battery-operated radio (Spanish, 56.5%; English, 78.1%), and a working battery-operated flashlight (Spanish, 74.7%; English, 95.2%). However, respondents who requested the survey be conducted in Spanish were significantly more likely to report their households had a 3-day supply of water (Spanish, 64.5%; English, 53.6%) and were as likely as those interviewed in English to report that the household had a written evacuation plan (Spanish, 25.6%; English, 20.6%; p=0.066).
By state, Montana respondents were most likely (88.1%) and Nevada respondents were least likely (78.5%) to report their household had a 3-day supply of food (Table 2). Pennsylvania respondents were most likely (93.7%) and Nevada respondents were least likely (80.7%) to report a 3-day supply of medication. Louisiana respondents were most likely (67.1%) and Nebraska respondents were least likely (45.5%) to report a 3-day supply of water. Louisiana respondents were most likely (54.0%) and Pennsylvania respondents were least likely (15.0%) to have a written evacuation plan. Louisiana respondents were most likely (85.2%) and Nevada respondents were least likely (72.3%) to report a working battery-powered radio. New Hampshire respondents were most likely (97.2%) and New York respondents were least likely (93.4%) to report a working battery-powered flashlight.
Reported by
Summer D. DeBastiani MPH, Tara W Strine, PhD, Office of Public Health Preparedness and Response, CDC. Corresponding contributor: Summer D. DeBastiani, sdebastiani@cdc.gov, 404-639-3101.
Editorial Note
Similar to previous studies, the findings in this report generally indicate increased levels of disaster and emergency preparedness among men, English-speaking persons, and adults with more education (3,4). Also similar to previous research, this analysis indicates limited evacuation planning among households (3,4). With the notable exception of Louisiana, where in 2007, 2 years after devastating Hurricane Katrina, 54.0% of respondents said they had a written evacuation plan, no state reported a prevalence as high as 35%. Therefore, increased efforts encouraging the adoption of a written household evacuation plan are needed.
Beginning in 2003, the federal government launched two preparedness campaigns for the purpose of increasing household preparedness: Ready.gov and the Citizen Corps (5,6). Both campaigns encourage the general population to prepare for disasters by being informed, assembling an emergency kit, and having a plan (Box). Ready.gov is an Internet-based disaster preparedness initiative, and the Citizen Corps encourages government and community leaders to involve the general population in all-hazards emergency preparedness activities (5,6). The primary method to access preparedness materials and information through these organizations is via predominantly English language websites, creating a possible barrier for non-English speaking adults, persons of low socioeconomic status, and those without Internet access. An increased effort to make household preparedness materials and information more accessible, particularly by those with resource and language barriers, is needed.
The findings in this report are subject to at least five limitations. First, during 2006–2010, BRFSS sampled only households with a landline telephone, thus excluding homes with only cellular telephones. Second, responses were dependent on the participant's understanding of preparedness measures taken in the household; for example, some respondents might not have known that the household had a 3-day supply of food, water, and medications. In addition, respondents were not required to present any evidence that a preparedness measure (e.g., 3-day supply of water or a working flashlight) had been met. Third, the response rates were low; only approximately one of every two persons contacted agreed to participate in the survey. Fourth, several of the questions failed to account for all types of preparedness technology (e.g., hand-cranked flashlights). Finally, the General Preparedness module was only implemented in 14 states during 2006–2010, with only a few states using the module in any given year; therefore, the findings are not generalizable to the U.S. population.
Since the 2001 terrorist attacks, the federal government has increased its emphasis on emergency preparedness, including the response and recovery capabilities of emergency management agencies, hospitals, and public health systems (7). CDC uses preparedness metrics to assess systems, with the findings disseminated to states and used to inform Healthy People 2020 objectives. Outcomes associated with individual household preparedness activities, however, are not similarly assessed or shared (3,8). To help improve household disaster preparedness in the general population and to inform national and state preparedness planning and policy, systematically measured, generalizable state-based household preparedness data are needed (9).
References
Hick JL, Hanfling D, Burstein JL, et al. Health care facility and community strategies for patient care surge capacity. Ann Emerg Med2004;44:253–61.
Paton D, Johnston DM. Disaster resilience: an integrated approach. Springfield, IL: Charles C. Thomas; 2006:105–6.
Ablah E, Konda K, Kelley CL. Factors predicting individual emergency preparedness: a multi-state analysis of the 2006 BRFSS data. Biosecur Bioterror 2009;7:317–30.
Murphy ST, Cody M, Frank LB, Glik D, Ang A. Predictors of emergency preparedness and compliance. Disaster Med Public Health Prep 2009;7:S1–8.
Federal Emergency Management Agency. Ready. Washington, DC: Federal Emergency Management Agency; 2012. Available at http://www.ready.gov. Accessed September 7, 2012.
Federal Emergency Management Agency. Citizen Corps. Washington, DC: Federal Emergency Management Agency; 2012. Available at http://citizencorps.gov. Accessed September 7, 2012.
CDC. Public health preparedness capabilities: national standards for state and local planning. Atlanta, GA: US Department of Health and Human Services, CDC; 2011. Available at http://www.cdc.gov/phpr/capabilities. Accessed September 7, 2012.
Household preparedness measures, such as having a 3-day supply of food, water, and medications and a written household evacuation plan, can improve a population's ability to cope with disasters and emergencies, decreasing the number of persons who might otherwise strain emergency and health-care services.
What is added by this report?
Results from Behavioral Risk Factor Surveillance System surveys of household preparedness in 14 states during 2006–2010 indicated that an estimated 94.8% of households had a working battery-operated flashlight, 89.7% had a 3-day supply of medications for everyone who required them, 82.9% had a 3-day supply of food, 77.7% had a working battery-operated radio, 53.6% had a 3-day supply of water, and only 21.1% of U.S. residents had a written evacuation plan.
What are the implications for public health practice?
Greater effort is needed to stress the importance of disaster and emergency preparedness, especially the need for a written evacuation plan. Public health and emergency services agencies should increase the accessibility of household preparedness materials and information to the Hispanic population and persons with resource and language barriers.
BOX. Recommendations to prepare a household for emergency or disaster — Federal Emergency Management Agency, 2012
Be informed
Knowing about the local emergency plans for shelter and evacuation and local emergency contacts will help you develop your household plan and also will aid you during a crisis.
Make a kit
A disaster supplies kit is simply a collection of basic items your household might need in the event of an emergency.
Water, 1 gallon of water per person per day for at least 3 days, for drinking and sanitation.
Food, at least a 3-day supply of nonperishable food.
At least a 3-day supply of medications for each person who takes prescription medications.
Battery-powered or hand crank radio and a National Oceanic Atmospheric Administration weather radio with tone alert and extra batteries for both.
Flashlight and extra batteries.
Have a plan
Emergency planning should address the care of pets, aiding family members with access and functional needs and safely shutting off utilities. Practice your plan at least twice a year and update it according to any issues that arise.
Source: Federal Emergency Management Agency. Ready. Washington, DC: Federal Emergency Management Agency; 2012. Available at http://www.ready.gov.
FIGURE. Percentage of participants reporting household disaster or emergency preparedness, by preparedness measure and language used in the interview — Behavioral Risk Factor Surveillance System, 14 states, 2006–2010
* 95% confidence interval.
Alternate Text: The figure above shows the percentage of participants reporting household disaster or emergency preparedness, by preparedness measure and language (English or Spanish) used in the interview, in 14 states during 2006-2010. Respondents surveyed in Spanish were less likely (68.2%) to report their households had a 3-day supply of food than those administered the survey in English (83.2%). A similar pattern was observed for having a 3-day supply of medication and working battery-operated radio and flashlight. However, respondents surveyed in Spanish were significantly more likely to report a 3-day supply of water (Spanish, 64.5%; English, 53.6%), and there was no significant difference, by language, in the proportion reporting that the household had a written evacuation plan.
TABLE 1. Percentage of participants reporting household disaster or emergency preparedness, by preparedness measures and sociodemographic characteristics — Behavioral Risk Factor Surveillance System, 14 states, 2006–2010
Characteristic
Have a 3-day supply of food
Have a 3-day supply of medication
Have a 3-day supply of water
No. in sample
Weighted no.
%
(95% CI)
No. in sample
Weighted no.
%
(95% CI)
No. in sample
Weighted no.
%
(95% CI)
Overall
83,965
49,939,735
82.9
(82.4–83.5)
80,351
47,083,817
89.7
(89.2–90.1)
55,323
32,222,914
53.6
(52.9–54.3)
Sex
Men
31,975
24,297,666
84.2
(83.3–85.0)
29,855
22,484,121
90.2
(89.4–90.9)
22,374
16,514,103
57.2
(56.1–58.3)
Women
51,990
25,642,069
81.8
(81.1–82.5)
50,496
24,599,696
89.2
(88.6–89.8)
32,949
15,708,811
50.3
(49.4–51.1)
Race/Ethnicity*
White
79,764
38,059,253
84.8
(84.2–85.4)
67,007
36,730,925
92.8
(92.4–93.2)
44,179
23,349,524
52.1
(51.3–52.9)
Black
7,889
6,322,382
77.9
(76.1–79.5)
7,423
5,726,674
82.6
(81.0–84.2)
6,078
4,733,017
58.2
(56.3–60.2)
Hispanic
2,262
2,744,511
75.0
(71.6–78.1)
1,849
2,060,575
69.0
(65.1–72.7)
1,715
2,025,186
55.0
(51.4–58.7)
Other race/Multirace
3,753
2,365,541
78.7
(75.5–81.6)
3,378
2,159,139
84.9
(81.7–87.6)
2,789
1,780,008
60.4
(57.0–63.7)
Age group (yrs)
18–24
2,576
4,683,190
79.7
(77.1–82.1)
2,102
3,918,690
79.8
(76.9–82.4)
1,689
3,088,207
53.1
(50.0–56.3)
25–34
7,241
8,345,572
77.8
(76.1–79.5)
5,871
7,000,146
83.7
(82.0–85.3)
4,294
5,202,686
48.4
(46.5–50.4)
35–44
12,053
10,274,805
80.8
(79.5–82.1)
10,610
9,310,066
87.7
(86.5–88.9)
7,251
6,166,027
48.6
(47.0–50.2)
45–54
16,863
9,621,520
83.5
(82.5–84.5)
15,961
9,248,143
90.5
(89.6–91.3)
10,821
6,093,993
52.9
(51.6–54.3)
=55
44,575
16,673,720
87.9
(87.4–88.5)
45,192
17,268,658
95.8
(95.4–96.1)
30,764
11,402,504
60.2
(59.4–61.1)
Education
Less than a high school diploma
7,910
4,316,121
80.0
(78.0–81.8)
7,632
3,831,918
79.3
(77.0–81.3)
6,013
3,199,648
59.7
(57.4–61.9)
High school diploma
26,255
15,048,742
83.8
(82.8–84.7)
25,123
13,965,053
88.3
(87.3–89.1)
17,666
10,206,329
57.0
(55.7–58.2)
More than a high school diploma
49,670
30,516,047
83.0
(82.3–83.7)
47,472
29,231,941
92.0
(91.4–92.5)
31,535
18,764,811
51.0
(50.2–51.9)
Employment status
Currently employed
43,599
30,335,878
82.4
(81.7–83.2)
39,696
27,434,623
88.7
(88.0–89.4)
27,586
18,994,551
51.7
(50.7–52.6)
Unemployed
3,409
2,686,613
78.5
(75.4–81.2)
3,135
2,500,045
84.9
(82.1–87.3)
2,346
1,834,715
53.5
(50.2–56.8)
Retired
23,643
8,673,886
89.2
(88.4–89.9)
24,209
9,107,235
96.5
(96.1–96.9)
16,496
6,092,790
62.9
(61.7–64.0)
Unable to work
5,568
2,619,215
78.4
(76.2–80.5)
6,106
2,895,877
89.2
(87.4–90.7)
4,028
1,852,808
55.7
(53.2–58.3)
Housewife/Student
7,551
5,528,482
81.5
(79.7–83.1)
7,020
5,051,584
86.5
(84.8–88.1)
4,720
3,376,956
49.9
(47.7–52.1)
Marital status
Currently married
48,066
30,831,168
84.3
(83.7–85.0)
46,635
29,645,628
91.7
(91.1–92.2)
30,395
19,343,368
52.9
(52.1–53.8)
Previously married†
25,166
8,731,801
83.0
(82.0–84.0)
24,297
8,419,916
90.1
(89.2–90.9)
17,555
5,930,648
56.6
(55.3–57.8)
Never married§
10,469
10,227,723
78.9
(77.4–80.4)
9,193
8,875,935
83.3
(81.7–84.7)
7,178
6,825,329
52.9
(51.0–54.7)
Interview language
English
82,140
47,896,583
83.2
(82.7–83.8)
78,730
45,313,761
90.6
(90.1–91.1)
54,047
30,767,692
53.6
(52.9–54.3)
Spanish
552
666,986
68.2
(62.1–73.7)
348
432,069
51.7
(44.6–58.6)
514
627,984
64.5
(58.2–70.2)
Children in household
Yes
23,462
20,454,775
80.9
(80.0–81.9)
20,767
18,129,679
86.7
(85.7–87.6)
13,764
12,200,949
48.4
(47.2–49.6)
No
60,392
29,425,652
84.4
(83.8–85.1)
59,498
28,905,485
91.7
(91.1–92.2)
41,481
19,981,656
57.4
(56.6–58.2)
TABLE 1. (Continued) Percentage of participants reporting household disaster or emergency preparedness, by preparedness measures and sociodemographic characteristics — Behavioral Risk Factor Surveillance System, 14 states, 2006–2010
Characteristic
Have a written evacuation plan
Have a working battery-operated radio
Have a working battery-operated flashlight
No. in sample
Weighted no.
%
(95% CI)
No. in sample
Weighted no.
%
(95% CI)
No. in sample
Weighted no.
%
(95% CI)
Overall
22,522
12,661,492
21.1
(20.6–21.7)
74,331
46,538,951
77.7
(77.2–78.3)
93,831
57,256,195
94.8
(94.4–95.1)
Sex
Men
8,385
6,051,319
21.0
(20.2–21.9)
28,986
22,906,709
79.6
(78.6–80.5)
35,529
27,730,509
95.6
(95.1–96.1)
Women
14,137
6,610,173
21.3
(20.6–21.9)
45,345
23,632,242
76.1
(75.3–76.8)
58,302
29,525,687
94.0
(93.6–94.4)
Race/Ethnicity*
White
17,498
8,761,404
19.6
(19.0–20.2)
61,565
35,783,853
80.4
(79.8–81.0)
77,536
43,646,594
97.0
(96.7–97.2)
Black
2,620
2,103,974
26.2
(24.7–27.9)
6,931
5,878,861
72.4
(70.5–74.1)
8,703
7,232,129
89.1
(87.8–90.2)
Hispanic
907
980,547
26.8
(23.9–29.9)
2,005
2,465,690
67.1
(63.5–70.4)
2,559
3,116,057
84.4
(81.5–86.9)
Other race/Multirace
1,272
706,156
23.9
(21.3–26.7)
3,195
2,021,506
67.3
(63.7–70.8)
4,206
2,747,172
90.8
(88.4–92.8)
Age group (yrs)
18–24
694
1,038,145
17.9
(15.9–20.1)
2,389
4,401,518
75.6
(72.8–78.2)
2,940
5,408,379
92.0
(90.2–93.5)
25–34
1,896
1,959,055
18.3
(17.0–19.8)
6,667
7,937,548
74.2
(72.4–75.9)
8,450
9,962,729
92.7
(91.6–93.6)
35–44
3,235
2,660,066
21.0
(19.7–22.3)
11,455
9,925,954
78.4
(77.0–79.8)
13,920
12,025,987
94.3
(93.5–95.1)
45–54
4,453
2,471,297
21.5
(20.5–22.6)
15,444
9,077,234
79.5
(78.4–80.5)
19,108
11,047,242
95.8
(95.2–96.3)
=55
12,036
4,419,004
23.5
(22.8–24.2)
37,769
14,866,044
78.8
(78.1–79.5)
48,663
18,405,331
96.5
(96.1–96.8)
Education
Less than a high school diploma
2,502
1,408,864
26.7
(24.8–28.6)
6,414
3,651,230
67.8
(65.6–70.0)
8,677
4,761,831
88.3
(86.6–89.8)
High school diploma
7,757
4,415,355
24.8
(23.8–25.8)
23,338
14,060,524
78.6
(77.5–79.6)
29,233
17,045,577
94.5
(94.0–95.1)
More than a high school diploma
12,219
6,813,722
18.6
(17.9–19.2)
44,467
28,769,462
78.8
(78.1–79.5)
55,771
35,376,690
95.8
(95.4–96.2)
Employment status
Currently employed
10,867
7,144,636
19.5
(18.8–20.2)
39,991
28,909,540
79.0
(78.2–79.7)
49,522
35,152,226
95.3
(94.9–95.7)
Unemployed
958
742,373
22.0
(19.5–24.8)
3,025
2,452,521
72.5
(69.3–75.4)
3,865
3,146,645
91.9
(89.9–93.5)
Retired
6,688
2,457,513
25.6
(24.6–26.6)
19,787
7,642,923
79.0
(78.1–79.9)
25,535
9,457,148
96.6
(96.2–97.0)
Unable to work
1,891
904,303
27.5
(25.4–29.8)
4,640
2,280,968
68.7
(66.2–71.1)
6,169
2,952,544
88.4
(86.6–90.0)
Housewife/ Student
2,048
1,372,799
20.2
(18.7–21.9)
6,721
5,162,344
76.5
(74.5–78.4)
8,518
6,430,010
94.1
(93.0–95.0)
Marital status
Currently married
12,082
7,572,189
20.7
(20.1–21.4)
44,388
29,358,964
80.8
(80.1–81.5)
53,879
35,453,676
96.7
(96.3–97.0)
Previously married†
7,499
2,614,001
25.1
(24.1–26.2)
20,383
7,540,051
71.9
(70.8–73.0)
27,707
9,762,064
92.4
(91.7–93.1)
Never married§
2,855
2,434,013
19.0
(17.7–20.3)
9,334
9,492,166
73.8
(72.1–75.4)
11,941
11,863,771
91.3
(90.3–92.3)
Interview language
English
21,689
11,819,518
20.6
(20.1–21.2)
72,706
44,672,616
78.1
(77.5–78.7)
91,753
54,940,267
95.2
(94.8–95.5)
Spanish
251
249,308
25.6
(20.7–31.2)
451
555,298
56.5
(50.0–62.7)
615
735,069
74.7
(68.7–79.9)
Children in household
Yes
6,540
5,239,598
20.8
(20.0–21.8)
22,172
19,678,184
78.2
(77.2–79.2)
26,937
23,878,858
94.3
(93.7–94.8)
No
15,934
7,392,433
21.3
(20.7–21.9)
52,054
26,797,544
77.4
(76.7–78.1)
66,771
33,299,418
95.1
(94.7–95.5)
Abbreviation: CI = confidence interval.
* Persons identified as Hispanic might be of any race. Persons identified as white, black, or other race/multirace are all non-Hispanic. The four racial/ethnic categories are mutually exclusive.
† Includes divorced, widowed, and separated persons.
§ Includes never married persons and members of unmarried couples.
TABLE 2. Percentage of participants reporting household disaster or emergency preparedness, by preparedness measures and state — Behavioral Risk Factor Surveillance System, 14 states, 2006–2010
State
Year
Have a 3-day supply of food
Have a 3-day supply of medication
Have a 3-day supply of water
No. in sample
Weighted no.
%
(95% CI)
No. in sample
Weighted no.
%
(95% CI)
No. in sample
Weighted no.
%
(95% CI)
Overall
83,965
49,939,735
82.9
(82.4–83.5)
80,351
47,083,817
89.7
(89.2–90.1)
55,323
32,222,914
53.6
(52.9–54.3)
Connecticut
2006
3,483
1,953,333
80.7
(78.1–82.3)
3,430
1,897,278
88.5
(87.0–89.8)
2,289
1,250,486
51.6
(49.7–53.6)
Delaware
2007
3,402
559,508
85.6
(83.9–87.1)
3,232
519,317
91.5
(90.0–92.8)
2,374
393,933
60.2
(58.0–62.4)
Georgia
2008
4,686
5,704,548
83.8
(82.1–85.3)
4,552
5,326,005
91.0
(89.7–92.2)
2,952
3,548,334
52.2
(50.2–54.2)
Louisiana
2007
5,263
2,503,903
84.7
(83.4–86.0)
4,840
2,225,833
85.2
(83.8–86.4)
4,180
1,986,970
67.1†
(65.5–68.8)
Maryland
2007
3,377
3,081,163
79.7
(77.7–81.5)
3,393
2,971,525
86.3
(84.2–88.1)
2,309
2,141,650
55.1
(52.9–57.3)
Mississippi
2009
8,780
1,665,142
83.3
(82.2–84.4)
8,829
1,602,641
90.8
(89.7–91.7)
6,051
1,129,593
56.6
(55.1–58.0)
Montana
2006
2008
2010
16,737
1,827,338
88.1†
(87.4–88.8)
15,185
1,620,819
91.1
(90.4–91.9)
10,896
1,133,622
54.7
(53.6–55.8)
Nebraska
2007
2008
8,736
2,082,276
83.8
(82.1–85.4)
8,398
1,957,109
91.0
(89.5–92.3)
4,745
1,130,401
45.5*
(43.5–47.6)
Nevada
2006
2,772
1,300,038
78.5*
(76.1–80.7)
2,559
1,170,845
80.7*
(78.1–83.1)
2,102
1,041,549
63.0
(60.4–65.5)
New Hampshire
2007
4,615
776,298
81.7
(80.3–82.9)
4,540
752,438
90.8
(89.6–91.9)
3,122
5,167,704
54.2
(52.6–55.9)
New York
2008
3,032
11,086,539
79.8
(78.0–81.4)
3,040
10,742,654
89.6
(87.9–91.0)
1,953
6,979,891
50.4
(48.4–52.5)
North Carolina
2010
10,227
5,869,875
84.7
(84.5–86.8)
9,803
5,367,481
91.4
(90.3–92.4)
6,707
3,866,292
56.7
(55.2–58.1)
Pennsylvania
2008
5,435
7,995,514
86.1
(84.7–87.5)
5,246
7,614,674
93.7†
(92.5–94.8)
3,579
4,947,353
53.4
(51.5–55.4)
Tennessee
2006
3,420
3,534,261
82.0
(80.2–83.6)
3,304
3,315,199
84.4
(82.5–86.2)
2,064
2,156,136
50.0
(47.7–52.3)
TABLE 2. (Continued) Percentage of participants reporting household disaster or emergency preparedness, by preparedness measures and state — Behavioral Risk Factor Surveillance System, 14 states, 2006–2010
State
Year
Have a written evacuation plan
Have a working battery-operated radio
Have a working battery-operated flashlight
No. in sample
Weighted no.
%
(95% CI)
No. in sample
Weighted no.
%
(95% CI)
No. in sample
Weighted no.
%
(95% CI)
Overall
22,522
12,661,492
21.1
(20.6–21.7)
74,331
46,538,951
77.7
(77.2–78.3)
93,831
57,256,195
94.8
(94.4–95.1)
Connecticut
2006
967
544,187
22.4
(20.8–24.1)
3,338
1,915,855
79.2
(77.6–80.8)
4,121
2,328,965
95.5
(94.6–96.2)
Delaware
2007
947
148,878
22.8
(20.8–25.0)
3,062
514,735
79.0
(77.1–80.7)
3,771
627,163
95.7
(94.7–96.6)
Georgia
2008
957
1,082,355
16.0
(14.7–17.5)
4,027
5,088,753
75.1
(73.3–76.8)
5,172
6,461,497
94.6
(93.6–95.4)
Louisiana
2007
3,224
1,585,357
54.0†
(52.3–55.7)
5,191
2,513,071
85.2†
(83.9–86.4)
5,882
2,836,825
95.4
(94.6–96.1)
Maryland
2007
1,136
1,031,932
26.9
(25.0–28.8)
3,207
3,050,542
79.7
(77.7–81.5)
3,910
3,668,318
94.9
(93.6–95.9)
Mississippi
2009
1,901
357,999
18.0
(16.9–19.3)
7,842
1,568,763
78.7
(77.6–79.9)
9,946
1,896,225
94.7
(94.1–95.3)
Montana
2006
2008
2010
3,776
397,797
19.2
(18.4–20.1)
13,284
1,522,456
74.2
(73.3–75.2)
18,177
2,004,263
96.4
(96.0–96.8)
Nebraska
2007
2008
2,231
519,381
21.0
(19.4–22.7)
8,197
2,043,232
82.6
(81.0–84.1)
9,793
2,404,766
96.5
(95.7–97.2)
Nevada
2006
1,029
473,114
28.6
(26.4–30.9)
2,479
1,191,252
72.3*
(69.7–74.7)
3,148
1,505,890
90.5
(88.3–92.2)
New Hampshire
2007
1,252
196,826
20.7
(19.5–22.1)
4,318
751,036
79.4
(78.1–80.7)
5,446
926,119
97.2†
(96.5–97.7)
New York
2008
669
2,272,831
16.5
(15.1–18.0)
2,828
10,608,454
76.7
(74.9–78.4)
3,514
3,059,551
93.4*
(92.3–94.4)
North Carolina
2010
1,883
1,171,601
17.2
(16.1–18.5)
8,692
5,251,368
77.2
(76.0–78.5)
11,153
6,543,028
95.2
(94.5–95.8)
Pennsylvania
2008
1,081
1,392,433
15.0*
(13.7–16.4)
4,720
7,159,537
77.7
(76.0–79.3)
6,017
8,976,868
96.3
(95.5–97.0)
Tennessee
2006
1,469
1,486,798
34.6
(32.5–36.8)
3,146
3,359,894
78.5
(76.6–80.3)
3,881
4,016,717
93.8
(92.5–94.9)
Abbreviation:CI = confidence interval.
* Lowest percentage for preparedness measure among the 14 states.
† Highest percentage for preparedness measure among the 14 states.