Persons using assistive technology might not be able to fully access information in this file. For assistance, please send e-mail to: mmwrq@cdc.gov. Type 508 Accommodation and the title of the report in the subject line of e-mail.
Notifiable Diseases and Mortality Tables
Table I Summary of provisional cases of selected notifiable diseases, United States, cumulative, week ending November 17, 2012 (46th Week)
Figure I Selected notifiable disease reports, United States, comparison of provisional 4-week totals ending November 17, 2012, with historical data
Table II Provisional cases of selected notifiable diseases, United States, weeks ending November 17, 2012 and November 19, 2011 (46th Week)
Table III Deaths in 122 U.S. cities, week ending November 17, 2012 (46th Week)
TABLE I. Provisional cases of infrequently reported notifiable diseases (<1,000 cases reported during the preceding year) — United States, week ending November 17, 2012 (46th week)*
TABLE I. (Continued) Provisional cases of infrequently reported notifiable diseases (<1,000 cases reported during the preceding year) — United States, week ending November 17, 2012 (46th week)*
—: No reported cases. N: Not reportable. NN: Not Nationally Notifiable. Cum: Cumulative year-to-date counts.
† Calculated by summing the incidence counts for the current week, the 2 weeks preceding the current week, and the 2 weeks following the current week, for a total of 5 preceding years. The total sum of incident cases is then divided by 25 weeks. Additional information is available at http://wwwn.cdc.gov/nndss/document/5yearweeklyaverage.pdf.
§ Not reportable in all states. Data from states where the condition is not reportable are excluded from this table except starting in 2007 for the arboviral diseases, STD data, TB data, and influenza-associated pediatric mortality, and in 2003 for SARS-CoV. Reporting exceptions are available at http://wwwn.cdc.gov/nndss/document/SRCA_FINAL_REPORT_2006-2010.xlsx.
¶ Includes both neuroinvasive and nonneuroinvasive. Updated weekly from reports to the Division of Vector-Borne Infectious Diseases, National Center for Zoonotic, Vector-Borne, and Enteric Diseases (ArboNET Surveillance). Data for West Nile virus are available in Table II.
** Data for H. influenzae (all ages, all serotypes) are available in Table II.
†† Updated weekly from reports to the Influenza Division, National Center for Immunization and Respiratory Diseases. Since September 30, 2012, two influenza-associated pediatric deaths occurring during the 2012-13 influenza season have been reported.
§§ No measles cases were reported for the current week.
¶¶ Data for meningococcal disease (all serogroups) are available in Table II.
*** CDC discontinued reporting of individual confirmed and probable cases of 2009 pandemic influenza A (H1N1) virus infections on July 24, 2009. During 2009, four cases of human infection with novel influenza A viruses, different from the 2009 pandemic influenza A (H1N1) strain, were reported to CDC. The four cases of novel influenza A virus infection reported to CDC during 2010, the fourteen cases reported during 2011, and the 311 cases reported in 2012 are different from the 2009 pandemic influenza A (H1N1) virus. Total case counts are provided by the Influenza Division, National Center for Immunization and Respiratory Diseases (NCIRD).
††† No rubella cases were reported for the current week.
§§§ Updated weekly from reports to the Division of STD Prevention, National Center for HIV/AIDS, Viral Hepatitis, STD, and TB Prevention.
¶¶¶ There were no cases of viral hemorrhagic fever reported during the current week. See Table II for dengue hemorrhagic fever.
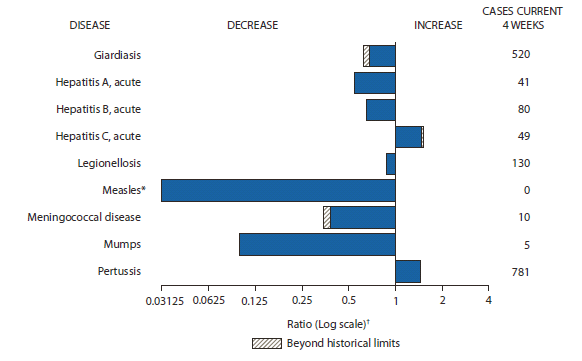
FIGURE I. Selected notifiable disease reports, United States, comparison of provisional 4-week totals November 17, 2012, with historical data
* No measles cases were reported for the current 4-week period yielding a ratio for week 46 of zero (0).
† Ratio of current 4-week total to mean of 15 4-week totals (from previous, comparable, and subsequent 4-week periods for the past 5 years). The point where the hatched area begins is based on the mean and two standard deviations of these 4-week totals.
Alternate Text: The figure above shows selected notifiable disease reports for the United States, with comparison of provisional 4-week totals through November 17, 2012, with historical data. Reports of acute hepatitis C, and pertussis increased, with acute hepatitis C increasing beyond historical limits. Reports of giardiasis, acute hepatitis A, acute hepatitis B, legionellosis, measles, meningococcal disease, and mumps all decreased, with giardiasis and meningococcal disease decreasing beyond historical limits.
TABLE II. Provisional cases of selected notifiable diseases, United States, weeks ending November 17, 2012, and November 19, 2011 (46th week)*
Reporting area
Chlamydia trachomatis infection
Coccidioidomycosis
Cryptosporidiosis
Current week
Previous 52 weeks
Cum 2012
Cum 2011
Current week
Previous 52 weeks
Cum 2012
Cum 2011
Current week
Previous 52 weeks
Cum 2012
Cum 2011
Med
Max
Med
Max
Med
Max
United States
10,999
27,022
30,645
1,184,061
1,251,103
191
367
582
15,374
19,987
53
126
278
6,323
8,530
New England
433
973
1,807
41,902
40,507
—
0
1
2
2
—
7
19
338
386
Connecticut
—
256
1,268
11,002
10,340
N
0
0
N
N
—
1
3
32
68
Maine
—
61
101
2,602
2,731
N
0
0
N
N
—
1
4
61
45
Massachusetts
424
447
706
20,574
19,826
—
0
0
—
—
—
2
8
127
155
New Hampshire
8
61
85
2,655
2,671
—
0
1
1
1
—
1
4
39
62
Rhode Island
—
84
186
3,703
3,616
—
0
1
1
1
—
0
3
12
11
Vermont
1
28
87
1,366
1,323
N
0
0
N
N
—
1
6
67
45
Mid. Atlantic
1,857
3,509
4,469
154,309
159,881
—
0
1
4
5
7
14
41
685
821
New Jersey
—
541
640
23,155
23,689
N
0
0
N
N
—
0
4
23
50
New York (Upstate)
629
722
2,215
32,685
31,650
N
0
0
N
N
1
4
19
208
202
New York City
400
1,136
1,427
49,505
58,199
N
0
0
N
N
1
2
8
94
81
Pennsylvania
828
1,095
1,343
48,964
46,343
—
0
1
4
5
5
7
21
360
488
E.N. Central
741
4,119
4,785
176,391
196,844
—
1
4
46
45
9
32
106
1,564
2,512
Illinois
40
1,110
1,506
47,958
57,963
N
0
0
N
N
—
3
8
137
201
Indiana
—
550
838
24,737
25,409
N
0
0
N
N
—
2
7
122
252
Michigan
484
932
1,210
37,919
44,517
—
0
3
27
28
1
6
40
301
319
Ohio
217
1,041
1,175
45,460
46,989
—
0
2
19
17
8
11
28
521
1,044
Wisconsin
—
468
559
20,317
21,966
—
0
0
—
—
—
8
40
483
696
W.N. Central
24
1,561
1,808
68,128
70,193
—
2
8
117
119
—
16
41
814
1,491
Iowa
8
215
387
9,728
9,718
N
0
0
N
N
—
5
21
293
347
Kansas
16
213
309
9,757
9,350
N
0
0
N
N
—
1
4
48
42
Minnesota
—
314
388
13,205
15,093
—
2
7
103
96
—
0
10
—
291
Missouri
—
548
683
24,428
24,905
—
0
2
13
16
—
4
11
213
478
Nebraska
—
127
181
5,409
5,905
—
0
1
1
7
—
2
10
127
165
North Dakota
—
52
72
2,292
2,176
N
0
0
N
N
—
0
5
33
27
South Dakota
—
70
106
3,309
3,046
N
0
0
N
N
—
2
6
100
141
S. Atlantic
3,571
5,429
7,543
244,884
257,210
—
0
1
5
5
14
19
57
984
1,060
Delaware
133
80
182
3,501
3,884
—
0
0
—
—
—
0
4
14
7
District of Columbia
—
138
224
5,925
5,813
—
0
0
—
—
N
0
0
N
N
Florida
708
1,537
1,738
68,842
67,898
N
0
0
N
N
11
8
24
417
396
Georgia
826
1,008
1,285
44,298
48,070
N
0
0
N
N
3
4
13
223
290
Maryland
—
437
1,103
20,645
23,531
—
0
1
5
5
—
1
7
77
64
North Carolina
1,214
917
1,678
41,725
48,480
N
0
0
N
N
—
0
46
86
35
South Carolina
—
533
1,278
24,636
24,701
N
0
0
N
N
—
1
4
41
121
Virginia
631
691
1,780
31,142
31,070
N
0
0
N
N
—
3
6
124
120
West Virginia
59
88
149
4,170
3,763
N
0
0
N
N
—
0
4
2
27
E.S. Central
1,684
1,993
2,820
92,902
87,459
—
0
0
—
—
1
5
14
246
424
Alabama
591
592
862
27,582
26,371
N
0
0
N
N
—
2
6
93
124
Kentucky
384
334
787
15,808
14,437
N
0
0
N
N
—
1
4
49
173
Mississippi
475
415
1,168
21,007
18,856
N
0
0
N
N
—
1
4
38
45
Tennessee
234
633
828
28,505
27,795
N
0
0
N
N
1
1
5
66
82
W.S. Central
4
3,244
4,336
143,171
166,077
—
0
1
3
3
11
9
24
438
642
Arkansas
—
329
412
14,544
14,409
N
0
0
N
N
1
1
5
37
30
Louisiana
—
430
1,316
18,215
27,025
—
0
1
3
3
—
2
7
113
82
Oklahoma
4
83
1,015
3,675
12,078
N
0
0
N
N
1
2
6
82
79
Texas
—
2,403
2,977
106,737
112,565
N
0
0
N
N
9
5
17
206
451
Mountain
734
1,785
2,430
79,646
80,093
177
277
478
12,003
14,786
7
11
40
680
605
Arizona
144
589
872
26,924
25,995
177
273
476
11,831
14,563
2
1
3
35
42
Colorado
406
424
705
19,312
19,356
N
0
0
N
N
—
1
7
56
138
Idaho
—
84
174
3,505
4,042
N
0
0
N
N
5
3
24
242
106
Montana
—
73
107
3,281
2,990
—
0
1
2
5
—
1
4
56
74
Nevada
—
212
318
8,727
9,451
—
2
7
99
89
—
0
2
9
17
New Mexico
168
211
463
10,012
10,050
—
0
4
23
69
—
1
7
87
125
Utah
5
146
177
6,412
6,299
—
1
4
44
57
—
2
19
166
59
Wyoming
11
36
60
1,473
1,910
—
0
2
4
3
—
0
4
29
44
Pacific
1,951
4,100
4,692
182,728
192,839
14
74
144
3,194
5,022
4
12
25
574
589
Alaska
34
105
150
4,750
5,206
N
0
0
N
N
—
0
1
5
12
California
1,362
3,164
3,735
141,150
149,437
14
73
144
3,191
5,011
2
6
15
303
318
Hawaii
—
97
147
3,130
5,362
N
0
0
N
N
—
0
1
5
—
Oregon
260
266
368
12,302
12,221
—
0
1
3
11
1
4
11
196
186
Washington
295
464
612
21,396
20,613
—
0
10
—
—
1
1
8
65
73
Territories
American Samoa
—
0
59
59
—
N
0
0
N
N
N
0
0
N
N
C.N.M.I.
—
—
—
—
—
—
—
—
—
—
—
—
—
—
—
Guam
—
21
22
—
944
—
0
0
—
—
—
0
0
—
—
Puerto Rico
215
106
289
5,160
4,919
N
0
0
N
N
N
0
0
N
N
U.S. Virgin Islands
—
13
26
326
742
—
0
0
—
—
—
0
0
—
—
C.N.M.I.: Commonwealth of Northern Mariana Islands.
U: Unavailable. —: No reported cases. N: Not reportable. NN: Not Nationally Notifiable. Cum: Cumulative year-to-date counts. Med: Median. Max: Maximum.
TABLE II. (Continued) Provisional cases of selected notifiable diseases, United States, weeks ending November 17, 2012, and November 19, 2011 (46th week)*
Reporting area
Dengue Virus Infection
Dengue Fever†
Dengue Hemorrhagic Fever§
Current week
Previous 52 weeks
Cum 2012
Cum 2011
Current week
Previous 52 weeks
Cum 2012
Cum 2011
Med
Max
Med
Max
United States
—
4
23
268
234
—
0
1
1
3
New England
—
0
3
12
3
—
0
0
—
—
Connecticut
—
0
3
11
1
—
0
0
—
—
Maine
—
0
0
—
—
—
0
0
—
—
Massachusetts
—
0
0
—
—
—
0
0
—
—
New Hampshire
—
0
0
—
—
—
0
0
—
—
Rhode Island
—
0
0
—
—
—
0
0
—
—
Vermont
—
0
1
1
2
—
0
0
—
—
Mid. Atlantic
—
1
6
43
66
—
0
0
—
—
New Jersey
—
0
0
—
—
—
0
0
—
—
New York (Upstate)
—
0
0
—
8
—
0
0
—
—
New York City
—
0
6
28
42
—
0
0
—
—
Pennsylvania
—
0
2
15
16
—
0
0
—
—
E.N. Central
—
1
3
35
19
—
0
1
1
2
Illinois
—
0
2
14
5
—
0
1
1
2
Indiana
—
0
1
3
2
—
0
0
—
—
Michigan
—
0
1
4
6
—
0
0
—
—
Ohio
—
0
1
6
2
—
0
0
—
—
Wisconsin
—
0
1
8
4
—
0
0
—
—
W.N. Central
—
0
2
7
13
—
0
0
—
—
Iowa
—
0
1
2
5
—
0
0
—
—
Kansas
—
0
0
—
1
—
0
0
—
—
Minnesota
—
0
1
—
6
—
0
0
—
—
Missouri
—
0
1
4
—
—
0
0
—
—
Nebraska
—
0
0
—
—
—
0
0
—
—
North Dakota
—
0
0
—
1
—
0
0
—
—
South Dakota
—
0
1
1
—
—
0
0
—
—
S. Atlantic
—
1
12
111
84
—
0
0
—
1
Delaware
—
0
0
—
2
—
0
0
—
—
District of Columbia
—
0
0
—
—
—
0
0
—
—
Florida
—
1
9
86
60
—
0
0
—
—
Georgia
—
0
2
8
5
—
0
0
—
—
Maryland
—
0
1
2
5
—
0
0
—
—
North Carolina
—
0
1
5
4
—
0
0
—
—
South Carolina
—
0
1
2
1
—
0
0
—
—
Virginia
—
0
2
8
7
—
0
0
—
1
West Virginia
—
0
0
—
—
—
0
0
—
—
E.S. Central
—
0
2
8
11
—
0
0
—
—
Alabama
—
0
1
3
4
—
0
0
—
—
Kentucky
—
0
1
1
4
—
0
0
—
—
Mississippi
—
0
1
1
—
—
0
0
—
—
Tennessee
—
0
2
3
3
—
0
0
—
—
W.S. Central
—
0
1
6
10
—
0
0
—
—
Arkansas
—
0
0
—
—
—
0
0
—
—
Louisiana
—
0
0
—
3
—
0
0
—
—
Oklahoma
—
0
0
—
—
—
0
0
—
—
Texas
—
0
1
6
7
—
0
0
—
—
Mountain
—
0
1
6
5
—
0
0
—
—
Arizona
—
0
1
1
1
—
0
0
—
—
Colorado
—
0
0
—
—
—
0
0
—
—
Idaho
—
0
1
1
—
—
0
0
—
—
Montana
—
0
1
2
—
—
0
0
—
—
Nevada
—
0
1
2
1
—
0
0
—
—
New Mexico
—
0
0
—
2
—
0
0
—
—
Utah
—
0
0
—
1
—
0
0
—
—
Wyoming
—
0
0
—
—
—
0
0
—
—
Pacific
—
0
5
40
23
—
0
0
—
—
Alaska
—
0
0
—
—
—
0
0
—
—
California
—
0
4
25
5
—
0
0
—
—
Hawaii
—
0
2
4
10
—
0
0
—
—
Oregon
—
0
0
—
—
—
0
0
—
—
Washington
—
0
2
11
8
—
0
0
—
—
Territories
American Samoa
—
0
0
—
—
—
0
0
—
—
C.N.M.I.
—
—
—
—
—
—
—
—
—
—
Guam
—
0
0
—
—
—
0
0
—
—
Puerto Rico
—
29
272
3,107
1,353
—
0
3
25
28
U.S. Virgin Islands
—
0
0
—
—
—
0
0
—
—
C.N.M.I.: Commonwealth of Northern Mariana Islands.
U: Unavailable. —: No reported cases. N: Not reportable. NN: Not Nationally Notifiable. Cum: Cumulative year-to-date counts. Med: Median. Max: Maximum.
† Dengue Fever includes cases that meet criteria for Dengue Fever with hemorrhage, other clinical and unknown case classifications.
§ DHF includes cases that meet criteria for dengue shock syndrome (DSS), a more severe form of DHF.
TABLE II. (Continued) Provisional cases of selected notifiable diseases, United States, weeks ending November 17, 2012, and November 19, 2011 (46th week)*
Reporting area
Ehrlichiosis/Anaplasmosis†
Ehrlichia chaffeensis
Anaplasma phagocytophilum
Undetermined
Current week
Previous 52 weeks
Cum 2012
Cum 2011
Current week
Previous 52 weeks
Cum 2012
Cum 2011
Current week
Previous 52 weeks
Cum 2012
Cum 2011
Med
Max
Med
Max
Med
Max
United States
3
12
66
848
757
7
15
64
672
2,363
1
2
13
124
137
New England
—
0
2
20
3
—
5
19
256
414
—
0
1
1
1
Connecticut
—
0
0
—
—
—
1
10
90
146
—
0
0
—
—
Maine
—
0
2
4
1
—
1
4
44
16
—
0
0
—
—
Massachusetts
—
0
0
—
—
—
0
3
—
168
—
0
0
—
—
New Hampshire
—
0
1
2
1
—
1
5
46
20
—
0
0
—
1
Rhode Island
—
0
2
14
1
—
1
11
66
59
—
0
1
1
—
Vermont
—
0
0
—
—
—
0
2
10
5
—
0
0
—
—
Mid. Atlantic
3
0
6
37
103
6
6
44
291
374
—
0
2
12
20
New Jersey
—
0
1
—
57
—
0
7
—
104
—
0
0
—
7
New York (Upstate)
3
0
3
19
40
6
5
41
259
231
—
0
2
12
7
New York City
—
0
3
18
4
—
0
4
32
33
—
0
0
—
—
Pennsylvania
—
0
1
—
2
—
0
0
—
6
—
0
1
—
6
E.N. Central
—
0
4
39
42
—
0
11
11
689
1
1
8
76
56
Illinois
—
0
4
36
25
—
0
1
9
11
—
0
1
1
—
Indiana
—
0
0
—
—
—
0
0
—
—
1
0
7
68
18
Michigan
—
0
0
—
4
—
0
0
—
—
—
0
1
5
5
Ohio
—
0
1
3
6
—
0
1
1
7
—
0
1
1
1
Wisconsin
—
0
1
—
7
—
0
10
1
671
—
0
1
1
32
W.N. Central
—
2
33
267
175
—
0
9
37
793
—
0
4
14
24
Iowa
N
0
0
N
N
N
0
0
N
N
N
0
0
N
N
Kansas
—
0
4
32
17
—
0
2
8
5
—
0
0
—
1
Minnesota
—
0
0
—
7
—
0
9
—
759
—
0
0
—
10
Missouri
—
1
32
235
149
—
0
4
27
25
—
0
4
13
13
Nebraska
—
0
0
—
1
—
0
1
2
1
—
0
1
—
—
North Dakota
—
0
0
—
—
—
0
3
—
—
—
0
0
—
—
South Dakota
—
0
0
—
1
—
0
0
—
3
—
0
1
1
—
S. Atlantic
—
5
30
294
246
1
1
8
46
63
—
0
2
7
14
Delaware
—
0
2
15
15
—
0
1
1
1
—
0
0
—
—
District of Columbia
N
0
0
N
N
N
0
0
N
N
N
0
0
N
N
Florida
—
0
3
20
15
—
0
1
3
9
—
0
0
—
—
Georgia
—
0
4
14
22
—
0
1
2
11
—
0
0
—
3
Maryland
—
0
4
31
32
1
0
2
5
6
—
0
0
—
—
North Carolina
—
0
19
97
64
—
0
6
20
19
—
0
0
—
1
South Carolina
—
0
1
1
2
—
0
0
—
—
—
0
0
—
1
Virginia
—
1
16
116
95
—
0
2
14
17
—
0
2
6
8
West Virginia
—
0
0
—
1
—
0
1
1
—
—
0
1
1
1
E.S. Central
—
1
9
94
77
—
0
3
22
15
—
0
2
11
14
Alabama
—
0
2
11
5
—
0
3
10
4
—
0
1
5
—
Kentucky
—
0
4
25
15
—
0
1
1
—
—
0
0
—
—
Mississippi
—
0
1
1
3
—
0
1
1
1
—
0
1
1
—
Tennessee
—
0
6
57
54
—
0
1
10
10
—
0
2
5
14
W.S. Central
—
1
52
97
111
—
0
11
9
9
—
0
1
1
1
Arkansas
—
0
11
78
51
—
0
2
6
6
—
0
0
—
—
Louisiana
—
0
1
1
—
—
0
0
—
1
—
0
1
1
1
Oklahoma
—
0
51
15
57
—
0
7
2
2
—
0
0
—
—
Texas
—
0
1
3
3
—
0
2
1
—
—
0
0
—
—
Mountain
—
0
0
—
—
—
0
0
—
1
—
0
1
1
5
Arizona
—
0
0
—
—
—
0
0
—
—
—
0
1
1
4
Colorado
N
0
0
N
N
N
0
0
N
N
N
0
0
N
N
Idaho
N
0
0
N
N
N
0
0
N
N
N
0
0
N
N
Montana
N
0
0
N
N
N
0
0
N
N
N
0
0
N
N
Nevada
—
0
0
—
—
—
0
0
—
—
—
0
0
—
—
New Mexico
N
0
0
N
N
N
0
0
N
N
N
0
0
N
N
Utah
—
0
0
—
—
—
0
0
—
—
—
0
0
—
1
Wyoming
—
0
0
—
—
—
0
0
—
1
—
0
0
—
—
Pacific
—
0
1
—
—
—
0
1
—
5
—
0
1
1
2
Alaska
N
0
0
N
N
N
0
0
N
N
N
0
0
N
N
California
—
0
0
—
—
—
0
0
—
—
—
0
1
1
2
Hawaii
N
0
0
N
N
N
0
0
N
N
N
0
0
N
N
Oregon
—
0
0
—
—
—
0
1
—
5
—
0
0
—
—
Washington
—
0
1
—
—
—
0
0
—
—
—
0
0
—
—
Territories
American Samoa
N
0
0
N
N
N
0
0
N
N
N
0
0
N
N
C.N.M.I.
—
—
—
—
—
—
—
—
—
—
—
—
—
—
—
Guam
N
0
0
N
N
N
0
0
N
N
N
0
0
N
N
Puerto Rico
N
0
0
N
N
N
0
0
N
N
N
0
0
N
N
U.S. Virgin Islands
—
0
0
—
—
—
0
0
—
—
—
0
0
—
—
C.N.M.I.: Commonwealth of Northern Mariana Islands.
U: Unavailable. —: No reported cases. N: Not reportable. NN: Not Nationally Notifiable. Cum: Cumulative year-to-date counts. Med: Median. Max: Maximum.
† Cumulative total E. ewingii cases reported for year 2011 = 13, and 12 cases reported for 2012.
TABLE II. (Continued) Provisional cases of selected notifiable diseases, United States, weeks ending November 17, 2012, and November 19, 2011 (46th week)*
Reporting area
Giardiasis
Gonorrhea
Haemophilus influenzae, invasive† All ages, all serotypes
Current week
Previous 52 weeks
Cum 2012
Cum 2011
Current week
Previous 52 weeks
Cum 2012
Cum 2011
Current week
Previous 52 weeks
Cum 2012
Cum 2011
Med
Max
Med
Max
Med
Max
United States
123
246
495
11,628
14,940
2,773
6,221
7,030
275,980
283,881
24
63
151
2,735
2,986
New England
4
24
51
1,126
1,461
98
113
238
5,055
4,797
—
3
15
168
204
Connecticut
—
3
9
184
212
—
42
161
1,766
2,050
—
1
5
49
52
Maine
2
2
10
148
162
—
8
18
344
220
—
0
2
17
24
Massachusetts
—
12
26
532
684
97
48
99
2,329
2,081
—
2
8
86
98
New Hampshire
—
2
6
84
122
1
3
8
118
110
—
0
2
2
13
Rhode Island
—
0
10
37
69
—
9
35
418
293
—
0
2
7
11
Vermont
2
3
9
141
212
—
1
6
80
43
—
0
1
7
6
Mid. Atlantic
33
46
80
2,165
2,969
505
861
1,091
38,488
36,434
7
14
32
583
643
New Jersey
—
0
10
75
406
—
147
199
6,369
6,577
—
2
7
75
104
New York (Upstate)
11
16
51
770
983
139
146
440
6,634
5,112
4
3
19
146
159
New York City
14
16
26
766
841
111
268
348
11,744
12,790
1
3
9
153
159
Pennsylvania
8
12
22
554
739
255
301
398
13,741
11,955
2
4
16
209
221
E.N. Central
19
42
65
1,845
2,383
284
1,047
1,292
46,267
51,883
2
9
26
414
545
Illinois
—
6
14
281
369
10
284
372
12,139
15,209
—
2
7
116
162
Indiana
—
4
8
182
297
—
135
201
6,108
5,995
—
2
6
76
94
Michigan
—
10
20
443
486
199
242
369
9,975
11,497
1
1
4
61
62
Ohio
19
11
30
546
711
75
312
394
13,940
14,936
1
3
7
132
144
Wisconsin
—
8
22
393
520
—
91
149
4,105
4,246
—
0
5
29
83
W.N. Central
1
21
40
923
1,609
10
334
430
14,722
14,527
—
5
9
206
189
Iowa
1
5
11
226
249
2
35
87
1,684
1,736
—
0
1
—
2
Kansas
—
2
6
96
124
8
43
76
1,979
1,918
—
0
3
24
19
Minnesota
—
0
13
—
610
—
48
87
2,186
2,021
—
1
5
71
61
Missouri
—
6
13
285
318
—
155
204
6,957
6,921
—
1
6
74
70
Nebraska
—
3
11
149
166
—
26
43
1,135
1,175
—
0
3
22
26
North Dakota
—
1
15
49
36
—
5
9
223
226
—
0
3
15
10
South Dakota
—
2
9
118
106
—
12
25
558
530
—
0
0
—
1
S. Atlantic
22
46
102
2,019
2,414
906
1,386
1,960
62,549
69,417
5
15
39
670
657
Delaware
—
0
2
21
30
25
16
35
744
719
—
0
2
6
4
District of Columbia
—
1
5
42
49
—
45
117
2,067
2,244
—
0
1
2
—
Florida
15
21
49
961
1,090
191
376
475
17,191
17,600
3
4
11
196
202
Georgia
3
8
26
440
607
228
286
426
12,694
14,434
2
2
8
134
116
Maryland
2
5
10
216
247
—
100
225
4,457
5,536
—
2
6
78
82
North Carolina
N
0
0
N
N
323
269
507
11,727
15,511
—
1
9
86
73
South Carolina
—
2
6
91
108
—
149
391
6,822
7,116
—
1
5
52
71
Virginia
2
5
18
222
246
130
135
353
6,130
5,542
—
2
7
79
91
West Virginia
—
0
17
26
37
9
14
32
717
715
—
1
14
37
18
E.S. Central
1
3
12
138
157
453
546
816
26,348
23,968
3
4
12
169
193
Alabama
1
3
12
138
157
197
181
255
8,255
8,072
—
1
4
47
49
Kentucky
N
0
0
N
N
83
82
215
3,903
3,962
—
0
3
29
38
Mississippi
N
0
0
N
N
130
120
323
6,218
5,167
—
0
3
18
17
Tennessee
N
0
0
N
N
43
170
257
7,972
6,767
3
1
8
75
89
W.S. Central
2
5
16
260
317
—
838
1,132
37,214
43,426
3
3
14
157
134
Arkansas
2
2
6
87
110
—
83
123
3,790
4,246
—
0
2
24
32
Louisiana
—
3
10
173
207
—
138
404
5,848
7,765
—
1
4
41
46
Oklahoma
—
0
0
—
—
—
21
162
934
3,644
3
2
13
90
54
Texas
N
0
0
N
N
—
600
709
26,642
27,771
—
0
1
2
2
Mountain
4
21
44
951
1,210
135
249
323
11,395
9,967
3
5
17
233
256
Arizona
—
2
5
99
124
62
112
159
5,078
3,947
1
1
6
85
84
Colorado
—
7
19
281
406
65
53
78
2,454
2,110
—
1
5
39
56
Idaho
4
3
10
129
159
—
2
11
101
133
2
0
2
17
19
Montana
—
1
4
46
77
—
2
5
81
74
—
0
2
5
3
Nevada
—
1
5
73
72
—
41
77
1,772
1,788
—
0
2
16
17
New Mexico
—
1
7
68
102
8
34
61
1,508
1,635
—
1
5
40
40
Utah
—
4
15
225
234
—
8
18
371
239
—
0
4
28
35
Wyoming
—
1
2
30
36
—
0
4
30
41
—
0
1
3
2
Pacific
37
47
185
2,201
2,420
382
733
857
33,942
29,462
1
3
8
135
165
Alaska
2
2
6
85
94
7
13
26
591
906
1
0
2
14
25
California
19
29
58
1,395
1,553
298
628
734
28,968
24,243
—
1
5
40
39
Hawaii
—
0
3
27
36
—
10
20
363
613
—
0
2
19
28
Oregon
3
7
15
322
387
20
29
43
1,266
1,296
—
1
6
62
66
Washington
13
7
146
372
350
57
60
98
2,754
2,404
—
0
1
—
7
Territories
American Samoa
—
0
0
—
—
—
0
0
—
—
—
0
0
—
—
C.N.M.I.
—
—
—
—
—
—
—
—
—
—
—
—
—
—
—
Guam
—
0
0
—
—
—
0
3
—
90
—
0
0
—
—
Puerto Rico
—
0
3
2
76
11
7
25
293
291
—
0
0
—
—
U.S. Virgin Islands
—
0
0
—
—
—
2
8
56
128
—
0
0
—
—
C.N.M.I.: Commonwealth of Northern Mariana Islands.
U: Unavailable. —: No reported cases. N: Not reportable. NN: Not Nationally Notifiable. Cum: Cumulative year-to-date counts. Med: Median. Max: Maximum.
† Data for H. influenzae (age <5 yrs for serotype b, nonserotype b, and unknown serotype) are available in Table I.
TABLE II. (Continued) Provisional cases of selected notifiable diseases, United States, weeks ending November 17, 2012, and November 19, 2011 (46th week)*
Reporting area
Hepatitis (viral, acute), by type
A
B
C
Current week
Previous 52 weeks
Cum 2012
Cum 2011
Current week
Previous 52 weeks
Cum 2012
Cum 2011
Current week
Previous 52 weeks
Cum 2012
Cum 2011
Med
Max
Med
Max
Med
Max
United States
17
26
58
1,216
1,202
17
52
131
2,255
2,504
8
29
65
1,308
1,056
New England
—
1
7
66
70
—
1
6
75
88
—
1
5
60
81
Connecticut
—
0
2
22
17
—
0
2
15
15
—
1
4
33
45
Maine
—
0
2
10
5
—
0
2
8
8
—
0
3
4
10
Massachusetts
—
0
3
26
36
—
1
3
42
62
—
0
2
17
21
New Hampshire
—
0
1
5
—
—
0
2
8
3
N
0
0
N
N
Rhode Island
—
0
1
1
6
U
0
0
U
U
U
0
0
U
U
Vermont
—
0
1
2
6
—
0
1
2
—
—
0
2
6
5
Mid. Atlantic
3
4
10
178
227
2
4
9
197
262
2
3
9
150
119
New Jersey
—
0
2
25
74
—
1
4
51
64
—
0
4
31
49
New York (Upstate)
1
1
4
61
41
1
1
3
41
44
1
1
5
66
35
New York City
1
1
3
41
60
—
1
5
53
75
—
0
2
7
7
Pennsylvania
1
1
5
51
52
1
1
4
52
79
1
1
4
46
28
E.N. Central
2
4
9
180
180
4
7
16
352
321
—
4
10
193
133
Illinois
—
1
5
58
58
—
1
5
63
77
—
0
3
21
6
Indiana
—
0
2
7
18
—
1
6
70
64
—
1
6
71
79
Michigan
—
1
6
69
62
—
1
5
50
77
—
2
5
81
27
Ohio
2
1
2
29
35
4
3
9
156
87
—
0
2
8
6
Wisconsin
—
0
1
17
7
—
0
3
13
16
—
0
2
12
15
W.N. Central
—
1
18
53
38
—
2
12
76
100
—
0
15
23
17
Iowa
—
0
1
3
8
—
0
2
9
12
—
0
0
—
—
Kansas
—
0
2
12
4
—
0
1
7
11
—
0
2
12
5
Minnesota
—
0
18
—
9
—
0
11
—
9
—
0
15
—
2
Missouri
—
0
3
20
10
—
1
3
53
55
—
0
2
7
8
Nebraska
—
0
3
16
5
—
0
1
7
12
—
0
1
1
2
North Dakota
—
0
1
2
—
—
0
0
—
—
—
0
0
—
—
South Dakota
—
0
0
—
2
—
0
1
—
1
—
0
2
3
—
S. Atlantic
4
5
11
234
192
4
14
47
596
647
3
7
15
328
246
Delaware
1
0
1
4
2
—
0
2
11
13
U
0
0
U
U
District of Columbia
—
0
0
—
—
—
0
0
—
—
—
0
0
—
—
Florida
3
2
7
74
70
2
4
11
206
183
2
2
5
94
52
Georgia
—
1
4
45
27
—
2
5
73
127
—
1
5
53
48
Maryland
—
0
3
25
24
—
1
6
44
53
—
1
3
32
33
North Carolina
—
0
4
29
25
1
1
5
66
100
—
1
6
52
50
South Carolina
—
0
2
5
10
—
0
3
30
32
—
0
1
1
1
Virginia
—
1
3
45
27
1
2
6
72
63
1
1
6
49
19
West Virginia
—
0
2
7
7
—
1
29
94
76
—
1
5
47
43
E.S. Central
1
1
5
64
45
2
10
21
449
463
—
6
12
257
217
Alabama
—
0
2
15
7
1
1
5
63
106
—
0
2
19
17
Kentucky
—
0
3
19
10
—
3
10
129
137
—
3
9
134
125
Mississippi
1
0
2
8
7
—
2
4
68
51
U
0
0
U
U
Tennessee
—
0
2
22
21
1
4
10
189
169
—
2
6
104
75
W.S. Central
1
3
13
144
124
3
5
37
281
340
1
2
12
106
77
Arkansas
—
0
2
8
2
—
1
3
59
51
—
0
1
2
—
Louisiana
—
0
2
5
5
—
1
4
36
49
—
0
1
4
6
Oklahoma
—
0
8
9
3
1
0
16
56
77
1
0
9
64
41
Texas
1
3
8
122
114
2
3
16
130
163
—
1
4
36
30
Mountain
5
2
7
111
113
—
1
4
66
79
—
1
6
65
74
Arizona
5
1
5
59
65
—
0
2
11
12
U
0
0
U
U
Colorado
—
0
3
16
20
—
0
2
8
20
—
0
4
14
26
Idaho
—
0
2
11
6
—
0
1
5
2
—
0
2
10
10
Montana
—
0
1
3
3
—
0
1
1
—
—
0
4
5
3
Nevada
—
0
1
9
5
—
0
3
26
25
—
0
2
9
10
New Mexico
—
0
2
9
6
—
0
1
3
10
—
0
2
16
14
Utah
—
0
1
4
6
—
0
2
12
10
—
0
2
11
9
Wyoming
—
0
0
—
2
—
0
0
—
—
—
0
0
—
2
Pacific
1
4
11
186
213
2
4
12
163
204
2
3
10
126
92
Alaska
—
0
1
1
2
—
0
2
5
3
—
0
0
—
2
California
1
3
10
150
167
—
2
7
100
140
—
1
5
57
45
Hawaii
—
0
2
6
8
—
0
1
5
6
—
0
0
—
—
Oregon
—
0
1
4
8
2
0
3
23
29
—
0
3
32
17
Washington
—
0
3
25
28
—
0
6
30
26
2
1
10
37
28
Territories
American Samoa
—
0
0
—
—
—
0
0
—
—
—
0
0
—
—
C.N.M.I.
—
—
—
—
—
—
—
—
—
—
—
—
—
—
—
Guam
—
0
3
—
42
—
2
4
—
111
—
0
3
—
67
Puerto Rico
—
0
1
—
20
—
0
2
4
23
N
0
0
N
N
U.S. Virgin Islands
—
0
0
—
—
—
0
5
—
—
—
0
0
—
—
C.N.M.I.: Commonwealth of Northern Mariana Islands.
U: Unavailable. —: No reported cases. N: Not reportable. NN: Not Nationally Notifiable. Cum: Cumulative year-to-date counts. Med: Median. Max: Maximum.
TABLE II. (Continued) Provisional cases of selected notifiable diseases, United States, weeks ending November 17, 2012, and November 19, 2011 (46th week)*
Reporting area
Legionellosis
Lyme disease
Malaria
Current week
Previous 52 weeks
Cum 2012
Cum 2011
Current week
Previous 52 weeks
Cum 2012
Cum 2011
Current week
Previous 52 weeks
Cum 2012
Cum 2011
Med
Max
Med
Max
Med
Max
United States
37
64
127
2,781
3,741
75
376
1,306
23,502
30,902
3
23
40
1,039
1,545
New England
2
4
20
231
377
—
102
537
7,145
8,211
—
1
5
58
103
Connecticut
—
1
7
48
74
—
38
168
1,995
2,852
—
0
1
4
20
Maine
1
0
3
16
18
—
15
68
985
943
—
0
1
3
6
Massachusetts
—
2
11
126
225
—
34
293
2,974
2,433
—
1
4
37
64
New Hampshire
—
0
2
15
23
—
11
43
613
1,247
—
0
2
6
2
Rhode Island
—
0
3
15
26
—
1
26
159
137
—
0
2
4
5
Vermont
1
0
2
11
11
—
6
28
419
599
—
0
1
4
6
Mid. Atlantic
9
16
41
745
1,225
56
185
631
11,261
12,944
2
6
13
252
396
New Jersey
—
2
10
70
208
—
44
153
2,611
3,995
—
0
3
—
89
New York (Upstate)
8
6
20
271
344
32
46
183
2,226
3,279
—
1
4
32
48
New York City
—
2
13
141
202
—
1
12
96
680
2
4
11
181
203
Pennsylvania
1
5
18
263
471
24
85
399
6,328
4,990
—
1
3
39
56
E.N. Central
7
12
37
585
786
2
21
140
1,760
3,980
—
2
7
111
162
Illinois
—
3
22
193
135
—
1
18
188
193
—
0
6
29
61
Indiana
1
2
5
88
61
—
1
6
62
93
—
0
2
20
13
Michigan
—
1
5
42
178
1
1
9
104
98
—
0
5
21
32
Ohio
6
5
17
256
350
1
1
6
59
48
—
1
3
38
39
Wisconsin
—
0
3
6
62
—
16
114
1,347
3,548
—
0
1
3
17
W.N. Central
—
4
10
158
107
—
3
19
207
2,243
—
1
5
40
102
Iowa
—
0
2
11
11
—
1
16
151
99
—
0
1
7
22
Kansas
—
0
1
10
12
—
0
3
16
16
—
0
2
6
9
Minnesota
—
1
4
42
27
—
0
10
9
2,087
—
0
1
—
44
Missouri
—
2
8
78
45
—
0
2
9
7
—
0
2
17
20
Nebraska
—
0
2
9
8
—
0
2
9
9
—
0
1
4
6
North Dakota
—
0
1
2
2
—
0
6
9
21
—
0
1
1
—
South Dakota
—
0
1
6
2
—
0
1
4
4
—
0
2
5
1
S. Atlantic
16
11
22
503
542
15
58
147
2,862
3,228
—
7
16
307
419
Delaware
—
0
3
17
21
2
11
30
586
811
—
0
1
2
7
District of Columbia
N
0
0
N
N
N
0
0
N
N
—
0
3
2
14
Florida
11
4
9
191
165
3
2
7
110
97
—
1
6
55
91
Georgia
—
1
4
37
50
—
0
3
18
31
—
1
5
51
82
Maryland
3
2
7
102
128
5
22
79
1,272
1,224
—
1
8
107
118
North Carolina
2
1
8
61
66
—
0
13
88
63
—
0
7
26
33
South Carolina
—
0
3
17
20
—
0
3
27
35
—
0
2
8
5
Virginia
—
1
7
67
75
5
14
51
689
880
—
1
4
56
68
West Virginia
—
0
7
11
17
—
1
22
72
87
—
0
0
—
1
E.S. Central
—
2
7
107
161
—
1
5
58
59
—
0
4
28
34
Alabama
—
0
2
17
26
—
0
2
23
18
—
0
2
9
7
Kentucky
—
0
4
26
47
—
0
1
7
2
—
0
1
8
9
Mississippi
—
0
2
17
14
—
0
1
2
5
—
0
1
1
1
Tennessee
—
1
4
47
74
—
0
4
26
34
—
0
2
10
17
W.S. Central
—
3
13
154
134
—
1
15
34
53
—
1
13
72
99
Arkansas
—
0
2
15
13
—
0
0
—
—
—
0
1
4
7
Louisiana
—
0
3
19
21
—
0
1
3
2
—
0
2
10
2
Oklahoma
—
0
9
14
9
—
0
2
—
—
—
0
4
22
5
Texas
—
3
7
106
91
—
1
13
31
51
—
1
9
36
85
Mountain
—
2
6
88
134
—
0
4
30
46
—
1
3
39
63
Arizona
—
0
4
30
43
—
0
2
12
14
—
0
2
13
21
Colorado
—
0
4
12
36
—
0
0
—
—
—
0
2
8
22
Idaho
—
0
1
3
9
—
0
1
3
4
—
0
1
7
2
Montana
—
0
1
3
1
—
0
2
1
9
—
0
0
—
2
Nevada
—
0
2
14
14
—
0
1
5
4
—
0
2
4
8
New Mexico
—
0
2
8
11
—
0
1
1
6
—
0
1
2
4
Utah
—
0
2
16
16
—
0
1
4
8
—
0
2
5
4
Wyoming
—
0
1
2
4
—
0
1
4
1
—
0
0
—
—
Pacific
3
4
18
210
275
2
3
9
145
138
1
3
7
132
167
Alaska
—
0
0
—
—
1
0
2
11
10
—
0
1
7
5
California
2
4
12
169
230
—
1
7
63
79
1
2
6
93
113
Hawaii
—
0
1
4
3
N
0
0
N
N
—
0
1
4
7
Oregon
—
0
3
20
21
1
1
5
57
36
—
0
4
10
18
Washington
1
0
14
17
21
—
0
4
14
13
—
0
2
18
24
Territories
American Samoa
N
0
0
N
N
N
0
0
N
N
—
0
0
—
1
C.N.M.I.
—
—
—
—
—
—
—
—
—
—
—
—
—
—
—
Guam
—
0
0
—
—
—
0
0
—
—
—
0
0
—
—
Puerto Rico
—
0
0
—
9
N
0
0
N
N
—
0
0
—
1
U.S. Virgin Islands
—
0
1
—
—
N
0
0
N
N
—
0
0
—
—
C.N.M.I.: Commonwealth of Northern Mariana Islands.
U: Unavailable. —: No reported cases. N: Not reportable. NN: Not Nationally Notifiable. Cum: Cumulative year-to-date counts. Med: Median. Max: Maximum.
TABLE II. (Continued) Provisional cases of selected notifiable diseases, United States, weeks ending November 17, 2012, and November 19, 2011 (46th week)*
Reporting area
Meningococcal disease, invasive† All serogroups
Mumps
Pertussis
Current week
Previous 52 weeks
Cum 2012
Cum 2011
Current week
Previous 52 weeks
Cum 2012
Cum 2011
Current week
Previous 52 weeks
Cum 2012
Cum 2011
Med
Max
Med
Max
Med
Max
United States
5
10
30
444
663
2
4
20
173
346
206
716
1,229
36,078
14,982
New England
—
0
3
10
28
—
0
1
5
11
22
32
100
1,971
688
Connecticut
—
0
1
2
3
—
0
0
—
—
—
2
9
156
58
Maine
—
0
1
3
5
—
0
0
—
2
2
8
37
606
187
Massachusetts
—
0
2
4
14
—
0
1
3
4
—
9
28
502
227
New Hampshire
—
0
0
—
1
—
0
1
1
—
—
3
19
207
151
Rhode Island
—
0
1
—
—
—
0
1
1
4
—
1
20
86
33
Vermont
—
0
1
1
5
—
0
0
—
1
20
8
20
414
32
Mid. Atlantic
2
1
4
69
77
—
0
3
27
50
56
102
199
5,087
1,691
New Jersey
—
0
1
11
12
—
0
1
—
12
—
15
28
608
223
New York (Upstate)
1
0
2
18
21
—
0
1
5
10
32
45
140
2,445
631
New York City
—
0
2
19
25
—
0
3
17
25
—
8
28
385
212
Pennsylvania
1
0
2
21
19
—
0
2
5
3
24
30
63
1,649
625
E.N. Central
—
1
5
56
101
—
1
13
48
91
17
186
349
8,766
3,417
Illinois
—
0
3
14
30
—
1
11
25
64
—
42
89
1,736
1,145
Indiana
—
0
1
6
23
—
0
2
4
3
—
7
18
312
291
Michigan
—
0
2
12
9
—
0
1
7
8
7
11
38
620
618
Ohio
—
0
2
21
22
—
0
1
5
13
10
16
37
762
656
Wisconsin
—
0
2
3
17
—
0
1
7
3
—
94
253
5,336
707
W.N. Central
—
1
4
38
58
—
0
2
19
31
—
76
199
4,692
1,314
Iowa
—
0
1
2
12
—
0
2
2
5
—
28
97
1,453
201
Kansas
—
0
1
6
4
—
0
1
3
4
—
11
29
630
113
Minnesota
—
0
3
10
14
—
0
1
7
1
—
24
78
1,473
553
Missouri
—
0
3
16
15
—
0
1
6
11
—
16
45
741
319
Nebraska
—
0
1
3
10
—
0
1
1
6
—
2
19
160
53
North Dakota
—
0
1
1
—
—
0
0
—
4
—
0
45
175
41
South Dakota
—
0
1
—
3
—
0
0
—
—
—
1
6
60
34
S. Atlantic
3
2
5
74
118
1
0
3
17
36
15
50
103
2,398
1,218
Delaware
—
0
1
1
1
—
0
0
—
—
1
1
3
44
23
District of Columbia
—
0
1
1
1
—
0
2
2
—
—
0
4
19
6
Florida
3
1
3
42
46
—
0
1
4
8
6
10
26
536
288
Georgia
—
0
2
10
14
1
0
0
1
5
1
4
15
241
162
Maryland
—
0
2
4
12
—
0
1
—
1
2
6
17
302
98
North Carolina
—
0
1
5
12
—
0
1
1
9
3
7
74
488
110
South Carolina
—
0
1
3
9
—
0
1
1
2
—
3
13
167
133
Virginia
—
0
1
3
16
—
0
1
6
11
2
10
25
513
337
West Virginia
—
0
3
5
7
—
0
1
2
—
—
1
24
88
61
E.S. Central
—
0
3
10
25
—
0
1
6
4
2
18
46
956
409
Alabama
—
0
1
3
10
—
0
1
1
1
—
4
9
171
128
Kentucky
—
0
2
1
5
—
0
1
1
—
—
8
33
464
140
Mississippi
—
0
1
2
3
—
0
1
2
3
—
1
4
72
44
Tennessee
—
0
1
4
7
—
0
1
2
—
2
4
14
249
97
W.S. Central
—
1
5
45
59
1
0
4
15
63
59
40
161
1,907
870
Arkansas
—
0
1
6
12
—
0
1
1
3
—
2
11
95
65
Louisiana
—
0
1
3
13
—
0
0
—
—
—
0
6
42
28
Oklahoma
—
0
2
5
10
—
0
1
1
4
1
0
34
117
52
Texas
—
0
3
31
24
1
0
4
13
56
58
36
134
1,653
725
Mountain
—
1
3
30
48
—
0
2
11
11
9
82
170
4,249
2,242
Arizona
—
0
1
2
13
—
0
2
3
—
2
18
36
877
759
Colorado
—
0
2
6
8
—
0
2
3
7
—
14
60
780
356
Idaho
—
0
1
4
5
—
0
0
—
2
6
4
14
208
146
Montana
—
0
1
7
4
—
0
1
1
—
—
5
48
442
129
Nevada
—
0
1
2
5
—
0
0
—
—
—
1
6
85
30
New Mexico
—
0
1
3
3
—
0
0
—
1
1
13
30
646
249
Utah
—
0
1
4
10
—
0
1
3
—
—
22
51
1,153
562
Wyoming
—
0
1
2
—
—
0
1
1
1
—
0
5
58
11
Pacific
—
2
10
112
149
—
1
2
25
49
26
122
311
6,052
3,133
Alaska
—
0
1
1
2
—
0
1
1
1
12
2
23
207
24
California
—
1
7
77
96
—
0
2
20
41
1
13
53
540
2,193
Hawaii
—
0
1
3
4
—
0
1
—
2
—
1
4
62
48
Oregon
—
0
4
21
30
—
0
1
3
4
—
13
54
855
285
Washington
—
0
3
10
17
—
0
1
1
1
13
83
254
4,388
583
Territories
American Samoa
—
0
0
—
—
—
0
0
—
—
—
0
0
—
—
C.N.M.I.
—
—
—
—
—
—
—
—
—
—
—
—
—
—
—
Guam
—
0
0
—
—
—
0
0
—
3
—
0
0
—
7
Puerto Rico
—
0
0
—
—
—
0
1
3
3
—
0
0
—
8
U.S. Virgin Islands
—
0
0
—
—
—
0
0
—
—
—
0
0
—
—
C.N.M.I.: Commonwealth of Northern Mariana Islands.
U: Unavailable. —: No reported cases. N: Not reportable. NN: Not Nationally Notifiable. Cum: Cumulative year-to-date counts. Med: Median. Max: Maximum.
† Data for meningococcal disease, invasive caused by serogroups A, C, Y, and W-135; serogroup B; other serogroup; and unknown serogroup are available in Table I.
TABLE II. (Continued) Provisional cases of selected notifiable diseases, United States, weeks ending November 17, 2012, and November 19, 2011 (46th week)*
Reporting area
Rabies, animal
Salmonellosis
Shiga toxin-producing E. coli (STEC)†
Current week
Previous 52 weeks
Cum 2012
Cum 2011
Current week
Previous 52 weeks
Cum 2012
Cum 2011
Current week
Previous 52 weeks
Cum 2012
Cum 2011
Med
Max
Med
Max
Med
Max
United States
39
69
122
3,193
4,005
684
975
1,573
43,356
46,569
40
106
177
4,728
5,417
New England
4
7
16
340
307
—
35
73
1,697
1,956
1
3
12
182
197
Connecticut
1
3
8
157
180
—
8
17
399
434
1
1
5
49
49
Maine
2
1
6
81
60
—
3
11
140
124
—
0
6
26
28
Massachusetts
—
0
0
—
—
—
19
54
870
985
—
1
5
69
76
New Hampshire
—
1
3
28
20
—
2
8
125
164
—
0
4
21
22
Rhode Island
—
0
2
24
22
—
2
7
84
174
—
0
2
1
7
Vermont
1
1
7
50
25
—
1
7
79
75
—
0
2
16
15
Mid. Atlantic
6
15
31
708
767
27
87
158
4,096
5,194
13
10
24
552
608
New Jersey
—
0
0
—
—
—
13
29
452
1,123
—
2
6
100
133
New York (Upstate)
6
7
20
395
342
18
23
62
1,176
1,279
10
4
14
208
194
New York City
—
0
1
—
12
3
19
49
1,065
1,047
—
1
7
74
85
Pennsylvania
—
7
15
313
413
6
27
70
1,403
1,745
3
3
11
170
196
E.N. Central
—
2
13
153
190
26
90
209
4,458
4,760
3
16
62
892
954
Illinois
—
1
6
63
50
—
27
79
1,621
1,562
—
3
12
153
226
Indiana
—
0
2
7
28
—
13
39
652
592
—
2
22
155
123
Michigan
—
0
5
44
64
2
15
44
777
782
—
3
40
249
144
Ohio
—
0
7
39
48
24
22
53
1,198
1,111
3
3
20
213
167
Wisconsin
N
0
0
N
N
—
4
16
210
713
—
2
13
122
294
W.N. Central
—
4
18
194
176
1
49
116
2,497
2,756
—
15
31
688
960
Iowa
—
0
5
29
23
1
9
30
574
421
—
3
15
169
182
Kansas
—
1
4
52
30
—
9
19
431
427
—
2
7
78
102
Minnesota
—
0
3
—
52
—
0
16
—
660
—
0
7
—
275
Missouri
—
0
3
29
26
—
20
49
1,037
826
—
6
20
298
257
Nebraska
—
0
1
—
32
—
4
26
270
234
—
1
8
75
98
North Dakota
—
0
13
30
13
—
1
19
51
36
—
0
4
29
8
South Dakota
—
1
7
54
—
—
3
9
134
152
—
1
3
39
38
S. Atlantic
—
19
45
862
1,048
314
290
540
13,309
13,593
4
12
31
542
538
Delaware
—
0
0
—
—
—
3
10
138
167
—
0
1
11
15
District of Columbia
—
0
0
—
—
—
1
4
35
79
—
0
1
4
5
Florida
—
0
34
91
120
156
110
272
5,854
5,218
2
4
10
189
97
Georgia
—
0
0
—
—
36
46
125
2,430
2,463
—
2
9
117
108
Maryland
—
6
16
253
278
8
18
43
860
933
—
1
5
67
64
North Carolina
—
0
0
—
—
107
33
186
1,968
2,107
2
1
26
52
115
South Carolina
N
0
0
N
N
—
19
61
924
1,460
—
0
7
18
16
Virginia
—
10
23
461
559
7
22
57
979
1,065
—
1
7
77
112
West Virginia
—
1
6
57
91
—
2
52
121
101
—
0
2
7
6
E.S. Central
1
1
5
62
152
19
62
201
3,655
3,909
2
5
14
243
266
Alabama
1
1
5
49
76
2
19
52
952
1,151
—
1
3
48
70
Kentucky
—
0
1
13
16
—
8
47
522
553
—
1
9
68
63
Mississippi
—
0
0
—
—
3
21
87
1,207
1,245
1
0
3
21
33
Tennessee
—
0
1
—
60
14
18
68
974
960
1
2
12
106
100
W.S. Central
28
11
58
682
1,061
223
146
374
6,747
7,128
6
9
92
417
497
Arkansas
5
0
35
119
49
132
14
227
1,281
770
1
1
4
48
56
Louisiana
—
0
0
—
6
3
26
56
1,237
1,334
—
0
3
25
18
Oklahoma
23
0
21
71
55
6
15
102
668
662
5
1
16
88
63
Texas
—
10
29
492
951
82
82
227
3,561
4,362
—
5
76
256
360
Mountain
—
1
15
95
67
10
40
85
1,900
2,367
1
9
28
483
663
Arizona
N
0
0
N
N
10
15
28
690
795
—
2
6
103
114
Colorado
—
0
0
—
—
—
7
20
316
481
—
1
6
49
153
Idaho
—
0
14
22
6
—
2
7
105
136
1
1
13
109
114
Montana
N
0
0
N
N
—
2
8
89
116
—
0
5
37
34
Nevada
—
0
4
16
17
—
3
12
148
155
—
0
5
30
40
New Mexico
—
1
5
43
11
—
5
16
272
317
—
1
5
47
43
Utah
—
0
2
14
7
—
5
12
228
300
—
1
14
89
136
Wyoming
—
0
0
—
26
—
1
8
52
67
—
0
3
19
29
Pacific
—
2
12
97
237
64
95
201
4,997
4,906
10
16
39
729
734
Alaska
—
0
1
6
13
—
1
5
53
50
—
0
0
—
—
California
—
1
6
78
207
48
63
150
3,548
3,731
—
8
18
337
444
Hawaii
—
0
0
—
—
—
4
58
339
295
—
0
2
13
6
Oregon
—
0
2
13
17
1
7
16
348
325
2
3
11
182
122
Washington
—
0
11
—
—
15
13
56
709
505
8
3
24
197
162
Territories
American Samoa
N
0
0
N
N
—
1
2
4
—
—
0
0
—
—
C.N.M.I.
—
—
—
—
—
—
—
—
—
—
—
—
—
—
—
Guam
—
0
0
—
—
—
0
0
—
19
—
0
0
—
—
Puerto Rico
—
0
5
27
42
—
0
19
32
417
—
0
2
2
—
U.S. Virgin Islands
—
0
0
—
—
—
0
6
—
—
—
0
0
—
—
C.N.M.I.: Commonwealth of Northern Mariana Islands.
U: Unavailable. —: No reported cases. N: Not reportable. NN: Not Nationally Notifiable. Cum: Cumulative year-to-date counts. Med: Median. Max: Maximum.
† Includes E. coli O157:H7; Shiga toxin-positive, serogroup non-O157; and Shiga toxin-positive, not serogrouped.
TABLE II. (Continued) Provisional cases of selected notifiable diseases, United States, weeks ending November 17, 2012, and November 19, 2011 (46th week)*
Reporting area
Shigellosis
Spotted Fever Rickettsiosis (including RMSF)†
Confirmed
Probable
Current week
Previous 52 weeks
Cum 2012
Cum 2011
Current week
Previous 52 weeks
Cum 2012
Cum 2011
Current week
Previous 52 weeks
Cum 2012
Cum 2011
Med
Max
Med
Max
Med
Max
United States
185
274
426
12,097
11,387
—
3
10
165
215
11
52
350
3,596
2,043
New England
—
3
9
148
247
—
0
1
1
2
—
0
3
18
7
Connecticut
—
1
3
35
37
—
0
0
—
—
—
0
0
—
—
Maine
—
0
2
6
31
—
0
0
—
—
—
0
1
3
—
Massachusetts
—
2
6
91
161
—
0
0
—
—
—
0
3
8
4
New Hampshire
—
0
1
6
4
—
0
0
—
2
—
0
1
1
1
Rhode Island
—
0
5
7
8
—
0
0
—
—
—
0
1
6
2
Vermont
—
0
1
3
6
—
0
1
1
—
—
0
0
—
—
Mid. Atlantic
23
44
89
2,040
1,010
—
0
2
18
4
4
1
8
66
147
New Jersey
—
20
47
767
294
—
0
0
—
2
—
0
7
1
113
New York (Upstate)
19
13
41
645
263
—
0
1
3
2
3
0
3
14
6
New York City
2
12
24
518
345
—
0
0
—
—
—
0
2
17
11
Pennsylvania
2
2
7
110
108
—
0
2
15
—
1
1
4
34
17
E.N. Central
57
26
113
2,006
835
—
0
3
23
8
—
3
14
215
104
Illinois
—
5
13
213
240
—
0
1
7
—
—
2
11
140
50
Indiana
—
1
17
148
79
—
0
3
15
3
—
1
6
53
24
Michigan
1
4
14
174
168
—
0
0
—
—
—
0
1
2
3
Ohio
56
14
94
1,393
282
—
0
1
1
3
—
0
2
20
18
Wisconsin
—
1
11
78
66
—
0
0
—
2
—
0
0
—
9
W.N. Central
1
9
32
458
342
—
0
6
17
20
—
6
33
474
268
Iowa
1
1
13
77
18
—
0
0
—
—
—
0
1
7
7
Kansas
—
2
9
116
58
—
0
0
—
—
—
0
0
—
—
Minnesota
—
0
4
—
76
—
0
0
—
—
—
0
1
—
10
Missouri
—
1
7
77
170
—
0
5
15
12
—
6
33
461
246
Nebraska
—
1
22
171
14
—
0
1
1
5
—
0
1
5
5
North Dakota
—
0
2
6
—
—
0
1
1
2
—
0
0
—
—
South Dakota
—
0
3
11
6
—
0
0
—
1
—
0
1
1
—
S. Atlantic
38
58
102
2,679
3,486
—
1
8
63
121
5
14
144
1,015
512
Delaware
1
0
4
19
6
—
0
0
—
—
—
0
2
24
20
District of Columbia
—
0
6
17
22
—
0
0
—
1
—
0
1
1
3
Florida
21
35
66
1,626
2,348
—
0
1
3
2
1
0
3
29
6
Georgia
11
13
21
583
588
—
1
4
39
87
—
0
0
—
—
Maryland
—
4
15
214
87
—
0
0
—
3
—
0
3
26
25
North Carolina
4
2
10
119
199
—
0
4
10
14
—
1
133
477
235
South Carolina
—
0
6
18
136
—
0
1
7
11
—
0
5
35
21
Virginia
1
1
6
81
95
—
0
1
4
3
4
5
35
422
198
West Virginia
—
0
1
2
5
—
0
0
—
—
—
0
1
1
4
E.S. Central
6
21
42
1,009
853
—
0
3
12
14
2
12
57
895
339
Alabama
1
6
20
275
256
—
0
1
3
4
2
2
11
147
69
Kentucky
—
6
21
304
210
—
0
1
3
3
—
0
7
55
—
Mississippi
1
5
13
257
205
—
0
2
2
1
—
0
4
18
21
Tennessee
4
3
10
173
182
—
0
1
4
6
—
10
49
675
249
W.S. Central
43
50
189
2,175
2,785
—
0
6
5
15
—
12
292
858
603
Arkansas
5
1
7
78
89
—
0
1
3
9
—
9
67
763
496
Louisiana
1
4
17
168
431
—
0
0
—
—
—
0
1
5
9
Oklahoma
20
7
55
452
174
—
0
5
1
3
—
0
260
52
66
Texas
17
34
122
1,477
2,091
—
0
1
1
3
—
1
13
38
32
Mountain
12
12
30
584
810
—
0
2
10
29
—
1
5
47
57
Arizona
12
7
16
331
393
—
0
2
10
28
—
0
4
30
37
Colorado
—
1
19
65
79
—
0
0
—
—
—
0
1
2
3
Idaho
—
0
2
9
16
—
0
0
—
—
—
0
2
3
1
Montana
—
0
2
11
119
—
0
0
—
—
—
0
1
1
1
Nevada
—
0
8
49
31
—
0
0
—
—
—
0
0
—
2
New Mexico
—
1
7
84
117
—
0
0
—
—
—
0
1
4
—
Utah
—
0
4
31
53
—
0
0
—
1
—
0
1
5
5
Wyoming
—
0
3
4
2
—
0
0
—
—
—
0
2
2
8
Pacific
5
18
56
998
1,019
—
0
3
16
2
—
0
3
8
6
Alaska
—
0
2
8
5
N
0
0
N
N
N
0
0
N
N
California
5
13
56
783
833
—
0
3
16
2
—
0
1
7
5
Hawaii
—
0
3
23
45
N
0
0
N
N
N
0
0
N
N
Oregon
—
1
10
82
54
—
0
0
—
—
—
0
1
1
1
Washington
—
2
10
102
82
—
0
1
—
—
—
0
3
—
—
Territories
American Samoa
—
0
3
5
1
N
0
0
N
N
N
0
0
N
N
C.N.M.I.
—
—
—
—
—
—
—
—
—
—
—
—
—
—
—
Guam
—
0
1
—
16
N
0
0
N
N
N
0
0
N
N
Puerto Rico
—
0
0
—
6
N
0
0
N
N
N
0
0
N
N
U.S. Virgin Islands
—
0
0
—
—
N
0
0
N
N
N
0
0
N
N
C.N.M.I.: Commonwealth of Northern Mariana Islands.
U: Unavailable. —: No reported cases. N: Not reportable. NN: Not Nationally Notifiable. Cum: Cumulative year-to-date counts. Med: Median. Max: Maximum.
† Illnesses with similar clinical presentation that result from Spotted fever group rickettsia infections are reported as Spotted fever rickettsioses. Rocky Mountain spotted fever (RMSF) caused by Rickettsia rickettsii, is the most common and well-known spotted fever.
TABLE II. (Continued) Provisional cases of selected notifiable diseases, United States, weeks ending November 17, 2012, and November 19, 2011 (46th week)*
Reporting area
Streptococcus pneumoniae,† invasive disease
Syphilis, primary and secondary
All ages
Age <5
Current week
Previous 52 weeks
Cum 2012
Cum 2011
Current week
Previous 52 weeks
Cum 2012
Cum 2011
Current week
Previous 52 weeks
Cum 2012
Cum 2011
Med
Max
Med
Max
Med
Max
United States
132
272
803
10,666
14,102
13
20
58
762
1,020
46
279
336
12,141
12,254
New England
—
11
27
491
700
—
0
4
35
46
5
8
23
376
341
Connecticut
—
5
13
234
308
—
0
2
11
11
—
0
13
37
40
Maine
—
2
7
83
116
—
0
1
2
4
—
0
5
14
12
Massachusetts
—
0
4
29
34
—
0
2
15
17
2
6
13
253
227
New Hampshire
—
1
6
58
94
—
0
1
6
5
3
0
2
28
17
Rhode Island
—
0
5
40
84
—
0
1
1
3
—
1
6
40
37
Vermont
—
1
4
47
64
—
0
1
—
6
—
0
1
4
8
Mid. Atlantic
15
39
157
1,556
2,136
1
2
11
78
106
4
34
49
1,456
1,485
New Jersey
—
2
26
258
579
—
0
2
10
39
—
4
8
147
213
New York (Upstate)
10
19
108
745
932
1
1
10
49
38
2
4
12
182
157
New York City
5
13
24
553
625
—
0
2
19
29
1
17
25
733
796
Pennsylvania
N
0
0
N
N
N
0
0
N
N
1
9
17
394
319
E.N. Central
22
56
101
2,283
2,779
1
3
10
147
160
2
29
62
1,232
1,633
Illinois
N
0
0
N
N
—
0
0
—
—
—
10
54
457
766
Indiana
—
12
33
499
679
—
0
2
24
37
—
3
10
185
155
Michigan
3
11
25
437
605
—
0
3
27
33
—
4
13
185
262
Ohio
19
22
46
977
1,070
1
2
6
76
70
2
7
15
331
394
Wisconsin
—
9
29
370
425
—
0
2
20
20
—
2
5
74
56
W.N. Central
—
14
58
581
630
—
1
4
48
53
—
5
14
253
296
Iowa
N
0
0
N
N
N
0
0
N
N
—
1
4
50
20
Kansas
N
0
0
N
N
N
0
0
N
N
—
0
4
22
23
Minnesota
—
9
26
378
483
—
0
3
28
40
—
1
4
39
125
Missouri
N
0
0
N
N
—
0
0
—
—
—
2
9
124
119
Nebraska
—
2
8
106
104
—
0
2
10
12
—
0
2
4
8
North Dakota
—
0
38
25
43
—
0
2
1
1
—
0
1
2
1
South Dakota
—
1
5
72
—
—
0
2
9
—
—
0
2
12
—
S. Atlantic
42
58
193
2,453
3,412
5
4
21
191
270
15
65
102
2,934
3,028
Delaware
—
0
5
26
43
—
0
1
1
—
1
0
6
38
18
District of Columbia
—
0
5
45
43
—
0
1
3
5
—
3
9
149
149
Florida
18
18
48
820
1,166
2
1
8
63
114
1
25
36
1,144
1,113
Georgia
20
15
48
700
994
3
2
5
65
73
5
11
59
580
572
Maryland
4
7
22
295
516
—
0
5
26
39
—
7
15
324
396
North Carolina
N
0
0
N
N
N
0
0
N
N
—
6
21
280
386
South Carolina
—
6
16
270
392
—
0
3
16
26
—
4
10
194
201
Virginia
N
0
0
N
N
—
0
0
—
—
8
3
40
222
191
West Virginia
—
5
83
297
258
—
0
8
17
13
—
0
2
3
2
E.S. Central
9
17
50
755
1,024
—
1
5
43
80
8
15
32
681
715
Alabama
—
0
0
—
—
—
0
0
—
—
1
4
10
188
208
Kentucky
—
3
9
149
196
—
0
1
7
21
6
2
9
123
109
Mississippi
—
0
0
—
—
—
0
0
—
—
—
3
21
149
156
Tennessee
9
12
47
606
828
—
1
4
36
59
1
5
14
221
242
W.S. Central
33
26
188
1,262
1,676
4
3
12
114
159
—
42
59
1,873
1,679
Arkansas
7
3
14
139
190
1
0
3
13
12
—
3
15
158
170
Louisiana
—
3
18
148
201
—
0
2
11
19
—
6
13
248
391
Oklahoma
N
0
0
N
N
—
0
0
—
—
—
1
5
68
76
Texas
26
20
156
975
1,285
3
2
11
90
128
—
30
44
1,399
1,042
Mountain
10
26
48
1,163
1,607
1
2
6
88
134
—
11
23
536
558
Arizona
7
13
27
567
676
—
1
3
40
53
—
4
11
167
236
Colorado
—
6
19
290
443
—
0
3
22
33
—
4
10
166
111
Idaho
N
0
0
N
N
—
0
0
—
—
—
0
3
19
11
Montana
—
0
0
—
—
N
0
0
N
N
—
0
1
—
6
Nevada
—
0
0
—
—
—
0
0
—
—
—
2
8
89
121
New Mexico
3
5
14
216
286
1
0
4
15
22
—
1
5
73
60
Utah
—
1
9
64
182
—
0
2
10
26
—
0
2
19
13
Wyoming
—
0
3
26
20
—
0
1
1
—
—
0
1
3
—
Pacific
1
2
8
122
138
1
0
2
18
12
12
63
96
2,800
2,519
Alaska
1
2
8
120
132
1
0
2
18
10
—
0
2
9
3
California
N
0
0
N
N
N
0
0
N
N
7
53
79
2,351
2,133
Hawaii
—
0
1
2
6
—
0
0
—
2
—
0
3
6
11
Oregon
N
0
0
N
N
N
0
0
N
N
3
3
11
178
81
Washington
N
0
0
N
N
N
0
0
N
N
2
6
12
256
291
Territories
American Samoa
N
0
0
N
N
—
0
0
—
—
—
0
0
—
—
C.N.M.I.
—
—
—
—
—
—
—
—
—
—
—
—
—
—
—
Guam
—
0
0
—
—
—
0
0
—
—
—
0
0
—
—
Puerto Rico
—
0
0
—
—
—
0
0
—
—
7
6
16
263
209
U.S. Virgin Islands
—
0
0
—
—
—
0
0
—
—
—
0
0
—
—
C.N.M.I.: Commonwealth of Northern Mariana Islands.
U: Unavailable. —: No reported cases. N: Not reportable. NN: Not Nationally Notifiable. Cum: Cumulative year-to-date counts. Med: Median. Max: Maximum.
† Includes drug resistant and susceptible cases of invasive Streptococcus pneumoniae disease among children <5 years and among all ages. Case definition: Isolation of S. pneumoniae from a normally sterile body site (e.g., blood or cerebrospinal fluid).
TABLE II. (Continued) Provisional cases of selected notifiable diseases, United States, weeks ending November 17, 2012, and November 19, 2011 (46th week)*
Reporting area
Varicella (chickenpox)
West Nile virus disease†
Neuroinvasive
Nonneuroinvasive§
Current week
Previous 52 weeks
Cum 2012
Cum 2011
Current week
Previous 52 weeks
Cum 2012
Cum 2011
Current week
Previous 52 weeks
Cum 2012
Cum 2011
Med
Max
Med
Max
Med
Max
United States
88
249
396
10,109
12,673
—
1
319
2,624
484
—
1
329
2,557
226
New England
5
25
49
1,085
1,210
—
0
6
37
15
—
0
4
22
2
Connecticut
3
5
10
228
266
—
0
2
12
8
—
0
3
9
1
Maine
—
4
22
220
204
—
0
1
1
—
—
0
0
—
—
Massachusetts
—
11
21
451
453
—
0
5
20
5
—
0
2
10
1
New Hampshire
—
0
4
—
150
—
0
1
1
—
—
0
0
—
—
Rhode Island
—
0
9
61
37
—
0
1
2
1
—
0
1
1
—
Vermont
2
2
13
125
100
—
0
1
1
1
—
0
1
2
—
Mid. Atlantic
12
23
56
1,046
1,420
—
0
16
107
34
—
0
17
93
22
New Jersey
—
7
25
351
431
—
0
5
22
2
—
0
4
24
5
New York (Upstate)
N
0
0
N
N
—
0
6
35
18
—
0
8
31
14
New York City
—
0
0
—
—
—
0
5
24
9
—
0
2
16
2
Pennsylvania
12
16
35
695
989
—
0
4
26
5
—
0
3
22
1
E.N. Central
32
65
128
2,620
3,141
—
0
90
460
73
—
0
39
233
28
Illinois
4
19
38
782
756
—
0
29
168
22
—
0
14
81
12
Indiana
6
9
21
375
203
—
0
7
40
7
—
0
5
30
2
Michigan
3
18
45
728
903
—
0
32
137
32
—
0
13
64
2
Ohio
19
17
47
733
895
—
0
19
76
10
—
0
12
43
11
Wisconsin
—
0
11
2
384
—
0
11
39
2
—
0
5
15
1
W.N. Central
—
10
35
474
689
—
0
35
215
31
—
0
55
412
29
Iowa
N
0
0
N
N
—
0
3
11
5
—
0
5
19
4
Kansas
—
0
21
85
360
—
0
3
18
4
—
0
6
26
—
Minnesota
—
0
0
—
1
—
0
6
34
1
—
0
7
36
1
Missouri
—
6
24
322
214
—
0
3
16
6
—
0
2
4
4
Nebraska
—
0
3
10
19
—
0
8
36
14
—
0
22
139
15
North Dakota
—
0
29
27
36
—
0
9
38
1
—
0
11
48
3
South Dakota
—
1
3
30
59
—
0
17
62
—
—
0
26
140
2
S. Atlantic
9
29
76
1,360
1,713
—
0
18
155
67
—
0
17
102
27
Delaware
—
0
1
3
11
—
0
1
2
1
—
0
2
7
—
District of Columbia
—
0
4
12
12
—
0
1
2
10
—
0
0
—
5
Florida
—
15
50
719
769
—
0
5
39
20
—
0
5
17
4
Georgia
1
0
4
31
28
—
0
6
40
14
—
0
8
34
8
Maryland
N
0
0
N
N
—
0
5
23
10
—
0
5
22
9
North Carolina
N
0
0
N
N
—
0
4
6
2
—
0
0
—
—
South Carolina
—
0
2
5
13
—
0
5
20
—
—
0
2
9
—
Virginia
8
8
24
384
484
—
0
4
18
8
—
0
3
9
1
West Virginia
—
4
12
206
396
—
0
1
5
2
—
0
2
4
—
E.S. Central
1
3
14
176
262
—
0
20
153
56
—
0
19
171
24
Alabama
1
3
13
165
250
—
0
8
32
5
—
0
3
12
—
Kentucky
N
0
0
N
N
—
0
1
4
4
—
0
1
2
1
Mississippi
—
0
3
11
12
—
0
12
99
31
—
0
17
143
21
Tennessee
N
0
0
N
N
—
0
4
18
16
—
0
2
14
2
W.S. Central
20
47
213
2,057
2,561
—
0
143
1,060
27
—
0
160
1,203
11
Arkansas
—
4
18
173
304
—
0
9
43
1
—
0
3
19
—
Louisiana
—
0
4
31
93
—
0
18
145
6
—
0
26
166
4
Oklahoma
N
0
0
N
N
—
0
24
98
—
—
0
22
86
—
Texas
20
42
204
1,853
2,164
—
0
103
774
20
—
0
125
932
7
Mountain
9
25
61
1,173
1,538
—
0
34
179
71
—
0
21
156
35
Arizona
3
9
26
450
576
—
0
9
81
49
—
0
6
42
20
Colorado
—
7
25
310
395
—
0
16
60
2
—
0
13
69
5
Idaho
N
0
0
N
N
—
0
1
5
1
—
0
3
12
2
Montana
5
2
8
105
149
—
0
1
1
1
—
0
2
5
—
Nevada
N
0
0
N
N
—
0
1
5
12
—
0
2
3
4
New Mexico
—
1
8
74
56
—
0
8
21
4
—
0
4
19
—
Utah
1
5
15
220
352
—
0
1
3
1
—
0
1
2
2
Wyoming
—
0
2
14
10
—
0
1
3
1
—
0
2
4
2
Pacific
—
3
8
118
139
—
0
31
258
110
—
0
25
165
48
Alaska
—
1
4
57
61
—
0
0
—
—
—
0
0
—
—
California
—
0
3
22
36
—
0
31
254
110
—
0
25
162
48
Hawaii
—
1
3
39
42
—
0
0
—
—
—
0
0
—
—
Oregon
N
0
0
N
N
—
0
0
—
—
—
0
1
3
—
Washington
N
0
0
N
N
—
0
4
4
—
—
0
0
—
—
Territories
American Samoa
N
0
0
N
N
—
0
0
—
—
—
0
0
—
—
C.N.M.I.
—
—
—
—
—
—
—
—
—
—
—
—
—
—
—
Guam
—
1
3
—
96
—
0
0
—
—
—
0
0
—
—
Puerto Rico
—
1
13
70
396
—
0
0
—
—
—
0
0
—
—
U.S. Virgin Islands
—
0
1
—
—
—
0
0
—
—
—
0
0
—
—
C.N.M.I.: Commonwealth of Northern Mariana Islands.
U: Unavailable. —: No reported cases. N: Not reportable. NN: Not Nationally Notifiable. Cum: Cumulative year-to-date counts. Med: Median. Max: Maximum.
† Updated weekly from reports to the Division of Vector-Borne Infectious Diseases, National Center for Zoonotic, Vector-Borne, and Enteric Diseases (ArboNET Surveillance). Data for California serogroup, eastern equine, Powassan, St. Louis, and western equine diseases are available in Table I.
§ Not reportable in all states. Data from states where the condition is not reportable are excluded from this table, except starting in 2007 for the domestic arboviral diseases and influenza-associated pediatric mortality, and in 2003 for SARS-CoV. Reporting exceptions are available at http://wwwn.cdc.gov/nndss/document/SRCA_FINAL_REPORT_2006-2010.xlsx.
TABLE III. Deaths in 122 U.S. cities,* week ending November 17, 2012 (46th week)
Reporting area
All causes, by age (years)
P&I† Total
Reporting area (Continued)
All causes, by age (years)
P&I† Total
All Ages
=65
45–64
25–44
1–24
<1
All Ages
=65
45–64
25–44
1–24
<1
New England
608
416
139
30
9
14
62
S. Atlantic
893
576
219
58
21
19
41
Boston, MA
157
97
40
9
4
7
17
Atlanta, GA
124
76
31
10
2
5
4
Bridgeport, CT
43
32
8
2
—
1
6
Baltimore, MD
175
110
45
11
5
4
8
Cambridge, MA
12
11
1
—
—
—
3
Charlotte, NC
122
86
25
4
6
1
11
Fall River, MA
20
16
2
1
1
—
1
Jacksonville, FL
94
76
10
6
1
1
2
Hartford, CT
51
37
13
—
1
—
7
Miami, FL
5
3
—
2
—
—
—
Lowell, MA
24
18
4
2
—
—
3
Norfolk, VA
56
32
15
5
1
3
2
Lynn, MA
4
3
1
—
—
—
1
Richmond, VA
44
27
14
2
—
1
1
New Bedford, MA
24
18
5
1
—
—
2
Savannah, GA
48
30
13
4
1
—
1
New Haven, CT
37
24
9
2
—
2
3
St. Petersburg, FL
71
47
20
4
—
—
2
Providence, RI
75
56
14
4
1
—
2
Tampa, FL
21
12
8
1
—
—
2
Somerville, MA
1
1
—
—
—
—
—
Washington, D.C.
124
71
36
8
5
4
7
Springfield, MA
58
29
20
4
1
4
1
Wilmington, DE
9
6
2
1
—
—
1
Waterbury, CT
37
28
7
2
—
—
3
E.S. Central
860
563
202
56
18
21
55
Worcester, MA
65
46
15
3
1
—
13
Birmingham, AL
130
79
33
10
3
5
13
Mid. Atlantic
1,791
1,264
404
74
34
15
120
Chattanooga, TN
76
50
19
3
1
3
2
Albany, NY
49
36
9
2
1
1
2
Knoxville, TN
107
75
20
8
1
3
10
Allentown, PA
37
30
4
1
1
1
4
Lexington, KY
59
31
17
7
2
2
1
Buffalo, NY
88
61
20
3
3
1
4
Memphis, TN
156
94
44
11
4
3
14
Camden, NJ
29
16
8
3
—
2
3
Mobile, AL
103
82
14
5
2
—
2
Elizabeth, NJ
22
16
4
2
—
—
3
Montgomery, AL
53
37
14
2
—
—
2
Erie, PA
42
35
7
—
—
—
7
Nashville, TN
176
115
41
10
5
5
11
Jersey City, NJ
36
23
12
1
—
—
4
W.S. Central
1,190
789
252
93
21
35
51
New York City, NY
978
716
205
38
14
5
60
Austin, TX
84
52
17
9
2
4
5
Newark, NJ
32
15
13
2
2
—
2
Baton Rouge, LA
U
U
U
U
U
U
U
Paterson, NJ
24
11
11
1
—
1
2
Corpus Christi, TX
70
49
14
5
1
1
6
Philadelphia, PA
121
78
33
4
6
—
7
Dallas, TX
189
110
52
15
5
7
8
Pittsburgh, PA§
52
32
14
5
1
—
5
El Paso, TX
128
99
20
4
2
3
2
Reading, PA
36
27
7
1
1
—
3
Fort Worth, TX
U
U
U
U
U
U
U
Rochester, NY
78
55
14
3
4
2
4
Houston, TX
326
205
74
34
3
10
12
Schenectady, NY
14
10
3
1
—
—
—
Little Rock, AR
76
50
19
4
1
2
3
Scranton, PA
32
25
7
—
—
—
2
New Orleans, LA
U
U
U
U
U
U
U
Syracuse, NY
58
38
14
4
—
2
5
San Antonio, TX
255
177
45
19
6
8
12
Trenton, NJ
25
13
10
2
—
—
—
Shreveport, LA
U
U
U
U
U
U
U
Utica, NY
17
11
6
—
—
—
1
Tulsa, OK
62
47
11
3
1
—
3
Yonkers, NY
21
16
3
1
1
—
2
Mountain
1,088
735
252
66
20
14
55
E.N. Central
2,037
1,403
451
122
37
24
140
Albuquerque, NM
98
55
29
9
2
3
7
Akron, OH
57
39
11
3
2
2
5
Boise, ID
43
30
9
1
1
2
1
Canton, OH
35
27
6
1
1
—
2
Colorado Springs, CO
70
50
15
4
1
—
1
Chicago, IL
270
184
61
17
5
3
18
Denver, CO
90
53
27
6
2
2
1
Cincinnati, OH
82
51
18
6
2
5
6
Las Vegas, NV
276
198
59
15
3
1
11
Cleveland, OH
239
170
51
12
5
1
5
Ogden, UT
34
27
3
2
1
1
5
Columbus, OH
191
132
38
15
3
3
15
Phoenix, AZ
164
103
45
7
3
5
7
Dayton, OH
150
111
30
7
1
1
14
Pueblo, CO
43
32
7
3
1
—
4
Detroit, MI
156
93
45
13
5
—
14
Salt Lake City, UT
130
89
25
13
3
—
9
Evansville, IN
53
38
12
3
—
—
2
Tucson, AZ
140
98
33
6
3
—
9
Fort Wayne, IN
99
70
21
6
2
—
5
Pacific
1,638
1,122
371
86
30
28
118
Gary, IN
5
2
2
—
1
—
—
Berkeley, CA
5
4
1
—
—
—
—
Grand Rapids, MI
54
34
15
1
2
2
4
Fresno, CA
130
87
31
9
1
2
11
Indianapolis, IN
192
122
47
18
4
1
16
Glendale, CA
34
28
4
2
—
—
7
Lansing, MI
53
41
10
2
—
—
6
Honolulu, HI
54
36
12
4
1
1
6
Milwaukee, WI
52
31
18
3
—
—
4
Long Beach, CA
57
40
13
2
1
1
5
Peoria, IL
58
43
11
—
2
2
7
Los Angeles, CA
246
163
55
18
5
5
25
Rockford, IL
62
47
8
4
2
1
2
Pasadena, CA
13
10
3
—
—
—
2
South Bend, IN
50
34
12
2
—
2
4
Portland, OR
127
85
28
10
2
2
4
Toledo, OH
102
67
26
8
—
1
4
Sacramento, CA
213
133
58
11
7
4
10
Youngstown, OH
77
67
9
1
—
—
7
San Diego, CA
163
115
38
6
1
2
7
W.N. Central
619
408
141
31
18
20
45
San Francisco, CA
97
60
29
4
1
3
13
Des Moines, IA
83
63
13
4
—
3
8
San Jose, CA
190
135
42
8
3
2
9
Duluth, MN
27
20
6
1
—
—
4
Santa Cruz, CA
32
24
6
—
—
2
3
Kansas City, KS
26
14
11
—
—
1
2
Seattle, WA
95
68
16
5
5
1
5
Kansas City, MO
93
66
19
3
3
2
7
Spokane, WA
72
57
10
1
1
3
5
Lincoln, NE
42
34
6
1
—
1
2
Tacoma, WA
110
77
25
6
2
—
6
Minneapolis, MN
48
22
16
3
2
5
4
Total¶
10,724
7,276
2,431
616
208
190
687
Omaha, NE
75
49
17
5
3
1
6
St. Louis, MO
107
58
29
9
6
4
4
St. Paul, MN
57
39
12
3
1
2
4
Wichita, KS
61
43
12
2
3
1
4
U: Unavailable. —: No reported cases.
* Mortality data in this table are voluntarily reported from 122 cities in the United States, most of which have populations of >100,000. A death is reported by the place of its occurrence and by the week that the death certificate was filed. Fetal deaths are not included.
† Pneumonia and influenza.
§ Because of changes in reporting methods in this Pennsylvania city, these numbers are partial counts for the current week. Complete counts will be available in 4 to 6 weeks.