|
Persons using assistive technology might not be able to fully access information in this file. For assistance, please send e-mail to: mmwrq@cdc.gov. Type 508 Accommodation and the title of the report in the subject line of e-mail. QuickStats: Birth Rates* Among Women Aged 15–44 Years, by Maternal Age Group — National Vital Statistics System, United States,† 1961, 2007, and 2011§Please note: An erratum has been published for this article. To view the erratum, please click here. 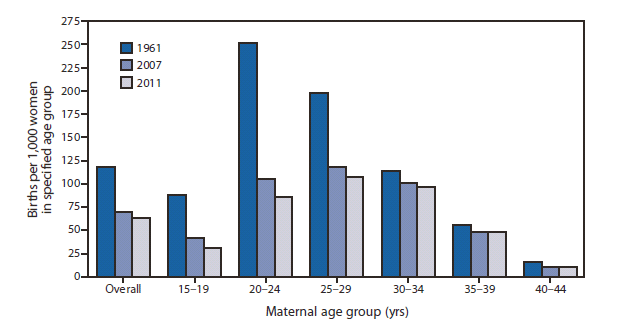
* Per 1,000 women in specified age group. † U.S. residents only. § Data for 2011 are preliminary. During 1961–2011, birth rates decreased for all women aged 15–44 years. During 2007–2011, birth rates decreased for all women aged <35 years, with rates for women aged 20–24 years (85.3 per 1,000 population) and those aged 15–19 years (31.3) reaching historic lows. The birth rate for women aged 25–29 years decreased 9% (to 107.2), and the rate for women aged 30–34 years decreased 6% (to 96.5). The birth rate for women aged 35–39 years was unchanged (47.2), and the rate for women aged 40–44 years increased 10% (to 10.3). Sources: Hamilton BE, Martin JA, Ventura SJ. Births: Preliminary data for 2011. Natl Vital Stat Rep 2012;61(5). Martin JA, Hamilton BE, Ventura SJ, Osterman MJK, Wilson EC, Mathews TJ. Births: final data for 2010. Natl Vital Stat Rep 2012;61(1). National Center for Health Statistics. Vital statistics of the United States, 2003, volume I, natality. Hyattsville, MD: US Department of Health and Human Services, CDC, National Center for Health Statistics; 2005. Available at http://www.cdc.gov/nchs/products/vsus.htm#natab2003. Reported by: Stephanie J. Ventura, MA, sventura@cdc.gov, 301-458-4547; Brady E. Hamilton, PhD. Alternate Text: The figure above shows birth rates among women aged 15-44 years, by maternal age group, in the United States during 1961, 2007, and 2011. During 1961-2011, birth rates decreased for all women aged 15-44 years. During 2007-2011, birth rates decreased for all women aged <35 years, with rates for women aged 20-24 years (85.3 per 1,000 population) and those aged 15-19 years (31.3) reaching historic lows. The birth rate for women aged 25-29 years decreased 9% (to 107.2), and the rate for women aged 30-34 years decreased 6% (to 96.5). The birth rate for women aged 35-39 years was unchanged (47.2), and the rate for women aged 40-44 years increased 10% (to 10.3). Syndicated Content Details:
Source URL: http://www.cdc.gov/mmwr/preview/mmwrhtml/mm6147a7.htm Source Agency: Centers for Disease Control and Prevention (CDC) Captured Date: 2016-05-23 22:15:39.0
|