Persons using assistive technology might not be able to fully access information in this file. For assistance, please send e-mail to: mmwrq@cdc.gov. Type 508 Accommodation and the title of the report in the subject line of e-mail.
Notifiable Diseases and Mortality Tables
Table I Summary of provisional cases of selected notifiable diseases, United States, cumulative, week ending December 22, 2012 (51st Week)
Figure I Selected notifiable disease reports, United States, comparison of provisional 4-week totals ending December 22, 2012, with historical data
Table II Provisional cases of selected notifiable diseases, United States, weeks ending December 22, 2012 and December 24, 2011 (51st Week)
Table III Deaths in 122 U.S. cities, week ending December 22, 2012 (51st Week)
TABLE I. Provisional cases of infrequently reported notifiable diseases (<1,000 cases reported during the preceding year) — United States, week ending December 22, 2012 (51st week)*
AR (1), FL (1), ME (1), MI (2), TX (1), WA (1), WI (1)
Listeriosis
10
642
19
870
821
851
759
808
NY (2), OH (1), FL (7)
Measles§§
—
55
1
220
63
71
140
43
Meningococcal disease, invasive¶¶:
A, C, Y, and W-135
1
116
7
257
280
301
330
325
WA (1)
serogroup B
—
76
3
159
135
174
188
167
other serogroup
2
14
0
20
12
23
38
35
OK (2)
unknown serogroup
5
289
11
323
406
482
616
550
PA (1), MN (1), TN (1), AZ (1), OR (1)
Novel influenza A virus infections***
—
311
7
14
4
43,774
2
4
Plague
—
3
—
3
2
8
3
7
Poliomyelitis, paralytic
—
—
0
—
—
1
—
—
Polio virus Infection, nonparalytic§
—
—
—
—
—
—
—
—
Psittacosis§
—
2
0
2
4
9
8
12
Q fever, total§
—
116
4
134
131
113
120
171
acute
—
99
2
110
106
93
106
—
chronic
—
17
1
24
25
20
14
—
Rabies, human
—
1
0
6
2
4
2
1
Rubella†††
—
8
—
4
5
3
16
12
Rubella, congenital syndrome
—
2
—
—
—
2
—
—
SARS-CoV§
—
—
—
—
—
—
—
—
Smallpox§
—
—
—
—
—
—
—
—
Streptococcal toxic-shock syndrome§
—
112
5
168
142
161
157
132
Syphilis, congenital (age <1 yr)§§§
—
203
8
358
377
423
431
430
Tetanus
—
34
1
36
26
18
19
28
Toxic-shock syndrome (staphylococcal)§
1
61
2
78
82
74
71
92
OH (1)
Trichinellosis
—
15
0
15
7
13
39
5
Tularemia
—
152
2
166
124
93
123
137
Typhoid fever
—
271
9
390
467
397
449
434
Vancomycin-intermediate Staphylococcus aureus§
1
80
2
82
91
78
63
37
NY (1)
Vancomycin-resistant Staphylococcus aureus§
—
1
0
—
2
1
—
2
Vibriosis (noncholera Vibrio species infections)§
11
931
12
832
846
789
588
549
GA (1), FL (9), WA (1)
Viral hemorrhagic fever¶¶¶
—
—
—
—
1
NN
NN
NN
Yellow fever
—
—
—
—
—
—
—
—
See Table 1 footnotes on next page.
TABLE I. (Continued) Provisional cases of infrequently reported notifiable diseases (<1,000 cases reported during the preceding year) — United States, week ending December 22, 2012 (51st week)*
—: No reported cases. N: Not reportable. NN: Not Nationally Notifiable. Cum: Cumulative year-to-date counts.
* Case counts for reporting year 2012 are provisional and subject to change. For further information on interpretation of these data, see http://wwwn.cdc.gov/nndss/document/ProvisionalNationaNotifiableDiseasesSurveillanceData20100927.pdf.
† Calculated by summing the incidence counts for the current week, the 2 weeks preceding the current week, and the 2 weeks following the current week, for a total of 5 preceding years. The total sum of incident cases is then divided by 25 weeks. Additional information is available at http://wwwn.cdc.gov/nndss/document/5yearweeklyaverage.pdf.
§ Not reportable in all states. Data from states where the condition is not reportable are excluded from this table except starting in 2007 for the arboviral diseases, STD data, TB data, and influenza-associated pediatric mortality, and in 2003 for SARS-CoV. Reporting exceptions are available at http://wwwn.cdc.gov/nndss/document/SRCA_FINAL_REPORT_2006-2010.xlsx.
¶ Includes both neuroinvasive and nonneuroinvasive. Updated weekly from reports to the Division of Vector-Borne Infectious Diseases, National Center for Zoonotic, Vector-Borne, and Enteric Diseases (ArboNET Surveillance). Data for West Nile virus are available in Table II.
** Data for H. influenzae (all ages, all serotypes) are available in Table II.
†† Updated weekly from reports to the Influenza Division, National Center for Immunization and Respiratory Diseases. Since September 30, 2012, sixteen influenza-associated pediatric deaths occurring during the 2012-13 influenza season have been reported.
§§ No measles cases were reported for the current week.
¶¶ Data for meningococcal disease (all serogroups) are available in Table II.
*** CDC discontinued reporting of individual confirmed and probable cases of 2009 pandemic influenza A (H1N1) virus infections on July 24, 2009. During 2009, four cases of human infection with novel influenza A viruses, different from the 2009 pandemic influenza A (H1N1) strain, were reported to CDC. The four cases of novel influenza A virus infection reported to CDC during 2010, the fourteen cases reported during 2011, and the 311 cases reported in 2012 are different from the 2009 pandemic influenza A (H1N1) virus. Total case counts are provided by the Influenza Division, National Center for Immunization and Respiratory Diseases (NCIRD).
††† No rubella cases were reported for the current week.
§§§ Updated weekly from reports to the Division of STD Prevention, National Center for HIV/AIDS, Viral Hepatitis, STD, and TB Prevention.
¶¶¶ There were no cases of viral hemorrhagic fever reported during the current week. See Table II for dengue hemorrhagic fever.
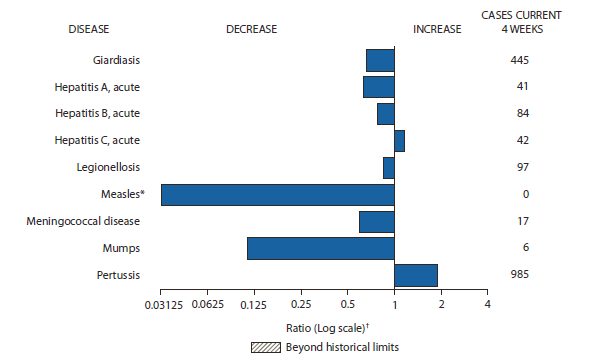
FIGURE I. Selected notifiable disease reports, United States, comparison of provisional 4-week totals December 22, 2012, with historical data
* No measles cases were reported for the current 4-week period yielding a ratio for week 51 of zero (0).
† Ratio of current 4-week total to mean of 15 4-week totals (from previous, comparable, and subsequent 4-week periods for the past 5 years). The point where the hatched area begins is based on the mean and two standard deviations of these 4-week totals.
Alternate Text: The figure above shows selected notifiable disease reports for the United States, with comparison of provisional 4-week totals through December 22, 2012, with historical data. Reports of acute hepatitis C, and pertussis increased. Reports of giardiasis, acute hepatitis A, acute hepatitis B, legionellosis, measles, meningococcal disease, and mumps decreased.
TABLE II. Provisional cases of selected notifiable diseases, United States, weeks ending December 22, 2012, and December 24, 2011 (51st week)*
Reporting area
Chlamydia trachomatis infection
Coccidioidomycosis
Cryptosporidiosis
Current week
Previous 52 weeks
Cum 2012
Cum 2011
Current week
Previous 52 weeks
Cum 2012
Cum 2011
Current week
Previous 52 weeks
Cum 2012
Cum 2011
Med
Max
Med
Max
Med
Max
United States
7,261
26,878
29,676
1,303,834
1,385,616
152
327
589
16,840
22,164
46
126
279
6,935
9,124
New England
620
956
1,807
46,212
46,339
—
0
1
2
2
—
7
19
379
411
Connecticut
—
234
1,268
11,490
12,381
N
0
0
N
N
—
1
3
36
71
Maine
—
64
101
2,933
3,034
N
0
0
N
N
—
1
4
66
49
Massachusetts
478
459
706
23,249
22,388
—
0
0
—
—
—
3
8
149
166
New Hampshire
26
59
85
2,862
2,974
—
0
1
1
1
—
1
4
41
66
Rhode Island
99
84
186
4,252
4,088
—
0
1
1
1
—
0
3
16
12
Vermont
17
27
87
1,426
1,474
N
0
0
N
N
—
1
6
71
47
Mid. Atlantic
1,924
3,490
4,469
170,225
177,387
—
0
1
4
6
6
12
41
723
889
New Jersey
197
548
640
26,725
26,084
N
0
0
N
N
—
0
4
23
56
New York (Upstate)
878
721
2,215
36,623
35,279
N
0
0
N
N
2
3
18
206
224
New York City
—
1,124
1,322
52,463
64,445
N
0
0
N
N
—
2
8
105
85
Pennsylvania
849
1,097
1,342
54,414
51,579
—
0
1
4
6
4
7
21
389
524
E.N. Central
967
4,127
4,676
197,781
216,960
2
1
4
51
54
15
30
108
1,719
2,661
Illinois
46
1,113
1,508
53,816
64,074
N
0
0
N
N
—
3
8
159
211
Indiana
204
563
838
28,121
27,722
N
0
0
N
N
—
2
7
131
260
Michigan
425
927
1,191
42,536
48,871
—
0
3
30
35
2
6
40
328
354
Ohio
292
1,033
1,188
50,628
51,959
2
0
2
21
19
13
11
28
564
1,100
Wisconsin
—
466
548
22,680
24,334
—
0
0
—
—
—
9
41
537
736
W.N. Central
8
1,560
1,809
75,849
77,681
—
2
8
121
129
—
16
42
855
1,547
Iowa
8
213
387
10,724
10,660
N
0
0
N
N
—
5
22
306
362
Kansas
—
210
309
10,701
10,449
N
0
0
N
N
—
1
4
53
42
Minnesota
—
308
382
14,953
16,704
—
2
7
106
103
—
0
5
—
304
Missouri
—
548
657
26,900
27,491
—
0
2
14
18
—
4
11
222
493
Nebraska
—
131
185
6,352
6,619
—
0
1
1
8
—
2
10
127
174
North Dakota
—
52
73
2,511
2,406
N
0
0
N
N
—
1
5
37
27
South Dakota
—
73
106
3,708
3,352
N
0
0
N
N
—
2
6
110
145
S. Atlantic
2,228
5,358
7,543
266,402
285,558
—
0
1
5
5
20
19
59
1,101
1,213
Delaware
131
81
182
4,116
4,326
—
0
0
—
—
—
0
4
15
7
District of Columbia
—
135
224
6,373
6,524
—
0
0
—
—
N
0
0
N
N
Florida
829
1,500
1,731
75,669
74,710
N
0
0
N
N
14
9
24
457
427
Georgia
782
975
1,285
48,539
53,118
N
0
0
N
N
4
5
15
249
304
Maryland
—
406
1,128
22,817
26,608
—
0
1
5
5
1
1
7
85
67
North Carolina
486
917
1,572
44,190
53,859
N
0
0
N
N
—
0
29
86
115
South Carolina
—
527
1,278
26,663
27,654
N
0
0
N
N
—
1
4
68
132
Virginia
—
685
1,780
33,458
34,534
N
0
0
N
N
1
3
6
137
134
West Virginia
—
89
149
4,577
4,225
N
0
0
N
N
—
0
4
4
27
E.S. Central
511
1,994
2,647
99,541
97,341
—
0
0
—
—
1
5
14
267
451
Alabama
—
592
862
28,159
29,195
N
0
0
N
N
1
2
6
103
135
Kentucky
269
334
787
17,335
16,340
N
0
0
N
N
—
1
4
52
177
Mississippi
—
425
792
22,471
21,105
N
0
0
N
N
—
1
4
40
49
Tennessee
242
640
827
31,576
30,701
N
0
0
N
N
—
1
5
72
90
W.S. Central
—
3,247
4,334
161,173
183,863
—
0
1
3
3
2
9
19
471
697
Arkansas
—
327
412
15,849
15,846
N
0
0
N
N
—
1
5
37
31
Louisiana
—
411
1,316
22,657
31,130
—
0
1
3
3
—
2
7
122
87
Oklahoma
—
80
1,015
3,994
13,581
N
0
0
N
N
1
2
6
84
85
Texas
—
2,412
3,102
118,673
123,306
N
0
0
N
N
1
4
13
228
494
Mountain
540
1,788
2,072
88,217
88,726
146
249
478
12,930
16,367
1
11
44
760
634
Arizona
119
597
872
29,536
28,778
146
245
476
12,747
16,126
—
1
3
38
45
Colorado
419
417
557
21,370
21,447
N
0
0
N
N
—
2
7
94
145
Idaho
—
84
146
4,163
4,584
N
0
0
N
N
1
3
25
257
110
Montana
—
74
108
3,682
3,349
—
0
1
2
5
—
1
4
56
77
Nevada
—
209
322
9,599
10,346
—
2
7
104
102
—
0
2
9
17
New Mexico
—
205
463
11,091
11,193
—
0
4
24
73
—
1
7
91
133
Utah
2
146
180
7,146
6,980
—
1
4
48
58
—
2
19
184
62
Wyoming
—
35
62
1,630
2,049
—
0
2
5
3
—
0
4
31
45
Pacific
463
4,105
4,632
198,434
211,761
4
71
143
3,724
5,598
1
12
25
660
621
Alaska
26
105
150
5,336
5,718
N
0
0
N
N
—
0
1
6
12
California
437
3,153
3,541
151,624
163,692
4
71
143
3,721
5,585
1
7
15
352
327
Hawaii
—
121
148
5,630
5,907
N
0
0
N
N
—
0
1
6
1
Oregon
—
263
368
13,178
13,531
—
0
1
3
13
—
4
11
214
201
Washington
—
462
607
22,666
22,913
—
0
10
—
—
—
1
13
82
80
Territories
American Samoa
—
0
59
59
—
N
0
0
N
N
N
0
0
N
N
C.N.M.I.
—
—
—
—
—
—
—
—
—
—
—
—
—
—
—
Guam
—
22
22
—
1,049
—
0
0
—
—
—
0
0
—
—
Puerto Rico
—
108
307
5,848
5,457
N
0
0
N
N
N
0
0
N
N
U.S. Virgin Islands
—
14
29
733
808
—
0
0
—
—
—
0
0
—
—
C.N.M.I.: Commonwealth of Northern Mariana Islands.
U: Unavailable. —: No reported cases. N: Not reportable. NN: Not Nationally Notifiable. Cum: Cumulative year-to-date counts. Med: Median. Max: Maximum.
TABLE II. (Continued) Provisional cases of selected notifiable diseases, United States, weeks ending December 22, 2012, and December 24, 2011 (51st week)*
Reporting area
Dengue Virus Infection
Dengue Fever†
Dengue Hemorrhagic Fever§
Current week
Previous 52 weeks
Cum 2012
Cum 2011
Current week
Previous 52 weeks
Cum 2012
Cum 2011
Med
Max
Med
Max
United States
—
5
26
356
249
—
0
1
2
3
New England
—
0
3
16
4
—
0
0
—
—
Connecticut
—
0
3
15
1
—
0
0
—
—
Maine
—
0
0
—
—
—
0
0
—
—
Massachusetts
—
0
0
—
—
—
0
0
—
—
New Hampshire
—
0
0
—
—
—
0
0
—
—
Rhode Island
—
0
0
—
—
—
0
0
—
—
Vermont
—
0
1
1
3
—
0
0
—
—
Mid. Atlantic
—
1
8
81
69
—
0
0
—
—
New Jersey
—
0
0
—
—
—
0
0
—
—
New York (Upstate)
—
0
0
—
8
—
0
0
—
—
New York City
—
1
7
64
45
—
0
0
—
—
Pennsylvania
—
0
2
17
16
—
0
0
—
—
E.N. Central
—
1
3
40
21
—
0
1
1
2
Illinois
—
0
2
16
6
—
0
1
1
2
Indiana
—
0
2
5
2
—
0
0
—
—
Michigan
—
0
1
4
6
—
0
0
—
—
Ohio
—
0
1
6
2
—
0
0
—
—
Wisconsin
—
0
1
9
5
—
0
0
—
—
W.N. Central
—
0
2
7
13
—
0
0
—
—
Iowa
—
0
1
2
5
—
0
0
—
—
Kansas
—
0
0
—
1
—
0
0
—
—
Minnesota
—
0
0
—
6
—
0
0
—
—
Missouri
—
0
1
4
—
—
0
0
—
—
Nebraska
—
0
0
—
—
—
0
0
—
—
North Dakota
—
0
0
—
1
—
0
0
—
—
South Dakota
—
0
1
1
—
—
0
0
—
—
S. Atlantic
—
2
12
130
90
—
0
0
—
1
Delaware
—
0
0
—
2
—
0
0
—
—
District of Columbia
—
0
0
—
—
—
0
0
—
—
Florida
—
1
9
104
65
—
0
0
—
—
Georgia
—
0
2
9
6
—
0
0
—
—
Maryland
—
0
1
2
5
—
0
0
—
—
North Carolina
—
0
1
5
4
—
0
0
—
—
South Carolina
—
0
1
2
1
—
0
0
—
—
Virginia
—
0
2
8
7
—
0
0
—
1
West Virginia
—
0
0
—
—
—
0
0
—
—
E.S. Central
—
0
2
10
11
—
0
0
—
—
Alabama
—
0
2
3
4
—
0
0
—
—
Kentucky
—
0
1
1
4
—
0
0
—
—
Mississippi
—
0
1
1
—
—
0
0
—
—
Tennessee
—
0
2
5
3
—
0
0
—
—
W.S. Central
—
0
1
9
10
—
0
0
—
—
Arkansas
—
0
0
—
—
—
0
0
—
—
Louisiana
—
0
0
—
3
—
0
0
—
—
Oklahoma
—
0
1
1
—
—
0
0
—
—
Texas
—
0
1
8
7
—
0
0
—
—
Mountain
—
0
1
6
6
—
0
0
—
—
Arizona
—
0
1
1
2
—
0
0
—
—
Colorado
—
0
0
—
—
—
0
0
—
—
Idaho
—
0
1
1
—
—
0
0
—
—
Montana
—
0
1
2
—
—
0
0
—
—
Nevada
—
0
1
2
1
—
0
0
—
—
New Mexico
—
0
0
—
2
—
0
0
—
—
Utah
—
0
0
—
1
—
0
0
—
—
Wyoming
—
0
0
—
—
—
0
0
—
—
Pacific
—
1
5
57
25
—
0
1
1
—
Alaska
—
0
1
1
—
—
0
0
—
—
California
—
0
4
35
5
—
0
0
—
—
Hawaii
—
0
2
6
11
—
0
0
—
—
Oregon
—
0
0
—
—
—
0
0
—
—
Washington
—
0
2
15
9
—
0
1
1
—
Territories
American Samoa
—
0
0
—
—
—
0
0
—
—
C.N.M.I.
—
—
—
—
—
—
—
—
—
—
Guam
—
0
0
—
—
—
0
0
—
—
Puerto Rico
—
44
298
4,411
1,478
—
0
3
25
34
U.S. Virgin Islands
—
0
0
—
—
—
0
0
—
—
C.N.M.I.: Commonwealth of Northern Mariana Islands.
U: Unavailable. —: No reported cases. N: Not reportable. NN: Not Nationally Notifiable. Cum: Cumulative year-to-date counts. Med: Median. Max: Maximum.
† Dengue Fever includes cases that meet criteria for Dengue Fever with hemorrhage, other clinical and unknown case classifications.
§ DHF includes cases that meet criteria for dengue shock syndrome (DSS), a more severe form of DHF.
TABLE II. (Continued) Provisional cases of selected notifiable diseases, United States, weeks ending December 22, 2012, and December 24, 2011 (51st week)*
Reporting area
Ehrlichiosis/Anaplasmosis†
Ehrlichia chaffeensis
Anaplasma phagocytophilum
Undetermined
Current week
Previous 52 weeks
Cum 2012
Cum 2011
Current week
Previous 52 weeks
Cum 2012
Cum 2011
Current week
Previous 52 weeks
Cum 2012
Cum 2011
Med
Max
Med
Max
Med
Max
United States
3
12
66
882
784
3
13
64
766
2,511
—
2
14
135
145
New England
—
0
4
29
4
1
4
19
286
458
—
0
1
1
2
Connecticut
—
0
0
—
—
—
1
10
97
150
—
0
0
—
—
Maine
—
0
2
5
1
1
1
4
50
26
—
0
0
—
—
Massachusetts
—
0
0
—
—
—
0
0
—
172
—
0
0
—
—
New Hampshire
—
0
1
4
1
—
1
5
53
30
—
0
0
—
1
Rhode Island
—
0
3
20
2
—
1
11
74
72
—
0
1
1
1
Vermont
—
0
0
—
—
—
0
2
12
8
—
0
0
—
—
Mid. Atlantic
2
0
6
43
107
2
5
44
308
438
—
0
2
12
23
New Jersey
—
0
1
—
59
—
0
6
1
123
—
0
0
—
7
New York (Upstate)
2
0
3
24
41
2
4
41
273
273
—
0
2
12
9
New York City
—
0
3
19
4
—
0
4
34
36
—
0
0
—
—
Pennsylvania
—
0
0
—
3
—
0
0
—
6
—
0
1
—
7
E.N. Central
—
0
4
41
42
—
1
4
45
709
—
1
9
85
58
Illinois
—
0
4
36
25
—
0
1
12
11
—
0
1
1
—
Indiana
—
0
0
—
—
—
0
0
—
—
—
0
7
68
18
Michigan
—
0
0
—
4
—
0
0
—
—
—
0
1
5
5
Ohio
—
0
1
3
6
—
0
1
1
9
—
0
1
1
1
Wisconsin
—
0
1
2
7
—
0
3
32
689
—
0
2
10
34
W.N. Central
—
2
33
271
177
—
0
4
40
805
—
0
4
16
25
Iowa
N
0
0
N
N
N
0
0
N
N
N
0
0
N
N
Kansas
—
0
4
33
18
—
0
2
8
6
—
0
0
—
1
Minnesota
—
0
0
—
7
—
0
1
3
770
—
0
1
1
10
Missouri
—
2
32
238
150
—
0
4
27
25
—
0
4
14
13
Nebraska
—
0
0
—
1
—
0
1
2
1
—
0
0
—
1
North Dakota
—
0
0
—
—
—
0
3
—
—
—
0
0
—
—
South Dakota
—
0
0
—
1
—
0
0
—
3
—
0
1
1
—
S. Atlantic
1
5
30
304
261
—
1
8
52
70
—
0
2
7
15
Delaware
—
0
2
15
15
—
0
1
1
1
—
0
0
—
—
District of Columbia
N
0
0
N
N
N
0
0
N
N
N
0
0
N
N
Florida
1
0
3
22
15
—
0
2
5
11
—
0
0
—
—
Georgia
—
0
4
14
23
—
0
1
2
11
—
0
0
—
3
Maryland
—
0
4
33
33
—
0
2
7
7
—
0
0
—
—
North Carolina
—
0
19
99
75
—
0
6
20
19
—
0
0
—
1
South Carolina
—
0
1
2
2
—
0
0
—
—
—
0
0
—
1
Virginia
—
1
16
119
97
—
0
2
16
21
—
0
2
6
9
West Virginia
—
0
0
—
1
—
0
1
1
—
—
0
1
1
1
E.S. Central
—
1
9
96
78
—
0
3
25
15
—
0
2
10
14
Alabama
—
0
2
11
5
—
0
3
10
4
—
0
1
5
—
Kentucky
—
0
4
25
16
—
0
1
1
—
—
0
0
—
—
Mississippi
—
0
1
1
3
—
0
1
1
1
—
0
1
1
—
Tennessee
—
1
6
59
54
—
0
2
13
10
—
0
1
4
14
W.S. Central
—
1
52
98
115
—
0
11
10
9
—
0
1
1
1
Arkansas
—
0
11
79
53
—
0
2
7
6
—
0
0
—
—
Louisiana
—
0
1
1
—
—
0
0
—
1
—
0
1
1
1
Oklahoma
—
0
51
15
59
—
0
7
2
2
—
0
0
—
—
Texas
—
0
1
3
3
—
0
2
1
—
—
0
0
—
—
Mountain
—
0
0
—
—
—
0
0
—
1
—
0
1
1
5
Arizona
—
0
0
—
—
—
0
0
—
—
—
0
1
1
4
Colorado
N
0
0
N
N
N
0
0
N
N
N
0
0
N
N
Idaho
N
0
0
N
N
N
0
0
N
N
N
0
0
N
N
Montana
N
0
0
N
N
N
0
0
N
N
N
0
0
N
N
Nevada
—
0
0
—
—
—
0
0
—
—
—
0
0
—
—
New Mexico
N
0
0
N
N
N
0
0
N
N
N
0
0
N
N
Utah
—
0
0
—
—
—
0
0
—
—
—
0
0
—
1
Wyoming
—
0
0
—
—
—
0
0
—
1
—
0
0
—
—
Pacific
—
0
1
—
—
—
0
1
—
6
—
0
1
2
2
Alaska
N
0
0
N
N
N
0
0
N
N
N
0
0
N
N
California
—
0
0
—
—
—
0
0
—
—
—
0
1
2
2
Hawaii
N
0
0
N
N
N
0
0
N
N
N
0
0
N
N
Oregon
—
0
0
—
—
—
0
1
—
6
—
0
0
—
—
Washington
—
0
1
—
—
—
0
0
—
—
—
0
0
—
—
Territories
American Samoa
N
0
0
N
N
N
0
0
N
N
N
0
0
N
N
C.N.M.I.
—
—
—
—
—
—
—
—
—
—
—
—
—
—
—
Guam
N
0
0
N
N
N
0
0
N
N
N
0
0
N
N
Puerto Rico
N
0
0
N
N
N
0
0
N
N
N
0
0
N
N
U.S. Virgin Islands
—
0
0
—
—
—
0
0
—
—
—
0
0
—
—
C.N.M.I.: Commonwealth of Northern Mariana Islands.
U: Unavailable. —: No reported cases. N: Not reportable. NN: Not Nationally Notifiable. Cum: Cumulative year-to-date counts. Med: Median. Max: Maximum.
† Cumulative total E. ewingii cases reported for year 2011 = 13, and 13 cases reported for 2012.
TABLE II. (Continued) Provisional cases of selected notifiable diseases, United States, weeks ending December 22, 2012, and December 24, 2011 (51st week)*
Reporting area
Giardiasis
Gonorrhea
Haemophilus influenzae, invasive† All ages, all serotypes
Current week
Previous 52 weeks
Cum 2012
Cum 2011
Current week
Previous 52 weeks
Cum 2012
Cum 2011
Current week
Previous 52 weeks
Cum 2012
Cum 2011
Med
Max
Med
Max
Med
Max
United States
125
242
495
12,916
16,252
1,734
6,098
7,057
305,246
315,608
31
61
151
3,091
3,388
New England
4
24
50
1,320
1,558
76
112
238
5,588
5,374
1
3
15
190
237
Connecticut
—
4
9
204
230
—
40
161
1,885
2,288
—
1
5
51
61
Maine
1
3
10
167
170
—
9
18
390
263
—
0
2
21
25
Massachusetts
—
13
28
639
736
55
49
99
2,594
2,317
—
2
8
101
113
New Hampshire
—
1
6
85
130
2
2
10
134
123
—
0
2
2
17
Rhode Island
1
0
10
53
69
9
9
25
493
335
—
0
2
7
14
Vermont
2
3
10
172
223
10
1
6
92
48
1
0
1
8
7
Mid. Atlantic
28
44
76
2,343
3,228
428
866
1,091
42,562
40,733
7
13
32
669
739
New Jersey
—
0
10
75
431
40
147
200
7,341
7,314
—
2
6
96
122
New York (Upstate)
9
16
47
819
1,097
166
145
440
7,434
5,800
3
3
19
167
176
New York City
9
16
26
829
911
—
263
346
12,535
14,247
1
3
9
172
182
Pennsylvania
10
12
22
620
789
222
303
398
15,252
13,372
3
4
16
234
259
E.N. Central
12
40
69
2,020
2,612
252
1,047
1,291
52,132
57,252
3
9
26
477
619
Illinois
—
6
14
310
402
14
287
372
13,712
16,797
—
3
7
137
182
Indiana
—
4
9
203
323
55
140
203
6,989
6,550
—
2
6
87
111
Michigan
2
10
21
490
538
100
238
360
11,277
12,724
3
1
4
70
69
Ohio
10
11
30
579
783
83
314
395
15,604
16,473
—
3
8
154
167
Wisconsin
—
8
22
438
566
—
89
149
4,550
4,708
—
0
5
29
90
W.N. Central
3
20
42
985
1,732
6
336
432
16,526
16,181
—
5
9
219
216
Iowa
3
5
11
247
268
3
35
87
1,876
1,916
—
0
0
—
3
Kansas
—
2
6
104
138
—
42
76
2,139
2,172
—
0
3
27
23
Minnesota
—
0
12
—
660
3
49
87
2,558
2,242
—
1
5
78
68
Missouri
—
6
13
297
341
—
155
198
7,664
7,696
—
1
6
77
78
Nebraska
—
2
11
149
177
—
28
48
1,372
1,309
—
0
3
22
30
North Dakota
—
1
15
54
39
—
6
10
272
249
—
0
3
15
13
South Dakota
—
3
9
134
109
—
13
25
645
597
—
0
0
—
1
S. Atlantic
47
46
102
2,254
2,654
571
1,353
1,960
68,066
77,129
14
15
39
763
744
Delaware
—
0
2
23
34
22
16
35
850
792
—
0
2
6
6
District of Columbia
—
0
5
42
55
—
45
86
2,196
2,554
—
0
1
2
1
Florida
27
21
49
1,075
1,206
194
376
478
18,967
19,362
6
4
11
224
227
Georgia
7
8
26
472
644
219
282
426
13,896
16,002
1
3
9
154
134
Maryland
5
5
10
243
281
—
92
227
4,911
6,304
—
2
6
89
91
North Carolina
N
0
0
N
N
136
267
488
12,422
17,162
2
1
9
96
83
South Carolina
1
2
6
123
117
—
149
391
7,404
7,959
2
1
4
60
77
Virginia
5
5
18
244
272
—
133
309
6,618
6,209
2
2
7
91
102
West Virginia
2
0
17
32
45
—
14
32
802
785
1
1
14
41
23
E.S. Central
3
3
14
157
169
149
545
790
28,258
26,814
4
4
12
193
213
Alabama
3
3
14
157
169
—
179
255
8,449
9,007
—
1
4
50
54
Kentucky
N
0
0
N
N
81
84
215
4,309
4,449
—
0
3
31
41
Mississippi
N
0
0
N
N
—
122
242
6,683
5,785
—
0
3
20
18
Tennessee
N
0
0
N
N
68
171
255
8,817
7,573
4
1
8
92
100
W.S. Central
—
5
16
280
340
—
845
1,099
42,175
48,273
1
3
14
170
153
Arkansas
—
2
6
100
118
—
82
123
4,131
4,642
—
0
3
27
33
Louisiana
—
3
10
180
222
—
138
404
7,188
9,031
—
1
4
41
52
Oklahoma
—
0
0
—
—
—
19
162
1,042
4,053
1
2
13
100
66
Texas
N
0
0
N
N
—
607
741
29,814
30,547
—
0
1
2
2
Mountain
3
19
47
1,074
1,312
97
249
323
12,769
11,112
—
5
17
262
288
Arizona
—
2
5
103
132
36
111
161
5,646
4,466
—
1
6
90
92
Colorado
—
7
15
360
443
61
54
81
2,775
2,330
—
1
5
54
65
Idaho
2
2
8
139
176
—
3
11
148
151
—
0
2
18
21
Montana
—
1
4
46
86
—
2
6
101
82
—
0
2
5
3
Nevada
—
1
5
75
79
—
41
77
1,978
1,952
—
0
2
17
17
New Mexico
1
1
7
79
105
—
34
60
1,650
1,817
—
1
5
43
47
Utah
—
4
15
236
252
—
8
18
437
269
—
0
4
30
41
Wyoming
—
1
2
36
39
—
1
4
34
45
—
0
1
5
2
Pacific
25
49
185
2,483
2,647
155
738
892
37,170
32,740
1
3
9
148
179
Alaska
1
2
6
96
99
4
13
33
704
982
—
0
2
15
26
California
6
29
59
1,553
1,703
151
634
745
31,431
26,928
—
1
5
44
42
Hawaii
—
0
3
28
38
—
15
23
706
672
—
0
2
21
32
Oregon
6
7
15
362
424
—
27
43
1,374
1,471
—
1
6
67
72
Washington
12
8
146
444
383
—
58
98
2,955
2,687
1
0
1
1
7
Territories
American Samoa
—
0
0
—
—
—
0
0
—
—
—
0
0
—
—
C.N.M.I.
—
—
—
—
—
—
—
—
—
—
—
—
—
—
—
Guam
—
0
0
—
—
—
0
0
—
96
—
0
0
—
—
Puerto Rico
—
0
3
2
83
—
7
25
327
334
—
0
0
—
—
U.S. Virgin Islands
—
0
0
—
—
—
2
7
124
136
—
0
0
—
—
C.N.M.I.: Commonwealth of Northern Mariana Islands.
U: Unavailable. —: No reported cases. N: Not reportable. NN: Not Nationally Notifiable. Cum: Cumulative year-to-date counts. Med: Median. Max: Maximum.
† Data for H. influenzae (age <5 yrs for serotype b, nonserotype b, and unknown serotype) are available in Table I.
TABLE II. (Continued) Provisional cases of selected notifiable diseases, United States, weeks ending December 22, 2012, and December 24, 2011 (51st week)*
Reporting area
Hepatitis (viral, acute), by type
A
B
C
Current week
Previous 52 weeks
Cum 2012
Cum 2011
Current week
Previous 52 weeks
Cum 2012
Cum 2011
Current week
Previous 52 weeks
Cum 2012
Cum 2011
Med
Max
Med
Max
Med
Max
United States
21
26
58
1,381
1,340
23
52
131
2,543
2,772
6
32
65
1,482
1,166
New England
—
1
7
72
76
—
1
6
82
95
—
1
5
64
87
Connecticut
—
0
2
22
18
—
0
2
15
17
—
0
4
34
47
Maine
—
0
2
10
6
—
0
2
8
8
—
0
1
4
12
Massachusetts
—
0
3
32
39
—
1
4
49
67
—
0
2
20
22
New Hampshire
—
0
1
5
—
—
0
2
8
3
N
0
0
N
N
Rhode Island
—
0
1
1
7
U
0
0
U
U
U
0
0
U
U
Vermont
—
0
1
2
6
—
0
1
2
—
—
0
2
6
6
Mid. Atlantic
1
4
10
190
248
1
3
9
209
288
1
3
10
167
134
New Jersey
—
0
2
27
78
—
1
4
50
73
—
0
4
37
52
New York (Upstate)
—
1
4
62
45
1
1
3
44
52
1
1
5
70
40
New York City
—
1
4
43
66
—
1
5
59
79
—
0
2
8
8
Pennsylvania
1
1
5
58
59
—
1
4
56
84
—
1
4
52
34
E.N. Central
6
4
9
209
210
4
8
15
390
347
1
5
10
233
138
Illinois
—
1
5
59
70
—
1
5
62
84
—
0
3
24
6
Indiana
—
0
2
7
24
—
1
6
77
70
—
2
6
90
81
Michigan
2
2
6
89
69
—
1
7
66
89
1
2
6
99
30
Ohio
4
0
2
34
39
4
3
9
172
88
—
0
2
8
6
Wisconsin
—
0
2
20
8
—
0
3
13
16
—
0
2
12
15
W.N. Central
—
1
18
58
41
—
2
12
85
112
—
0
15
23
20
Iowa
—
0
2
6
8
—
0
2
10
15
—
0
0
—
—
Kansas
—
0
2
13
4
—
0
1
9
14
—
0
2
11
8
Minnesota
—
0
18
—
9
—
0
11
—
9
—
0
15
—
2
Missouri
—
0
3
21
13
—
1
3
57
60
—
0
1
6
8
Nebraska
—
0
3
16
5
—
0
1
7
12
—
0
1
1
2
North Dakota
—
0
1
2
—
—
0
0
—
—
—
0
0
—
—
South Dakota
—
0
0
—
2
—
0
1
2
2
—
0
3
5
—
S. Atlantic
12
5
11
261
211
6
14
47
694
728
1
7
15
368
277
Delaware
1
0
1
7
2
—
0
2
11
13
U
0
0
U
U
District of Columbia
—
0
0
—
—
—
0
0
—
—
—
0
0
—
—
Florida
9
2
7
86
80
5
4
11
239
206
1
2
5
101
60
Georgia
—
1
4
48
27
—
2
5
84
140
—
1
5
56
53
Maryland
1
0
3
28
25
—
1
6
48
60
—
1
3
38
34
North Carolina
1
0
4
34
31
—
1
5
69
108
—
1
6
60
60
South Carolina
—
0
2
5
10
—
1
3
40
38
—
0
1
1
1
Virginia
—
1
3
46
29
—
1
6
77
79
—
1
6
58
23
West Virginia
—
0
2
7
7
1
2
29
126
84
—
1
5
54
46
E.S. Central
—
1
5
71
48
3
10
21
510
507
2
6
12
284
242
Alabama
—
0
2
18
8
—
1
5
73
115
—
0
2
22
21
Kentucky
—
0
3
23
10
—
3
10
155
148
—
3
9
149
138
Mississippi
—
0
2
8
7
—
2
4
73
55
U
0
0
U
U
Tennessee
—
0
2
22
23
3
4
10
209
189
2
2
6
113
83
W.S. Central
2
3
13
154
144
9
5
37
310
386
—
2
12
119
85
Arkansas
—
0
2
8
2
—
1
3
63
54
—
0
1
2
—
Louisiana
—
0
1
5
5
—
0
4
36
59
—
0
1
4
7
Oklahoma
—
0
8
9
3
1
0
16
63
85
—
1
9
71
44
Texas
2
2
8
132
134
8
3
16
148
188
—
1
4
42
34
Mountain
—
3
9
158
127
—
1
4
81
88
—
2
6
96
82
Arizona
—
2
6
95
76
—
0
2
12
14
U
0
0
U
U
Colorado
—
0
3
27
21
—
0
2
20
23
—
1
4
40
26
Idaho
—
0
2
11
6
—
0
1
5
2
—
0
2
11
12
Montana
—
0
1
3
3
—
0
1
1
—
—
0
4
5
9
Nevada
—
0
1
9
5
—
0
3
27
29
—
0
2
9
10
New Mexico
—
0
2
9
6
—
0
1
3
10
—
0
3
20
14
Utah
—
0
1
4
8
—
0
2
13
10
—
0
2
11
9
Wyoming
—
0
0
—
2
—
0
0
—
—
—
0
0
—
2
Pacific
—
4
11
208
235
—
4
12
182
221
1
3
10
128
101
Alaska
—
0
1
1
4
—
0
2
5
3
—
0
0
—
2
California
—
3
10
166
184
—
2
7
114
152
—
1
5
57
48
Hawaii
—
0
2
6
8
—
0
1
5
6
—
0
0
—
—
Oregon
—
0
1
8
11
—
0
3
25
31
—
0
3
32
20
Washington
—
0
3
27
28
—
0
6
33
29
1
1
10
39
31
Territories
American Samoa
—
0
0
—
—
—
0
0
—
—
—
0
0
—
—
C.N.M.I.
—
—
—
—
—
—
—
—
—
—
—
—
—
—
—
Guam
—
0
0
—
43
—
0
0
—
120
—
0
0
—
70
Puerto Rico
—
0
1
—
21
—
0
1
4
27
N
0
0
N
N
U.S. Virgin Islands
—
0
0
—
—
—
0
5
—
5
—
0
0
—
—
C.N.M.I.: Commonwealth of Northern Mariana Islands.
U: Unavailable. —: No reported cases. N: Not reportable. NN: Not Nationally Notifiable. Cum: Cumulative year-to-date counts. Med: Median. Max: Maximum.
TABLE II. (Continued) Provisional cases of selected notifiable diseases, United States, weeks ending December 22, 2012, and December 24, 2011 (51st week)*
Reporting area
Legionellosis
Lyme disease
Malaria
Current week
Previous 52 weeks
Cum 2012
Cum 2011
Current week
Previous 52 weeks
Cum 2012
Cum 2011
Current week
Previous 52 weeks
Cum 2012
Cum 2011
Med
Max
Med
Max
Med
Max
United States
18
59
133
3,121
4,107
120
385
1,379
26,930
32,620
8
23
42
1,156
1,688
New England
1
5
19
276
402
1
109
591
8,582
8,570
—
1
5
62
108
Connecticut
—
1
7
49
80
—
33
173
2,122
3,026
—
0
1
4
20
Maine
—
0
3
18
18
—
15
69
1,072
998
—
0
1
4
6
Massachusetts
—
2
11
161
238
—
44
338
4,090
2,474
—
1
4
40
67
New Hampshire
—
0
2
15
25
—
9
51
655
1,293
—
0
2
6
3
Rhode Island
—
0
3
21
29
—
1
26
165
156
—
0
1
4
6
Vermont
1
0
2
12
12
1
7
29
478
623
—
0
1
4
6
Mid. Atlantic
3
15
43
844
1,331
86
194
654
12,539
13,815
1
5
13
272
432
New Jersey
—
2
12
128
235
—
52
166
3,177
4,229
—
0
1
—
97
New York (Upstate)
1
6
20
282
380
54
41
183
2,456
3,576
—
0
4
32
50
New York City
—
2
13
151
214
—
1
12
114
722
1
4
11
197
224
Pennsylvania
2
4
18
283
502
32
92
404
6,792
5,288
—
1
4
43
61
E.N. Central
4
12
37
643
854
—
22
162
2,026
4,085
—
2
8
133
173
Illinois
—
2
22
196
150
—
2
18
200
193
—
0
6
37
65
Indiana
—
2
5
100
69
—
1
6
67
94
—
0
2
20
14
Michigan
—
1
6
57
187
—
2
9
119
103
—
0
5
23
34
Ohio
4
5
17
284
380
—
1
6
61
53
—
1
3
41
41
Wisconsin
—
0
3
6
68
—
18
132
1,579
3,642
—
0
2
12
19
W.N. Central
—
3
10
173
118
—
2
21
237
2,283
—
1
5
44
108
Iowa
—
0
2
13
11
—
1
16
158
100
—
0
1
7
22
Kansas
—
0
1
11
13
—
0
3
16
17
—
0
2
7
10
Minnesota
—
1
4
46
29
—
0
7
29
2,122
—
0
0
—
46
Missouri
—
2
8
83
53
—
0
2
9
8
—
0
2
19
20
Nebraska
—
0
2
9
8
—
0
2
9
11
—
0
1
4
8
North Dakota
—
0
1
3
2
—
0
6
12
21
—
0
1
2
—
South Dakota
—
0
1
8
2
—
0
1
4
4
—
0
2
5
2
S. Atlantic
6
10
22
557
621
33
58
151
3,267
3,529
7
7
16
331
469
Delaware
—
0
2
17
24
—
11
30
638
859
—
0
1
2
7
District of Columbia
N
0
0
N
N
N
0
0
N
N
—
0
1
2
18
Florida
4
4
11
214
183
2
2
6
119
113
2
1
6
58
98
Georgia
—
1
3
42
54
—
0
4
21
32
—
1
5
54
89
Maryland
2
2
6
110
142
19
21
90
1,507
1,345
4
1
8
117
127
North Carolina
—
1
8
64
83
—
0
13
88
75
—
0
7
26
47
South Carolina
—
0
3
25
24
—
1
3
42
37
—
0
2
9
7
Virginia
—
1
7
73
86
12
13
51
768
972
1
1
4
63
75
West Virginia
—
0
7
12
25
—
1
22
84
96
—
0
0
—
1
E.S. Central
—
2
7
113
175
—
1
5
65
68
—
0
4
31
40
Alabama
—
0
2
18
28
—
0
2
23
24
—
0
2
9
9
Kentucky
—
0
4
26
53
—
0
4
11
3
—
0
1
9
10
Mississippi
—
0
2
17
14
—
0
1
3
5
—
0
1
2
1
Tennessee
—
1
4
52
80
—
0
4
28
36
—
0
2
11
20
W.S. Central
1
3
13
168
152
—
1
15
44
63
—
1
13
80
108
Arkansas
—
0
2
17
14
—
0
0
—
—
—
0
1
4
7
Louisiana
—
0
3
19
25
—
0
1
2
2
—
0
2
10
2
Oklahoma
—
0
9
14
9
—
0
2
—
—
—
0
4
22
6
Texas
1
2
7
118
104
—
1
13
42
61
—
1
9
44
93
Mountain
—
2
4
103
147
—
0
4
33
51
—
1
5
58
67
Arizona
—
0
4
32
46
—
0
3
14
15
—
0
2
15
21
Colorado
—
0
3
20
41
—
0
0
—
—
—
0
3
23
24
Idaho
—
0
2
5
9
—
0
1
4
4
—
0
1
7
2
Montana
—
0
1
3
1
—
0
1
1
11
—
0
0
—
2
Nevada
—
0
2
14
16
—
0
1
5
4
—
0
2
5
8
New Mexico
—
0
2
9
12
—
0
1
1
6
—
0
1
2
5
Utah
—
0
2
16
18
—
0
1
4
9
—
0
2
6
5
Wyoming
—
0
1
4
4
—
0
1
4
2
—
0
0
—
—
Pacific
3
5
18
244
307
—
2
8
137
156
—
3
8
145
183
Alaska
—
0
0
—
—
—
0
2
11
11
—
0
1
8
5
California
1
4
14
199
257
—
1
7
53
89
—
2
7
101
125
Hawaii
—
0
1
3
5
N
0
0
N
N
—
0
1
4
7
Oregon
1
0
3
22
22
—
1
5
59
38
—
0
4
11
22
Washington
1
0
14
20
23
—
0
4
14
18
—
0
2
21
24
Territories
American Samoa
N
0
0
N
N
N
0
0
N
N
—
0
0
—
1
C.N.M.I.
—
—
—
—
—
—
—
—
—
—
—
—
—
—
—
Guam
—
0
0
—
—
—
0
0
—
—
—
0
0
—
—
Puerto Rico
—
0
0
—
9
N
0
0
N
N
—
0
0
—
1
U.S. Virgin Islands
—
0
1
—
1
N
0
0
N
N
—
0
0
—
—
C.N.M.I.: Commonwealth of Northern Mariana Islands.
U: Unavailable. —: No reported cases. N: Not reportable. NN: Not Nationally Notifiable. Cum: Cumulative year-to-date counts. Med: Median. Max: Maximum.
TABLE II. (Continued) Provisional cases of selected notifiable diseases, United States, weeks ending December 22, 2012, and December 24, 2011 (51st week)*
Reporting area
Meningococcal disease, invasive† All serogroups
Mumps
Pertussis
Current week
Previous 52 weeks
Cum 2012
Cum 2011
Current week
Previous 52 weeks
Cum 2012
Cum 2011
Current week
Previous 52 weeks
Cum 2012
Cum 2011
Med
Max
Med
Max
Med
Max
United States
8
10
30
495
729
—
4
12
194
392
202
829
1,257
41,155
17,648
New England
—
0
3
15
29
—
0
1
5
11
29
39
99
2,366
837
Connecticut
—
0
1
4
3
—
0
0
—
—
—
3
9
165
66
Maine
—
0
1
3
5
—
0
0
—
2
6
10
37
688
202
Massachusetts
—
0
2
6
14
—
0
1
3
4
—
10
28
606
265
New Hampshire
—
0
0
—
1
—
0
1
1
—
—
2
19
213
168
Rhode Island
—
0
0
—
1
—
0
1
1
4
—
1
20
96
54
Vermont
—
0
1
2
5
—
0
0
—
1
23
9
42
598
82
Mid. Atlantic
1
1
4
80
89
—
0
3
26
54
50
105
199
5,603
2,106
New Jersey
—
0
2
13
12
—
0
0
—
13
—
15
40
748
292
New York (Upstate)
—
0
2
21
23
—
0
1
5
10
30
46
140
2,627
788
New York City
—
0
2
22
30
—
0
3
17
28
—
8
28
416
305
Pennsylvania
1
0
2
24
24
—
0
1
4
3
20
33
63
1,812
721
E.N. Central
—
1
5
64
110
—
1
3
54
108
34
175
350
9,613
4,341
Illinois
—
0
3
16
34
—
1
2
31
77
—
39
65
1,855
1,473
Indiana
—
0
1
7
25
—
0
2
4
3
—
7
18
373
357
Michigan
—
0
2
13
10
—
0
1
6
9
3
13
40
716
684
Ohio
—
0
2
24
24
—
0
1
6
15
31
16
37
880
745
Wisconsin
—
0
2
4
17
—
0
1
7
4
—
95
258
5,789
1,082
W.N. Central
1
1
4
41
63
—
0
2
21
34
—
109
228
5,823
1,587
Iowa
—
0
1
2
14
—
0
1
3
8
—
32
100
1,631
228
Kansas
—
0
1
6
5
—
0
1
4
4
—
14
30
731
139
Minnesota
1
0
3
12
15
—
0
1
7
1
—
35
86
2,086
646
Missouri
—
0
3
16
15
—
0
1
6
11
—
16
45
778
422
Nebraska
—
0
1
3
11
—
0
1
1
6
—
2
19
160
56
North Dakota
—
0
1
2
—
—
0
0
—
4
—
5
47
372
59
South Dakota
—
0
0
—
3
—
0
0
—
—
—
1
6
65
37
S. Atlantic
—
1
5
81
130
—
0
3
21
43
27
53
106
2,691
1,433
Delaware
—
0
1
1
1
—
0
0
—
—
1
1
3
54
27
District of Columbia
—
0
1
1
1
—
0
2
2
1
—
0
4
19
9
Florida
—
1
3
44
50
—
0
1
5
10
12
10
26
574
307
Georgia
—
0
2
10
14
—
0
2
3
5
—
4
15
262
175
Maryland
—
0
2
4
14
—
0
0
—
2
2
6
17
344
121
North Carolina
—
0
1
6
15
—
0
1
1
9
6
7
74
566
186
South Carolina
—
0
1
5
9
—
0
1
1
3
4
3
14
214
153
Virginia
—
0
2
5
18
—
0
1
7
13
2
11
25
566
378
West Virginia
—
0
3
5
8
—
0
1
2
—
—
1
24
92
77
E.S. Central
1
0
3
14
30
—
0
1
6
6
5
20
48
1,100
471
Alabama
—
0
1
5
11
—
0
1
1
2
1
4
9
193
139
Kentucky
—
0
2
1
8
—
0
1
1
—
—
8
35
553
175
Mississippi
—
0
1
2
3
—
0
1
2
3
—
1
4
75
48
Tennessee
1
0
1
6
8
—
0
1
2
1
4
5
14
279
109
W.S. Central
2
1
5
48
65
—
0
3
17
73
17
46
161
2,211
979
Arkansas
—
0
1
7
12
—
0
1
1
4
1
2
20
166
69
Louisiana
—
0
1
3
15
—
0
0
—
—
—
0
6
42
31
Oklahoma
2
0
2
7
10
—
0
1
1
4
2
0
34
127
52
Texas
—
0
3
31
28
—
0
3
15
65
14
40
134
1,876
827
Mountain
1
0
3
33
54
—
0
2
13
11
4
110
168
5,263
2,524
Arizona
1
0
1
4
16
—
0
2
3
—
—
18
36
908
852
Colorado
—
0
2
6
9
—
0
2
5
7
—
28
66
1,477
407
Idaho
—
0
1
4
7
—
0
0
—
2
3
4
14
224
190
Montana
—
0
1
7
4
—
0
1
1
—
—
5
48
442
133
Nevada
—
0
1
2
5
—
0
0
—
—
—
1
6
92
33
New Mexico
—
0
1
3
3
—
0
0
—
1
1
15
30
740
267
Utah
—
0
1
4
10
—
0
1
3
—
—
25
52
1,318
630
Wyoming
—
0
1
3
—
—
0
1
1
1
—
1
5
62
12
Pacific
2
2
10
119
159
—
1
2
31
52
36
126
311
6,485
3,370
Alaska
—
0
1
2
2
—
0
1
1
1
10
4
23
293
26
California
—
1
7
79
103
—
0
2
23
43
—
13
53
642
2,266
Hawaii
—
0
1
2
4
—
0
1
1
2
—
1
10
101
58
Oregon
1
0
4
25
31
—
0
1
5
4
—
13
54
894
309
Washington
1
0
3
11
19
—
0
1
1
2
26
83
254
4,555
711
Territories
American Samoa
—
0
0
—
—
—
0
0
—
—
—
0
0
—
—
C.N.M.I.
—
—
—
—
—
—
—
—
—
—
—
—
—
—
—
Guam
—
0
0
—
—
—
0
0
—
3
—
0
0
—
7
Puerto Rico
—
0
0
—
—
—
0
1
3
4
—
0
0
—
8
U.S. Virgin Islands
—
0
0
—
—
—
0
0
—
—
—
0
0
—
—
C.N.M.I.: Commonwealth of Northern Mariana Islands.
U: Unavailable. —: No reported cases. N: Not reportable. NN: Not Nationally Notifiable. Cum: Cumulative year-to-date counts. Med: Median. Max: Maximum.
† Data for meningococcal disease, invasive caused by serogroups A, C, Y, and W-135; serogroup B; other serogroup; and unknown serogroup are available in Table I.
TABLE II. (Continued) Provisional cases of selected notifiable diseases, United States, weeks ending December 22, 2012, and December 24, 2011 (51st week)*
Reporting area
Rabies, animal
Salmonellosis
Shiga toxin-producing E. coli (STEC)†
Current week
Previous 52 weeks
Cum 2012
Cum 2011
Current week
Previous 52 weeks
Cum 2012
Cum 2011
Current week
Previous 52 weeks
Cum 2012
Cum 2011
Med
Max
Med
Max
Med
Max
United States
12
73
127
3,546
4,256
334
993
1,640
48,814
50,796
35
116
194
5,546
5,874
New England
3
7
16
365
338
1
37
73
1,884
2,082
—
4
12
217
210
Connecticut
—
3
8
166
193
—
8
17
425
462
—
1
5
54
56
Maine
1
1
6
83
65
1
3
11
146
130
—
0
6
31
28
Massachusetts
—
0
0
—
—
—
21
54
997
1,039
—
2
7
92
79
New Hampshire
1
0
3
29
24
—
2
8
131
176
—
0
4
21
22
Rhode Island
—
0
5
28
25
—
2
7
100
191
—
0
1
2
8
Vermont
1
1
7
59
31
—
1
7
85
84
—
0
2
17
17
Mid. Atlantic
2
14
31
730
824
44
89
191
5,026
5,553
6
11
23
595
651
New Jersey
—
0
0
—
—
—
19
48
1,051
1,206
—
2
6
106
142
New York (Upstate)
2
7
20
417
364
22
23
64
1,265
1,374
5
4
13
221
213
New York City
—
0
0
—
13
7
20
49
1,155
1,115
1
1
7
83
88
Pennsylvania
—
7
15
313
447
15
26
78
1,555
1,858
—
3
11
185
208
E.N. Central
—
2
13
154
195
19
93
211
4,980
5,071
10
15
66
977
1,012
Illinois
—
1
6
63
51
—
33
79
1,855
1,669
—
3
12
180
239
Indiana
—
0
2
7
28
—
13
39
681
629
—
2
23
162
131
Michigan
—
0
5
45
65
6
15
46
865
849
1
3
41
276
151
Ohio
—
0
7
39
51
13
24
53
1,290
1,177
9
3
20
233
180
Wisconsin
N
0
0
N
N
—
4
17
289
747
—
2
13
126
311
W.N. Central
—
3
18
201
187
2
48
115
2,642
2,956
—
15
31
731
1,011
Iowa
—
0
5
32
25
2
9
30
602
445
—
3
15
179
186
Kansas
—
1
4
52
31
—
9
19
472
457
—
2
7
88
106
Minnesota
—
0
1
—
56
—
0
7
—
710
—
0
0
—
285
Missouri
—
0
3
30
29
—
19
48
1,081
895
—
5
20
310
281
Nebraska
—
0
0
—
33
—
4
26
270
249
—
1
8
75
103
North Dakota
—
0
13
30
13
—
1
19
57
40
—
0
4
34
9
South Dakota
—
1
7
57
—
—
3
9
160
160
—
1
4
45
41
S. Atlantic
—
19
45
975
1,113
150
278
603
14,866
14,994
5
12
69
706
612
Delaware
—
0
0
—
—
—
2
10
143
175
—
0
2
13
16
District of Columbia
—
0
0
—
—
—
0
3
35
89
—
0
1
4
6
Florida
—
0
34
103
120
104
115
274
6,459
5,828
2
4
10
222
102
Georgia
—
0
0
—
—
23
46
125
2,640
2,625
—
2
9
123
122
Maryland
—
6
16
305
299
3
16
43
912
1,002
1
1
5
74
71
North Carolina
—
0
0
—
—
2
28
166
2,129
2,459
2
1
60
155
152
South Carolina
N
0
0
N
N
11
23
66
1,335
1,551
—
0
7
24
18
Virginia
—
11
23
507
595
7
22
57
1,071
1,151
—
1
7
81
116
West Virginia
—
1
6
60
99
—
3
52
142
114
—
0
2
10
9
E.S. Central
—
1
5
70
161
16
61
202
3,914
4,303
4
5
14
273
294
Alabama
—
1
5
53
82
6
18
52
1,056
1,253
1
1
5
58
74
Kentucky
—
0
3
15
16
—
7
47
527
593
—
1
9
75
75
Mississippi
—
0
1
2
—
—
16
67
1,249
1,425
—
0
3
26
37
Tennessee
—
0
1
—
63
10
18
69
1,082
1,032
3
2
12
114
108
W.S. Central
7
11
58
754
1,120
77
136
408
7,515
7,959
6
10
92
542
563
Arkansas
3
0
35
128
57
12
16
229
1,381
819
—
1
4
55
61
Louisiana
—
0
0
—
6
—
24
58
1,326
1,424
—
0
3
25
20
Oklahoma
1
0
23
74
55
7
15
102
728
725
5
2
16
99
72
Texas
3
10
29
552
1,002
58
80
227
4,080
4,991
1
7
76
363
410
Mountain
—
1
16
97
72
8
45
82
2,270
2,563
1
11
41
681
697
Arizona
N
0
0
N
N
8
14
29
789
873
—
3
8
152
123
Colorado
—
0
0
—
—
—
10
19
501
518
—
3
9
169
168
Idaho
—
0
15
23
6
—
2
7
116
140
1
1
14
120
117
Montana
N
0
0
N
N
—
1
8
89
118
—
0
5
37
36
Nevada
—
0
4
16
17
—
3
12
158
171
—
0
5
31
41
New Mexico
—
0
5
43
16
—
5
16
310
336
—
1
5
52
43
Utah
—
0
2
15
7
—
4
15
249
334
—
1
14
98
140
Wyoming
—
0
0
—
26
—
1
8
58
73
—
0
3
22
29
Pacific
—
4
12
200
246
17
107
211
5,717
5,315
3
15
40
824
824
Alaska
—
0
1
6
14
1
1
5
61
54
—
0
0
—
—
California
—
3
11
180
215
2
72
161
4,140
4,023
—
8
19
404
502
Hawaii
—
0
0
—
—
—
4
58
337
330
—
0
2
16
9
Oregon
—
0
2
14
17
—
7
16
387
361
—
3
11
191
133
Washington
—
0
11
—
—
14
14
56
792
547
3
3
24
213
180
Territories
American Samoa
N
0
0
N
N
—
1
2
4
—
—
0
0
—
—
C.N.M.I.
—
—
—
—
—
—
—
—
—
—
—
—
—
—
—
Guam
—
0
0
—
—
—
0
0
—
19
—
0
0
—
—
Puerto Rico
—
0
5
27
47
—
0
7
32
462
—
0
2
2
—
U.S. Virgin Islands
—
0
0
—
—
—
0
6
—
6
—
0
0
—
—
C.N.M.I.: Commonwealth of Northern Mariana Islands.
U: Unavailable. —: No reported cases. N: Not reportable. NN: Not Nationally Notifiable. Cum: Cumulative year-to-date counts. Med: Median. Max: Maximum.
† Includes E. coli O157:H7; Shiga toxin-positive, serogroup non-O157; and Shiga toxin-positive, not serogrouped.
TABLE II. (Continued) Provisional cases of selected notifiable diseases, United States, weeks ending December 22, 2012, and December 24, 2011 (51st week)*
Reporting area
Shigellosis
Spotted Fever Rickettsiosis (including RMSF)†
Confirmed
Probable
Current week
Previous 52 weeks
Cum 2012
Cum 2011
Current week
Previous 52 weeks
Cum 2012
Cum 2011
Current week
Previous 52 weeks
Cum 2012
Cum 2011
Med
Max
Med
Max
Med
Max
United States
177
267
426
13,544
12,926
—
3
11
178
225
8
55
350
3,764
2,212
New England
—
3
12
194
266
—
0
1
1
2
—
0
3
22
8
Connecticut
—
1
3
41
40
—
0
0
—
—
—
0
0
—
—
Maine
—
0
4
12
32
—
0
0
—
—
—
0
1
3
1
Massachusetts
—
2
8
124
175
—
0
0
—
—
—
0
3
9
4
New Hampshire
—
0
1
6
4
—
0
0
—
2
—
0
1
1
1
Rhode Island
—
0
5
7
9
—
0
0
—
—
—
0
1
9
2
Vermont
—
0
1
4
6
—
0
1
1
—
—
0
0
—
—
Mid. Atlantic
16
44
89
2,208
1,341
—
0
2
18
4
—
1
5
75
171
New Jersey
—
15
47
816
449
—
0
0
—
2
—
0
4
4
130
New York (Upstate)
13
15
41
720
337
—
0
1
3
2
—
0
3
15
10
New York City
2
11
21
548
435
—
0
0
—
—
—
0
3
20
12
Pennsylvania
1
3
6
124
120
—
0
2
15
—
—
1
4
36
19
E.N. Central
107
33
116
2,418
909
—
0
2
13
8
—
4
15
238
106
Illinois
—
5
13
221
260
—
0
1
7
—
—
2
12
145
51
Indiana
—
1
17
150
87
—
0
1
5
3
—
1
6
63
24
Michigan
2
4
14
205
186
—
0
0
—
—
—
0
1
2
4
Ohio
105
20
92
1,735
305
—
0
1
1
3
—
0
2
21
18
Wisconsin
—
1
16
107
71
—
0
0
—
2
—
0
1
7
9
W.N. Central
—
8
32
476
375
—
0
6
18
21
—
5
33
474
280
Iowa
—
1
13
89
18
—
0
0
—
—
—
0
1
8
7
Kansas
—
2
9
121
72
—
0
0
—
—
—
0
0
—
—
Minnesota
—
0
3
—
84
—
0
0
—
—
—
0
0
—
11
Missouri
—
1
7
77
181
—
0
5
16
13
—
5
33
460
257
Nebraska
—
1
22
171
14
—
0
1
1
5
—
0
1
5
5
North Dakota
—
0
2
7
—
—
0
1
1
2
—
0
0
—
—
South Dakota
—
0
3
11
6
—
0
0
—
1
—
0
1
1
—
S. Atlantic
18
55
102
2,866
3,862
—
1
9
85
126
7
14
146
1,102
580
Delaware
—
0
4
20
6
—
0
0
—
—
—
0
2
25
20
District of Columbia
—
0
3
17
35
—
0
0
—
1
—
0
1
1
3
Florida
6
32
66
1,693
2,599
—
0
1
3
3
1
0
3
30
7
Georgia
11
13
21
662
657
—
1
5
54
88
—
0
0
—
—
Maryland
1
4
15
221
94
—
0
1
1
3
1
0
3
28
26
North Carolina
—
2
10
133
218
—
0
4
12
15
4
1
133
526
283
South Carolina
—
1
2
32
142
—
0
1
7
12
—
1
6
51
23
Virginia
—
1
6
86
105
—
0
2
8
4
1
5
35
440
214
West Virginia
—
0
1
2
6
—
0
0
—
—
—
0
1
1
4
E.S. Central
3
21
42
1,112
1,003
—
0
3
14
15
1
12
57
909
351
Alabama
—
6
20
311
312
—
0
1
3
5
—
2
12
152
73
Kentucky
—
5
21
336
248
—
0
1
3
3
—
0
7
56
1
Mississippi
—
5
13
267
234
—
0
2
2
1
—
0
4
23
23
Tennessee
3
3
9
198
209
—
0
1
6
6
1
10
49
678
254
W.S. Central
24
47
189
2,395
3,208
—
0
6
5
15
—
12
292
886
642
Arkansas
5
1
7
94
93
—
0
1
3
9
—
9
67
791
530
Louisiana
—
4
10
188
478
—
0
0
—
—
—
0
1
5
9
Oklahoma
6
8
55
483
220
—
0
5
1
3
—
0
260
52
67
Texas
13
31
122
1,630
2,417
—
0
1
1
3
—
0
13
38
36
Mountain
7
12
34
726
862
—
0
2
11
32
—
0
5
49
67
Arizona
7
8
18
405
423
—
0
2
10
31
—
0
4
31
43
Colorado
—
1
19
123
88
—
0
1
1
—
—
0
1
3
3
Idaho
—
0
2
9
16
—
0
0
—
—
—
0
2
3
1
Montana
—
0
2
11
122
—
0
0
—
—
—
0
1
1
1
Nevada
—
0
8
49
34
—
0
0
—
—
—
0
0
—
2
New Mexico
—
1
7
93
122
—
0
0
—
—
—
0
1
4
—
Utah
—
0
4
32
55
—
0
0
—
1
—
0
1
5
7
Wyoming
—
0
3
4
2
—
0
0
—
—
—
0
1
2
10
Pacific
2
20
57
1,149
1,100
—
0
2
13
2
—
0
3
9
7
Alaska
—
0
2
8
5
N
0
0
N
N
N
0
0
N
N
California
1
15
57
904
898
—
0
2
13
2
—
0
1
8
6
Hawaii
—
0
3
21
47
N
0
0
N
N
N
0
0
N
N
Oregon
—
2
10
94
56
—
0
0
—
—
—
0
1
1
1
Washington
1
1
19
122
94
—
0
1
—
—
—
0
3
—
—
Territories
American Samoa
—
0
3
5
1
N
0
0
N
N
N
0
0
N
N
C.N.M.I.
—
—
—
—
—
—
—
—
—
—
—
—
—
—
—
Guam
—
0
0
—
16
N
0
0
N
N
N
0
0
N
N
Puerto Rico
—
0
0
—
6
N
0
0
N
N
N
0
0
N
N
U.S. Virgin Islands
—
0
0
—
—
N
0
0
N
N
N
0
0
N
N
C.N.M.I.: Commonwealth of Northern Mariana Islands.
U: Unavailable. —: No reported cases. N: Not reportable. NN: Not Nationally Notifiable. Cum: Cumulative year-to-date counts. Med: Median. Max: Maximum.
† Illnesses with similar clinical presentation that result from Spotted fever group rickettsia infections are reported as Spotted fever rickettsioses. Rocky Mountain spotted fever (RMSF) caused by Rickettsia rickettsii, is the most common and well-known spotted fever.
TABLE II. (Continued) Provisional cases of selected notifiable diseases, United States, weeks ending December 22, 2012, and December 24, 2011 (51st week)*
Reporting area
Streptococcus pneumoniae,† invasive disease
Syphilis, primary and secondary
All ages
Age <5
Current week
Previous 52 weeks
Cum 2012
Cum 2011
Current week
Previous 52 weeks
Cum 2012
Cum 2011
Current week
Previous 52 weeks
Cum 2012
Cum 2011
Med
Max
Med
Max
Med
Max
United States
179
237
803
12,535
15,958
9
20
58
923
1,171
28
279
346
13,561
13,647
New England
1
11
24
560
786
—
1
4
50
53
2
8
23
418
395
Connecticut
—
5
13
265
345
—
0
2
14
14
—
0
13
43
52
Maine
1
2
7
94
129
—
0
1
3
4
—
0
5
15
12
Massachusetts
—
1
3
42
38
—
0
2
26
19
2
5
13
284
263
New Hampshire
—
1
5
62
109
—
0
1
6
5
—
0
3
30
17
Rhode Island
—
0
5
40
94
—
0
1
1
4
—
0
6
42
42
Vermont
—
1
4
57
71
—
0
1
—
7
—
0
1
4
9
Mid. Atlantic
23
37
157
1,812
2,441
—
2
11
98
127
2
34
49
1,615
1,652
New Jersey
—
6
26
347
654
—
0
3
19
43
—
4
8
181
232
New York (Upstate)
18
17
108
844
1,075
—
1
10
55
46
2
4
12
207
182
New York City
5
13
24
621
712
—
0
2
24
38
—
17
25
819
874
Pennsylvania
N
0
0
N
N
N
0
0
N
N
—
8
17
408
364
E.N. Central
46
54
101
2,650
3,192
3
3
10
171
182
2
30
62
1,429
1,783
Illinois
N
0
0
N
N
—
0
0
—
—
—
11
54
525
827
Indiana
—
13
33
570
786
—
1
2
33
40
2
4
10
210
172
Michigan
5
12
25
527
680
—
0
3
31
36
—
4
11
232
286
Ohio
41
21
46
1,130
1,249
3
2
6
86
81
—
8
15
374
434
Wisconsin
—
8
29
423
477
—
0
2
21
25
—
2
5
88
64
W.N. Central
—
14
58
677
734
—
1
4
53
60
—
6
14
329
325
Iowa
N
0
0
N
N
N
0
0
N
N
—
1
4
61
20
Kansas
N
0
0
N
N
N
0
0
N
N
—
0
4
27
23
Minnesota
—
10
22
453
563
—
0
3
31
46
—
1
4
80
135
Missouri
N
0
0
N
N
—
0
0
—
—
—
2
9
139
136
Nebraska
—
2
8
106
118
—
0
2
10
12
—
0
1
6
10
North Dakota
—
0
38
30
53
—
0
2
1
2
—
0
1
2
1
South Dakota
—
1
5
88
—
—
0
2
11
—
—
0
2
14
—
S. Atlantic
67
56
193
2,927
3,816
3
4
21
228
322
10
65
103
3,228
3,350
Delaware
—
0
3
30
51
—
0
1
1
—
—
0
6
38
25
District of Columbia
—
0
4
45
53
—
0
1
3
6
—
3
9
159
165
Florida
32
18
48
960
1,276
1
1
8
76
130
1
25
36
1,280
1,230
Georgia
21
15
42
866
1,135
2
2
4
76
91
9
12
59
645
619
Maryland
5
6
22
328
576
—
0
5
27
49
—
7
15
358
444
North Carolina
N
0
0
N
N
N
0
0
N
N
—
6
21
280
431
South Carolina
9
6
16
365
442
—
0
3
24
29
—
4
10
214
221
Virginia
N
0
0
N
N
—
0
0
—
—
—
3
40
251
211
West Virginia
—
5
83
333
283
—
0
8
21
17
—
0
2
3
4
E.S. Central
18
15
50
876
1,168
—
1
3
51
95
4
15
32
734
794
Alabama
—
0
0
—
—
—
0
0
—
—
—
3
10
193
226
Kentucky
—
3
9
179
223
—
0
1
9
23
4
2
9
138
129
Mississippi
—
0
0
—
—
—
0
0
—
—
—
3
21
157
170
Tennessee
18
12
47
697
945
—
1
3
42
72
—
5
14
246
269
W.S. Central
14
25
188
1,407
1,902
1
2
12
126
180
—
42
61
2,074
1,870
Arkansas
5
3
14
161
214
—
0
3
13
14
—
3
15
172
181
Louisiana
—
3
18
148
241
—
0
2
11
24
—
6
14
278
443
Oklahoma
N
0
0
N
N
—
0
0
—
—
—
1
5
73
83
Texas
9
20
156
1,098
1,447
1
2
11
102
142
—
30
45
1,551
1,163
Mountain
9
26
53
1,421
1,774
2
2
6
119
140
2
12
25
621
640
Arizona
9
11
27
613
748
2
1
3
45
54
2
4
8
193
268
Colorado
—
8
19
408
481
—
1
3
36
35
—
4
10
187
133
Idaho
N
0
0
N
N
—
0
0
—
—
—
0
4
21
13
Montana
—
0
0
—
—
N
0
0
N
N
—
0
1
1
7
Nevada
—
0
0
—
—
—
0
0
—
—
—
2
8
103
136
New Mexico
—
5
14
240
319
—
0
4
19
24
—
1
5
87
69
Utah
—
3
9
131
203
—
0
3
17
27
—
0
2
26
14
Wyoming
—
0
3
29
23
—
0
1
2
—
—
0
1
3
—
Pacific
1
4
10
205
145
—
0
2
27
12
6
63
100
3,113
2,838
Alaska
1
2
8
139
138
—
0
2
22
10
—
0
2
10
5
California
N
0
0
N
N
N
0
0
N
N
6
52
83
2,627
2,400
Hawaii
—
1
6
66
7
—
0
1
5
2
—
0
2
16
14
Oregon
N
0
0
N
N
N
0
0
N
N
—
3
11
195
94
Washington
N
0
0
N
N
N
0
0
N
N
—
5
12
265
325
Territories
American Samoa
N
0
0
N
N
—
0
0
—
—
—
0
0
—
—
C.N.M.I.
—
—
—
—
—
—
—
—
—
—
—
—
—
—
—
Guam
—
0
0
—
—
—
0
0
—
—
—
0
0
—
—
Puerto Rico
—
0
0
—
—
—
0
0
—
—
—
6
17
290
242
U.S. Virgin Islands
—
0
0
—
—
—
0
0
—
—
—
0
0
—
—
C.N.M.I.: Commonwealth of Northern Mariana Islands.
U: Unavailable. —: No reported cases. N: Not reportable. NN: Not Nationally Notifiable. Cum: Cumulative year-to-date counts. Med: Median. Max: Maximum.
† Includes drug resistant and susceptible cases of invasive Streptococcus pneumoniae disease among children <5 years and among all ages. Case definition: Isolation of S. pneumoniae from a normally sterile body site (e.g., blood or cerebrospinal fluid).
TABLE II. (Continued) Provisional cases of selected notifiable diseases, United States, weeks ending December 22, 2012, and December 24, 2011 (51st week)*
Reporting area
Varicella (chickenpox)
West Nile virus disease†
Neuroinvasive
Nonneuroinvasive§
Current week
Previous 52 weeks
Cum 2012
Cum 2011
Current week
Previous 52 weeks
Cum 2012
Cum 2011
Current week
Previous 52 weeks
Cum 2012
Cum 2011
Med
Max
Med
Max
Med
Max
United States
61
227
396
11,336
14,117
—
2
320
2,768
486
—
2
336
2,694
226
New England
—
23
49
1,189
1,344
—
0
7
40
15
—
0
4
20
2
Connecticut
—
4
10
243
303
—
0
2
12
8
—
0
3
9
1
Maine
—
4
22
242
224
—
0
1
1
—
—
0
0
—
—
Massachusetts
—
10
21
514
505
—
0
6
23
5
—
0
2
7
1
New Hampshire
—
0
1
—
157
—
0
1
1
—
—
0
0
—
—
Rhode Island
—
0
9
61
42
—
0
1
2
1
—
0
1
2
—
Vermont
—
2
13
129
113
—
0
1
1
1
—
0
1
2
—
Mid. Atlantic
12
20
56
1,170
1,550
—
0
16
110
35
—
0
17
93
22
New Jersey
—
7
25
380
460
—
0
5
22
2
—
0
4
24
5
New York (Upstate)
N
0
0
N
N
—
0
6
35
19
—
0
8
31
14
New York City
—
0
0
—
—
—
0
5
25
9
—
0
2
16
2
Pennsylvania
12
15
35
790
1,090
—
0
4
28
5
—
0
3
22
1
E.N. Central
22
64
125
3,012
3,629
—
0
90
484
73
—
0
41
258
28
Illinois
—
17
36
853
864
—
0
31
185
22
—
0
18
102
12
Indiana
4
9
26
452
277
—
0
8
45
7
—
0
5
30
2
Michigan
5
18
45
870
1,028
—
0
32
138
32
—
0
13
64
2
Ohio
13
17
33
803
1,041
—
0
19
76
10
—
0
12
45
11
Wisconsin
—
0
7
34
419
—
0
11
40
2
—
0
5
17
1
W.N. Central
—
8
35
498
784
—
0
36
222
31
—
0
57
423
29
Iowa
N
0
0
N
N
—
0
3
11
5
—
0
5
20
4
Kansas
—
0
14
85
414
—
0
3
19
4
—
0
6
27
—
Minnesota
—
0
0
—
1
—
0
6
34
1
—
0
7
36
1
Missouri
—
6
24
340
247
—
0
3
17
6
—
0
1
3
4
Nebraska
—
0
3
10
20
—
0
8
40
14
—
0
22
146
15
North Dakota
—
0
29
32
36
—
0
9
39
1
—
0
11
50
3
South Dakota
—
1
3
31
66
—
0
17
62
—
—
0
27
141
2
S. Atlantic
—
26
76
1,444
1,871
—
0
20
172
67
—
0
18
111
27
Delaware
—
0
1
3
11
—
0
1
2
1
—
0
2
7
—
District of Columbia
—
0
4
12
12
—
0
3
6
10
—
0
1
2
5
Florida
—
12
50
755
853
—
0
5
46
20
—
0
5
19
4
Georgia
—
0
9
43
33
—
0
6
42
14
—
0
8
38
8
Maryland
N
0
0
N
N
—
0
5
25
10
—
0
5
22
9
North Carolina
N
0
0
N
N
—
0
4
6
2
—
0
0
—
—
South Carolina
—
0
2
5
13
—
0
5
20
—
—
0
2
9
—
Virginia
—
8
24
420
525
—
0
4
20
8
—
0
3
10
1
West Virginia
—
3
12
206
424
—
0
1
5
2
—
0
2
4
—
E.S. Central
—
3
13
196
292
—
0
20
165
56
—
0
21
187
24
Alabama
—
3
12
185
277
—
0
7
32
5
—
0
3
18
—
Kentucky
N
0
0
N
N
—
0
3
12
4
—
0
2
9
1
Mississippi
—
0
3
11
15
—
0
12
103
31
—
0
17
146
21
Tennessee
N
0
0
N
N
—
0
4
18
16
—
0
2
14
2
W.S. Central
24
44
213
2,298
2,792
—
1
144
1,102
28
—
1
163
1,259
11
Arkansas
—
3
17
193
338
—
0
9
44
1
—
0
3
20
—
Louisiana
—
0
4
31
100
—
0
18
155
6
—
0
26
180
4
Oklahoma
N
0
0
N
N
—
0
24
101
1
—
0
22
87
—
Texas
24
42
204
2,074
2,354
—
1
104
802
20
—
1
128
972
7
Mountain
2
30
62
1,402
1,712
—
0
36
185
71
—
0
22
161
35
Arizona
—
9
26
479
645
—
0
9
82
49
—
0
6
43
20
Colorado
—
8
25
456
445
—
0
17
62
2
—
0
13
69
5
Idaho
N
0
0
N
N
—
0
1
5
1
—
0
3
12
2
Montana
1
2
8
117
162
—
0
1
1
1
—
0
2
5
—
Nevada
N
0
0
N
N
—
0
1
5
12
—
0
2
3
4
New Mexico
—
1
8
82
63
—
0
9
24
4
—
0
5
23
—
Utah
1
5
15
254
384
—
0
1
3
1
—
0
1
2
2
Wyoming
—
0
2
14
13
—
0
1
3
1
—
0
2
4
2
Pacific
1
3
8
127
143
—
0
31
288
110
—
0
25
182
48
Alaska
1
1
4
64
64
—
0
0
—
—
—
0
0
—
—
California
—
0
3
22
37
—
0
31
284
110
—
0
25
179
48
Hawaii
—
1
3
41
42
—
0
0
—
—
—
0
0
—
—
Oregon
N
0
0
N
N
—
0
0
—
—
—
0
1
3
—
Washington
N
0
0
N
N
—
0
4
4
—
—
0
0
—
—
Territories
American Samoa
N
0
0
N
N
—
0
0
—
—
—
0
0
—
—
C.N.M.I.
—
—
—
—
—
—
—
—
—
—
—
—
—
—
—
Guam
—
1
1
—
102
—
0
0
—
—
—
0
0
—
—
Puerto Rico
—
0
9
70
436
—
0
0
—
—
—
0
0
—
—
U.S. Virgin Islands
—
0
1
—
1
—
0
0
—
—
—
0
0
—
—
C.N.M.I.: Commonwealth of Northern Mariana Islands.
U: Unavailable. —: No reported cases. N: Not reportable. NN: Not Nationally Notifiable. Cum: Cumulative year-to-date counts. Med: Median. Max: Maximum.
† Updated weekly from reports to the Division of Vector-Borne Infectious Diseases, National Center for Zoonotic, Vector-Borne, and Enteric Diseases (ArboNET Surveillance). Data for California serogroup, eastern equine, Powassan, St. Louis, and western equine diseases are available in Table I.
§ Not reportable in all states. Data from states where the condition is not reportable are excluded from this table, except starting in 2007 for the domestic arboviral diseases and influenza-associated pediatric mortality, and in 2003 for SARS-CoV. Reporting exceptions are available at http://wwwn.cdc.gov/nndss/document/SRCA_FINAL_REPORT_2006-2010.xlsx.
TABLE III. Deaths in 122 U.S. cities,* week ending December 22, 2012 (51st week)
Reporting area
All causes, by age (years)
P&I† Total
Reporting area (Continued)
All causes, by age (years)
P&I† Total
All Ages
=65
45–64
25–44
1–24
<1
All Ages
=65
45–64
25–44
1–24
<1
New England
526
383
112
19
6
6
60
S. Atlantic
667
432
164
42
18
11
52
Boston, MA
156
107
36
8
2
3
23
Atlanta, GA
148
95
36
11
5
1
8
Bridgeport, CT
29
20
8
—
—
1
1
Baltimore, MD
116
73
32
6
3
2
11
Cambridge, MA
19
15
4
—
—
—
1
Charlotte, NC
137
92
28
10
3
4
17
Fall River, MA
20
13
6
1
—
—
1
Jacksonville, FL
72
51
13
3
3
2
3
Hartford, CT
51
30
15
4
2
—
8
Miami, FL
U
U
U
U
U
U
U
Lowell, MA
17
11
3
2
1
—
—
Norfolk, VA
U
U
U
U
U
U
U
Lynn, MA
6
3
2
1
—
—
—
Richmond, VA
69
38
24
3
3
1
4
New Bedford, MA
19
16
3
—
—
—
2
Savannah, GA
61
41
17
3
—
—
2
New Haven, CT
46
35
9
1
—
1
5
St. Petersburg, FL
39
27
6
4
1
1
3
Providence, RI
U
U
U
U
U
U
U
Tampa, FL
11
7
4
—
—
—
—
Somerville, MA
5
5
—
—
—
—
—
Washington, D.C.
U
U
U
U
U
U
U
Springfield, MA
50
41
8
—
1
—
2
Wilmington, DE
14
8
4
2
—
—
4
Waterbury, CT
34
28
6
—
—
—
1
E.S. Central
1,085
723
251
67
20
23
85
Worcester, MA
74
59
12
2
—
1
16
Birmingham, AL
184
124
36
16
3
4
13
Mid. Atlantic
1,735
1,256
344
86
30
19
95
Chattanooga, TN
129
88
32
5
4
—
12
Albany, NY
47
36
5
1
3
2
2
Knoxville, TN
166
112
39
10
2
3
4
Allentown, PA
22
16
4
1
1
—
2
Lexington, KY
67
44
19
1
2
1
2
Buffalo, NY
83
63
11
7
2
—
8
Memphis, TN
197
126
50
11
4
6
28
Camden, NJ
31
16
9
5
1
—
1
Mobile, AL
99
63
23
8
3
2
4
Elizabeth, NJ
12
7
5
—
—
—
1
Montgomery, AL
75
56
13
4
—
2
8
Erie, PA
56
43
9
3
1
—
3
Nashville, TN
168
110
39
12
2
5
14
Jersey City, NJ
21
13
6
2
—
—
1
W.S. Central
1,175
801
259
73
23
19
67
New York City, NY
1,054
754
218
55
16
11
47
Austin, TX
117
81
25
6
2
3
8
Newark, NJ
33
16
11
4
1
1
2
Baton Rouge, LA
84
50
20
10
1
3
1
Paterson, NJ
25
17
5
2
1
—
2
Corpus Christi, TX
64
42
19
2
1
—
12
Philadelphia, PA
U
U
U
U
U
U
U
Dallas, TX
230
152
50
17
7
4
15
Pittsburgh, PA§
45
37
5
2
—
1
3
El Paso, TX
94
69
19
4
2
—
3
Reading, PA
27
14
10
1
2
—
5
Fort Worth, TX
U
U
U
U
U
U
U
Rochester, NY
89
68
19
—
—
2
4
Houston, TX
U
U
U
U
U
U
U
Schenectady, NY
21
18
3
—
—
—
—
Little Rock, AR
75
57
11
2
2
3
1
Scranton, PA
24
20
3
—
1
—
1
New Orleans, LA
44
24
11
3
4
2
1
Syracuse, NY
80
62
13
3
1
1
8
San Antonio, TX
306
203
73
25
4
1
23
Trenton, NJ
24
21
2
—
—
1
1
Shreveport, LA
84
63
16
3
—
2
3
Utica, NY
16
15
1
—
—
—
2
Tulsa, OK
77
60
15
1
—
1
—
Yonkers, NY
25
20
5
—
—
—
2
Mountain
1,213
794
308
70
17
22
46
E.N. Central
1,533
1,071
316
79
21
46
86
Albuquerque, NM
114
78
29
4
1
2
5
Akron, OH
46
33
8
—
2
3
4
Boise, ID
63
46
14
1
1
1
4
Canton, OH
53
38
9
2
1
3
1
Colorado Springs, CO
92
59
17
12
2
2
3
Chicago, IL
U
U
U
U
U
U
U
Denver, CO
92
63
18
7
2
2
—
Cincinnati, OH
109
53
28
10
6
12
5
Las Vegas, NV
268
169
77
18
2
1
12
Cleveland, OH
273
200
56
12
—
5
12
Ogden, UT
25
17
6
1
—
1
1
Columbus, OH
252
181
53
8
3
7
20
Phoenix, AZ
212
133
56
13
5
4
11
Dayton, OH
132
89
32
8
2
1
9
Pueblo, CO
37
27
10
—
—
—
—
Detroit, MI
U
U
U
U
U
U
U
Salt Lake City, UT
121
70
33
8
2
8
6
Evansville, IN
41
33
7
1
—
—
1
Tucson, AZ
189
132
48
6
2
1
4
Fort Wayne, IN
75
50
18
2
4
1
5
Pacific
1,738
1,226
391
80
24
17
139
Gary, IN
17
12
1
4
—
—
—
Berkeley, CA
U
U
U
U
U
U
U
Grand Rapids, MI
65
45
10
6
1
3
3
Fresno, CA
137
99
26
11
1
—
11
Indianapolis, IN
U
U
U
U
U
U
U
Glendale, CA
34
28
6
—
—
—
6
Lansing, MI
58
44
11
3
—
—
6
Honolulu, HI
65
43
15
4
3
—
7
Milwaukee, WI
76
48
15
8
—
5
3
Long Beach, CA
61
39
18
1
3
—
2
Peoria, IL
61
41
13
4
—
3
2
Los Angeles, CA
272
181
68
15
3
5
28
Rockford, IL
58
39
16
1
1
1
4
Pasadena, CA
28
21
6
1
—
—
4
South Bend, IN
54
44
8
1
—
1
4
Portland, OR
128
90
25
7
5
1
2
Toledo, OH
98
66
23
7
1
1
3
Sacramento, CA
190
144
40
2
3
1
10
Youngstown, OH
65
55
8
2
—
—
4
San Diego, CA
153
102
38
7
—
6
15
W.N. Central
724
490
167
40
8
18
46
San Francisco, CA
132
91
30
8
—
3
17
Des Moines, IA
117
89
25
2
—
1
6
San Jose, CA
201
155
36
7
3
—
13
Duluth, MN
33
22
8
3
—
—
1
Santa Cruz, CA
25
15
6
2
2
—
1
Kansas City, KS
30
15
10
4
1
—
2
Seattle, WA
133
88
40
5
—
—
8
Kansas City, MO
94
67
25
—
—
2
6
Spokane, WA
76
57
13
5
—
1
7
Lincoln, NE
59
48
10
1
—
—
5
Tacoma, WA
103
73
24
5
1
—
8
Minneapolis, MN
68
38
23
2
2
3
5
Total¶
10,396
7,176
2,312
556
167
181
676
Omaha, NE
96
66
21
6
1
2
11
St. Louis, MO
91
46
22
14
3
5
3
St. Paul, MN
61
48
10
2
—
1
2
Wichita, KS
75
51
13
6
1
4
5
U: Unavailable. —: No reported cases.
* Mortality data in this table are voluntarily reported from 122 cities in the United States, most of which have populations of >100,000. A death is reported by the place of its occurrence and by the week that the death certificate was filed. Fetal deaths are not included.
† Pneumonia and influenza.
§ Because of changes in reporting methods in this Pennsylvania city, these numbers are partial counts for the current week. Complete counts will be available in 4 to 6 weeks.