Persons using assistive technology might not be able to fully access information in this file. For assistance, please send e-mail to: mmwrq@cdc.gov. Type 508 Accommodation and the title of the report in the subject line of e-mail.
Notifiable Diseases and Mortality Tables
Table I Summary of provisional cases of selected notifiable diseases, United States, cumulative, week ending December 28, 2013 (52nd Week)
Figure I Selected notifiable disease reports, United States, comparison of provisional 4-week totals ending December 28, 2013, with historical data
Table II Provisional cases of selected notifiable diseases, United States, weeks ending December 28, 2013 and December 29, 2012 (52nd Week)
Table III Deaths in 122 U.S. cities, week ending December 28, 2013 (52nd Week)
TABLE I. Provisional cases of infrequently reported notifiable diseases (<1,000 cases reported during the preceding year) — United States, week ending December 28, 2013 (52nd week)*
TABLE I. (Continued) Provisional cases of infrequently reported notifiable diseases (<1,000 cases reported during the preceding year) — United States, week ending December 28, 2013 (52nd week)*
—: No reported cases. N: Not reportable. NN: Not Nationally Notifiable. Cum: Cumulative year-to-date counts.
† Calculated by summing the incidence counts for the current week, the 2 weeks preceding the current week, and the 2 weeks following the current week, for a total of 5 preceding years. The total sum of incident cases is then divided by 25 weeks. Additional information is available at http://wwwn.cdc.gov/nndss/document/5yearweeklyaverage.pdf.
§ Not reportable in all states. Data from states where the condition is not reportable are excluded from this table except starting in 2007 for the arboviral diseases, STD data, TB data, and influenza-associated pediatric mortality, and in 2003 for SARS-CoV. Reporting exceptions are available at http://wwwn.cdc.gov/nndss/document/SRCA_FINAL_REPORT_2006-2012_final.xlsx.
¶ Includes both neuroinvasive and nonneuroinvasive. Updated weekly from reports to the Division of Vector-Borne Infectious Diseases, National Center for Zoonotic, Vector-Borne, and Enteric Diseases (ArboNET Surveillance). Data for West Nile virus are available in Table II.
** Data for H. influenzae (all ages, all serotypes) are available in Table II.
†† Updated weekly from reports to the Influenza Division, National Center for Immunization and Respiratory Diseases. Since September 29, 2013, six influenza-associated pediatric deaths occurring during the 2013-14 influenza season have been reported. Since September 30, 2012, 171 influenza-associated pediatric deaths occurring during the 2012-13 influenza season have been reported.
§§ No measles cases were reported for the current week.
¶¶ Data for meningococcal disease (all serogroups) are available in Table II.
*** CDC discontinued reporting of individual confirmed and probable cases of influenza A (H1N1)pdm09 virus infections on July 24, 2009. During 2009, four cases of human infection with novel influenza A viruses, different from the influenza A (H1N1)pdm09 virus, were reported to CDC. The four cases of novel influenza A virus infection reported to CDC during 2010, the fourteen cases reported during 2011, the 313 cases reported in 2012, and the 21 cases reported during 2013 are different from the influenza A (H1N1)pdm09 virus. Total case counts are provided by the Influenza Division, National Center for Immunization and Respiratory Diseases (NCIRD).
††† No rubella cases were reported for the current week.
§§§ Updated weekly from reports to the Division of STD Prevention, National Center for HIV/AIDS, Viral Hepatitis, STD, and TB Prevention.
¶¶¶ There were no cases of viral hemorrhagic fever reported during the current week. See Table II for dengue hemorrhagic fever.
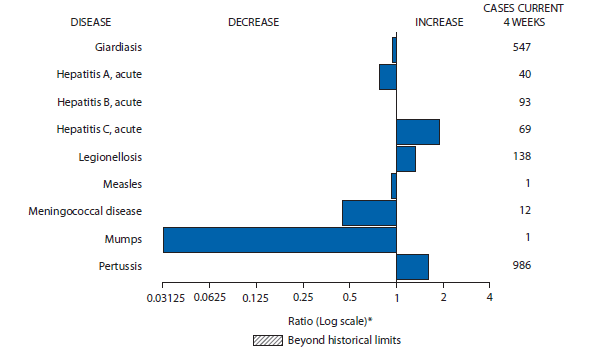
FIGURE I. Selected notifiable disease reports, United States, comparison of provisional 4-week totals December 28, 2013, with historical data
* Ratio of current 4-week total to mean of 15 4-week totals (from previous, comparable, and subsequent 4-week periods for the past 5 years). The point where the hatched area begins is based on the mean and two standard deviations of these 4-week totals.
Alternate Text: The figure above shows selected notifiable disease reports for the United States, with comparison of provisional 4-week totals through December 28, 2013, with historical data. Reports of acute hepatitis B, acute hepatitis C, legionellosis, and pertussis all increased. Reports of giardiasis, acute hepatitis A, measles, meningococcal disease, and mumps all decreased.
TABLE II. Provisional cases of selected notifiable diseases, United States, weeks ending December 28, 2013, and December 29, 2012 (52nd week)*
Reporting area
Chlamydia trachomatis infection
Coccidioidomycosis
Cryptosporidiosis
Current week
Previous 52 weeks
Cum 2013
Cum 2012
Current week
Previous 52 weeks
Cum 2013
Cum 2012
Current week
Previous 52 weeks
Cum 2013
Cum 2012
Med
Max
Med
Max
Med
Max
United States
5,204
26,433
29,521
1,311,674
1,422,976
59
206
290
10,354
17,802
20
103
430
7,874
7,956
New England
316
928
1,163
46,903
49,137
—
0
1
1
3
—
4
14
263
391
Connecticut
—
235
379
12,042
13,065
N
0
0
N
N
—
0
5
34
41
Maine
—
67
110
2,981
3,413
N
0
0
N
N
—
0
4
34
58
Massachusetts
314
442
681
23,162
23,550
—
0
0
—
—
—
2
7
120
155
New Hampshire
—
59
81
2,664
3,072
—
0
1
1
2
—
1
2
31
54
Rhode Island
—
81
160
4,225
4,313
—
0
0
—
1
—
0
2
12
16
Vermont
2
32
110
1,829
1,724
N
0
0
N
N
—
0
2
32
67
Mid. Atlantic
1,432
3,424
4,058
171,172
182,810
—
0
1
1
4
4
12
42
790
809
New Jersey
—
560
629
27,464
27,271
N
0
0
N
N
—
1
5
54
42
New York (Upstate)
596
747
1,909
36,900
38,227
N
0
0
N
N
4
4
16
244
229
New York City
260
1,077
1,283
54,878
62,319
N
0
0
N
N
—
1
6
76
124
Pennsylvania
576
1,012
1,333
51,930
54,993
—
0
1
1
4
—
6
30
416
414
E.N. Central
436
3,884
4,698
190,919
221,639
—
0
2
26
51
5
24
60
1,439
1,863
Illinois
12
1,027
1,453
50,238
67,701
N
0
0
N
N
—
4
16
231
173
Indiana
—
557
700
27,892
29,505
N
0
0
N
N
—
2
7
114
164
Michigan
163
873
1,091
43,272
47,566
—
0
2
17
27
1
5
15
259
351
Ohio
98
1,028
1,196
50,890
53,141
—
0
2
7
22
3
7
17
372
569
Wisconsin
163
426
550
18,627
23,726
—
0
1
2
2
1
8
24
463
606
W.N. Central
80
1,510
1,753
75,106
81,983
—
1
7
72
151
—
16
171
2,033
1,349
Iowa
1
203
243
10,127
11,377
N
0
0
N
N
—
5
155
1,367
328
Kansas
25
213
255
10,529
11,135
N
0
0
N
N
—
2
6
86
122
Minnesota
9
314
449
14,832
18,056
—
0
5
48
119
—
0
0
—
347
Missouri
41
521
632
26,656
27,835
—
0
3
16
17
—
4
11
211
239
Nebraska
4
131
229
6,596
6,748
—
0
1
1
1
—
2
11
142
165
North Dakota
—
52
78
2,645
2,908
—
0
2
7
14
—
1
6
76
35
South Dakota
—
74
109
3,721
3,924
N
0
0
N
N
—
2
17
151
113
S. Atlantic
1,401
5,378
6,564
264,644
285,340
—
0
1
6
9
7
18
53
1,025
1,142
Delaware
220
90
322
5,213
4,438
—
0
1
1
1
—
0
2
14
15
District of Columbia
—
117
284
6,084
6,808
—
0
0
—
1
N
0
0
N
N
Florida
581
1,556
1,769
77,452
77,644
N
0
0
N
N
4
8
23
394
470
Georgia
494
909
1,200
46,844
52,418
N
0
0
N
N
—
4
16
269
257
Maryland
—
459
877
23,166
26,534
—
0
1
5
7
1
1
4
66
86
North Carolina
106
947
1,772
46,614
50,596
N
0
0
N
N
—
0
25
126
86
South Carolina
—
529
767
25,830
27,149
N
0
0
N
N
1
1
7
89
72
Virginia
—
617
1,018
28,449
34,963
N
0
0
N
N
1
0
7
48
144
West Virginia
—
98
129
4,992
4,790
N
0
0
N
N
—
0
3
19
12
E.S. Central
—
1,817
2,206
86,677
103,473
—
0
0
—
—
1
6
17
313
284
Alabama
—
552
874
24,627
30,621
N
0
0
N
N
1
2
8
124
109
Kentucky
—
327
570
16,856
17,273
N
0
0
N
N
—
1
5
64
63
Mississippi
—
323
729
16,945
23,054
N
0
0
N
N
—
1
5
45
40
Tennessee
—
573
837
28,249
32,525
N
0
0
N
N
—
1
6
80
72
W.S. Central
23
3,542
8,645
178,272
187,843
—
0
1
4
4
2
11
46
747
596
Arkansas
—
294
372
13,965
16,611
N
0
0
N
N
—
1
12
49
42
Louisiana
13
405
2,110
20,639
27,353
—
0
1
4
4
—
4
31
331
155
Oklahoma
10
286
5,044
16,716
16,843
N
0
0
N
N
2
1
13
75
97
Texas
—
2,521
2,996
126,952
127,036
N
0
0
N
N
—
5
28
292
302
Mountain
549
1,681
2,262
86,429
93,204
43
132
226
7,111
13,140
—
8
51
623
830
Arizona
—
508
873
25,782
30,444
43
129
222
6,971
12,920
—
1
6
39
47
Colorado
245
386
586
20,414
21,631
N
0
0
N
N
—
0
4
45
102
Idaho
83
101
233
5,339
4,550
N
0
0
N
N
—
2
16
131
267
Montana
—
72
105
3,729
3,827
—
0
1
3
3
—
1
19
117
69
Nevada
175
218
320
10,981
11,137
—
1
6
75
118
—
0
2
16
15
New Mexico
44
217
402
11,719
11,898
—
0
2
24
37
—
1
3
40
94
Utah
—
146
169
7,107
7,615
—
1
4
35
56
—
1
7
81
202
Wyoming
2
26
64
1,358
2,102
—
0
1
3
6
—
0
25
154
34
Pacific
967
4,260
5,264
211,552
217,547
16
64
97
3,133
4,440
1
10
75
641
692
Alaska
10
109
146
5,458
5,462
N
0
0
N
N
1
0
1
4
7
California
752
3,248
4,267
162,512
167,695
16
64
90
3,128
4,431
—
6
15
299
365
Hawaii
—
132
158
6,305
6,340
N
0
0
N
N
—
0
1
1
5
Oregon
—
282
475
13,863
13,454
—
0
1
5
2
—
2
58
259
214
Washington
205
464
582
23,414
24,596
—
0
7
—
7
—
1
16
78
101
Territories
American Samoa
—
—
—
—
82
N
—
—
N
N
N
—
—
N
N
C.N.M.I.
—
—
—
—
—
—
—
—
—
—
—
—
—
—
—
Guam
—
0
0
—
—
—
0
0
—
—
—
0
0
—
—
Puerto Rico
—
109
279
5,754
6,227
N
0
0
N
N
N
0
0
N
N
U.S. Virgin Islands
—
12
24
290
801
—
0
0
—
—
—
0
0
—
—
C.N.M.I.: Commonwealth of Northern Mariana Islands.
U: Unavailable. —: No reported cases. N: Not reportable. NN: Not Nationally Notifiable. Cum: Cumulative year-to-date counts. Med: Median. Max: Maximum.
TABLE II. (Continued) Provisional cases of selected notifiable diseases, United States, weeks ending December 28, 2013, and December 29, 2012 (52nd week)*
Reporting area
Dengue Virus Infection
Dengue Fever†
Dengue Hemorrhagic Fever§
Current week
Previous 52 weeks
Cum 2013
Cum 2012
Current week
Previous 52 weeks
Cum 2013
Cum 2012
Med
Max
Med
Max
United States
—
9
41
543
544
—
0
2
5
3
New England
—
0
3
27
17
—
0
0
—
—
Connecticut
—
0
2
16
16
—
0
0
—
—
Maine
—
0
0
—
—
—
0
0
—
—
Massachusetts
—
0
0
—
—
—
0
0
—
—
New Hampshire
—
0
1
1
—
—
0
0
—
—
Rhode Island
—
0
2
8
—
—
0
0
—
—
Vermont
—
0
1
2
1
—
0
0
—
—
Mid. Atlantic
—
2
11
162
132
—
0
1
2
—
New Jersey
—
0
0
—
—
—
0
0
—
—
New York (Upstate)
—
0
5
40
16
—
0
1
1
—
New York City
—
1
9
99
95
—
0
1
1
—
Pennsylvania
—
0
3
23
21
—
0
0
—
—
E.N. Central
—
1
4
51
55
—
0
0
—
1
Illinois
—
0
3
21
20
—
0
0
—
1
Indiana
—
0
1
6
9
—
0
0
—
—
Michigan
—
0
1
7
9
—
0
0
—
—
Ohio
—
0
2
9
6
—
0
0
—
—
Wisconsin
—
0
1
8
11
—
0
0
—
—
W.N. Central
—
1
3
35
19
—
0
1
2
1
Iowa
—
0
0
—
2
—
0
1
2
—
Kansas
—
0
1
7
1
—
0
0
—
—
Minnesota
—
0
2
22
9
—
0
0
—
—
Missouri
—
0
1
4
5
—
0
0
—
1
Nebraska
—
0
0
—
—
—
0
0
—
—
North Dakota
—
0
1
1
—
—
0
0
—
—
South Dakota
—
0
1
1
2
—
0
0
—
—
S. Atlantic
—
1
13
108
185
—
0
1
1
—
Delaware
—
0
1
2
—
—
0
0
—
—
District of Columbia
—
0
0
—
—
—
0
0
—
—
Florida
—
0
9
61
139
—
0
0
—
—
Georgia
—
0
2
5
11
—
0
0
—
—
Maryland
—
0
1
4
9
—
0
0
—
—
North Carolina
—
0
2
13
7
—
0
0
—
—
South Carolina
—
0
4
7
2
—
0
0
—
—
Virginia
—
0
4
15
17
—
0
1
1
—
West Virginia
—
0
1
1
—
—
0
0
—
—
E.S. Central
—
0
2
16
12
—
0
0
—
—
Alabama
—
0
2
6
4
—
0
0
—
—
Kentucky
—
0
0
—
1
—
0
0
—
—
Mississippi
—
0
1
1
1
—
0
0
—
—
Tennessee
—
0
2
9
6
—
0
0
—
—
W.S. Central
—
0
9
49
23
—
0
0
—
—
Arkansas
—
0
1
1
—
—
0
0
—
—
Louisiana
—
0
1
5
6
—
0
0
—
—
Oklahoma
—
0
2
4
1
—
0
0
—
—
Texas
—
0
9
39
16
—
0
0
—
—
Mountain
—
0
1
9
13
—
0
0
—
—
Arizona
—
0
0
—
8
—
0
0
—
—
Colorado
—
0
0
—
—
—
0
0
—
—
Idaho
—
0
1
1
1
—
0
0
—
—
Montana
—
0
1
5
2
—
0
0
—
—
Nevada
—
0
1
2
2
—
0
0
—
—
New Mexico
—
0
0
—
—
—
0
0
—
—
Utah
—
0
0
—
—
—
0
0
—
—
Wyoming
—
0
1
1
—
—
0
0
—
—
Pacific
—
1
7
86
88
—
0
0
—
1
Alaska
—
0
1
1
1
—
0
0
—
—
California
—
1
7
68
64
—
0
0
—
—
Hawaii
—
0
2
9
8
—
0
0
—
—
Oregon
—
0
0
—
—
—
0
0
—
—
Washington
—
0
1
8
15
—
0
0
—
1
Territories
American Samoa
—
—
—
—
—
—
—
—
—
—
C.N.M.I.
—
—
—
—
—
—
—
—
—
—
Guam
—
0
0
—
—
—
0
0
—
—
Puerto Rico
—
147
424
7,955
5,907
—
1
9
44
118
U.S. Virgin Islands
—
0
0
—
141
—
0
0
—
1
C.N.M.I.: Commonwealth of Northern Mariana Islands.
U: Unavailable. —: No reported cases. N: Not reportable. NN: Not Nationally Notifiable. Cum: Cumulative year-to-date counts. Med: Median. Max: Maximum.
† Dengue Fever includes cases that meet criteria for Dengue Fever with hemorrhage, other clinical and unknown case classifications.
§ DHF includes cases that meet criteria for dengue shock syndrome (DSS), a more severe form of DHF.
TABLE II. (Continued) Provisional cases of selected notifiable diseases, United States, weeks ending December 28, 2013, and December 29, 2012 (52nd week)*
Reporting area
Ehrlichiosis/Anaplasmosis†
Ehrlichia chaffeensis
Anaplasma phagocytophilum
Undetermined
Current week
Previous 52 weeks
Cum 2013
Cum 2012
Current week
Previous 52 weeks
Cum 2013
Cum 2012
Current week
Previous 52 weeks
Cum 2013
Cum 2012
Med
Max
Med
Max
Med
Max
United States
8
14
160
1,206
1,128
4
25
86
1,441
2,389
—
2
21
192
191
New England
—
0
8
50
52
—
4
18
242
659
—
0
1
2
—
Connecticut
—
0
0
—
—
—
0
2
14
142
—
0
0
—
—
Maine
—
0
1
3
3
—
1
8
92
52
—
0
1
2
—
Massachusetts
—
0
0
—
25
—
0
0
—
318
—
0
0
—
—
New Hampshire
—
0
1
4
3
—
1
4
51
52
—
0
0
—
—
Rhode Island
—
0
8
41
21
—
0
14
57
86
—
0
0
—
—
Vermont
—
0
1
2
—
—
0
3
28
9
—
0
0
—
—
Mid. Atlantic
6
2
28
132
123
4
8
50
493
482
—
0
7
27
31
New Jersey
—
0
1
1
58
—
0
4
24
139
—
0
1
2
1
New York (Upstate)
6
1
28
95
48
4
7
49
423
315
—
0
5
23
13
New York City
—
0
5
34
11
—
0
4
46
20
—
0
1
2
—
Pennsylvania
—
0
1
2
6
—
0
0
—
8
—
0
2
—
17
E.N. Central
—
1
8
76
61
—
9
44
632
604
—
1
16
130
102
Illinois
—
0
7
39
36
—
0
2
8
12
—
0
0
—
1
Indiana
—
0
0
—
—
—
0
0
—
—
—
1
12
89
35
Michigan
—
0
0
—
2
—
0
0
—
6
—
0
3
6
—
Ohio
—
0
1
10
3
—
0
1
4
1
—
0
1
2
1
Wisconsin
—
0
6
27
20
—
9
43
620
585
—
0
5
33
65
W.N. Central
2
2
43
416
236
—
0
4
26
538
—
0
2
12
27
Iowa
N
0
0
N
N
N
0
0
N
N
N
0
0
N
N
Kansas
—
1
8
72
41
—
0
1
6
7
—
0
0
—
—
Minnesota
—
0
0
—
9
—
0
0
—
503
—
0
0
—
17
Missouri
2
1
39
338
186
—
0
2
10
23
—
0
2
10
9
Nebraska
—
0
1
5
—
—
0
1
2
2
—
0
0
—
—
North Dakota
—
0
0
—
—
—
0
2
8
3
—
0
1
2
—
South Dakota
—
0
1
1
—
—
0
0
—
—
—
0
0
—
1
S. Atlantic
—
1
22
166
334
—
0
3
33
56
—
0
2
6
11
Delaware
—
0
2
13
16
—
0
0
—
1
—
0
1
1
—
District of Columbia
N
0
0
N
N
N
0
0
N
N
N
0
0
N
N
Florida
—
0
3
22
23
—
0
1
4
5
—
0
0
—
—
Georgia
—
0
3
8
24
—
0
1
2
5
—
0
0
—
2
Maryland
—
0
5
31
37
—
0
1
5
5
—
0
1
1
—
North Carolina
—
0
12
65
109
—
0
3
12
21
—
0
0
—
2
South Carolina
—
0
1
4
2
—
0
0
—
—
—
0
0
—
—
Virginia
—
0
3
19
123
—
0
2
7
18
—
0
1
2
6
West Virginia
—
0
1
4
—
—
0
1
3
1
—
0
1
2
1
E.S. Central
—
1
14
154
102
—
0
1
8
26
—
0
3
6
11
Alabama
—
0
2
11
10
—
0
1
3
11
—
0
1
1
5
Kentucky
—
0
7
62
29
—
0
0
—
1
—
0
0
—
—
Mississippi
—
0
1
1
2
—
0
0
—
1
—
0
1
1
—
Tennessee
—
1
9
80
61
—
0
1
5
13
—
0
3
4
6
W.S. Central
—
2
116
211
220
—
0
13
6
24
—
0
0
—
1
Arkansas
—
2
17
160
85
—
0
1
4
8
—
0
0
—
—
Louisiana
—
0
1
2
1
—
0
1
1
—
—
0
0
—
1
Oklahoma
—
0
115
43
130
—
0
13
1
15
—
0
0
—
—
Texas
—
0
1
6
4
—
0
0
—
1
—
0
0
—
—
Mountain
—
0
1
1
—
—
0
1
1
—
—
0
1
2
2
Arizona
—
0
0
—
—
—
0
0
—
—
—
0
1
2
1
Colorado
N
0
0
N
N
N
0
0
N
N
N
0
0
N
N
Idaho
N
0
0
N
N
N
0
0
N
N
N
0
0
N
N
Montana
N
0
0
N
N
N
0
0
N
N
N
0
0
N
N
Nevada
—
0
0
—
—
—
0
1
1
—
—
0
0
—
—
New Mexico
N
0
0
N
N
N
0
0
N
N
N
0
0
N
N
Utah
—
0
1
1
—
—
0
0
—
—
—
0
0
—
1
Wyoming
—
0
0
—
—
—
0
0
—
—
—
0
0
—
—
Pacific
—
0
0
—
—
—
0
0
—
—
—
0
1
7
6
Alaska
N
0
0
N
N
N
0
0
N
N
N
0
0
N
N
California
—
0
0
—
—
—
0
0
—
—
—
0
1
7
6
Hawaii
N
0
0
N
N
N
0
0
N
N
N
0
0
N
N
Oregon
—
0
0
—
—
—
0
0
—
—
—
0
0
—
—
Washington
—
0
0
—
—
—
0
0
—
—
—
0
0
—
—
Territories
American Samoa
N
—
—
N
N
N
—
—
N
N
N
—
—
N
N
C.N.M.I.
—
—
—
—
—
—
—
—
—
—
—
—
—
—
—
Guam
N
0
0
N
N
N
0
0
N
N
N
0
0
N
N
Puerto Rico
N
0
0
N
N
N
0
0
N
N
N
0
0
N
N
U.S. Virgin Islands
—
0
0
—
—
—
0
0
—
—
—
0
0
—
—
C.N.M.I.: Commonwealth of Northern Mariana Islands.
U: Unavailable. —: No reported cases. N: Not reportable. NN: Not Nationally Notifiable. Cum: Cumulative year-to-date counts. Med: Median. Max: Maximum.
† Cumulative total E. ewingii cases reported for year 2012 = 17, and 22 cases reported for 2013.
TABLE II. (Continued) Provisional cases of selected notifiable diseases, United States, weeks ending December 28, 2013, and December 29, 2012 (52nd week)*
Reporting area
Giardiasis
Gonorrhea
Haemophilus influenzae, invasive† All ages, all serotypes
Current week
Previous 52 weeks
Cum 2013
Cum 2012
Current week
Previous 52 weeks
Cum 2013
Cum 2012
Current week
Previous 52 weeks
Cum 2013
Cum 2012
Med
Max
Med
Max
Med
Max
United States
107
239
407
13,495
15,178
1,255
6,199
6,951
310,957
334,826
25
64
190
3,326
3,418
New England
4
24
58
1,352
1,436
65
126
192
6,711
5,970
—
4
21
216
235
Connecticut
—
4
11
207
223
—
52
104
2,747
2,133
—
1
4
40
61
Maine
3
4
12
216
169
—
4
13
217
456
—
0
2
25
23
Massachusetts
—
11
26
639
698
65
58
100
3,113
2,628
—
2
6
115
111
New Hampshire
—
2
7
91
105
—
2
6
117
147
—
0
3
24
12
Rhode Island
—
0
7
39
58
—
6
40
419
507
—
0
11
—
19
Vermont
1
2
14
160
183
—
2
8
98
99
—
0
1
12
9
Mid. Atlantic
37
49
89
2,670
2,928
309
777
1,084
39,774
45,447
3
11
58
590
674
New Jersey
—
5
12
269
423
—
135
171
6,787
7,486
—
2
10
109
124
New York (Upstate)
27
18
67
976
975
90
122
519
6,231
7,884
2
3
35
166
201
New York City
1
14
24
704
872
61
254
311
12,904
14,687
—
2
7
105
123
Pennsylvania
9
13
27
721
658
158
270
328
13,852
15,390
1
4
13
210
226
E.N. Central
12
36
62
1,830
2,203
100
979
1,296
48,972
59,268
4
11
21
549
570
Illinois
—
6
18
280
347
3
255
398
12,325
18,149
—
3
10
151
159
Indiana
—
3
10
168
227
—
145
180
7,113
7,338
—
2
6
126
104
Michigan
1
10
27
509
547
25
198
276
10,208
12,584
1
2
5
91
82
Ohio
9
9
25
509
578
38
314
379
15,818
16,493
3
3
8
149
158
Wisconsin
2
7
15
364
504
34
82
122
3,508
4,704
—
0
4
32
67
W.N. Central
2
17
41
965
1,726
21
327
415
16,346
17,676
1
4
11
228
245
Iowa
—
4
15
256
251
—
28
44
1,436
2,006
—
0
0
—
—
Kansas
—
2
6
104
133
4
39
66
2,101
2,228
—
0
3
38
32
Minnesota
—
0
13
—
610
—
66
89
3,085
3,082
—
1
5
52
85
Missouri
1
5
15
298
330
14
150
184
7,368
7,889
1
2
7
99
82
Nebraska
1
3
9
167
194
3
24
49
1,241
1,429
—
0
3
27
31
North Dakota
—
0
3
39
64
—
8
15
411
335
—
0
2
9
15
South Dakota
—
2
9
101
144
—
15
27
704
707
—
0
1
3
—
S. Atlantic
38
43
91
2,320
2,438
368
1,359
1,760
69,027
73,447
12
16
37
847
818
Delaware
—
0
2
15
24
65
25
55
1,390
899
—
0
2
7
8
District of Columbia
—
0
3
39
77
—
44
84
2,303
2,402
—
0
2
12
3
Florida
36
20
56
1,158
1,095
136
398
487
19,939
19,462
11
5
13
276
229
Georgia
—
9
44
622
544
140
252
328
13,040
15,326
—
2
12
145
186
Maryland
1
4
9
218
239
—
105
172
5,141
5,686
1
2
4
105
87
North Carolina
N
0
0
N
N
27
264
544
13,138
14,318
—
3
12
140
99
South Carolina
1
2
7
130
128
—
143
207
7,164
7,638
—
2
11
111
72
Virginia
—
0
16
91
272
—
119
238
5,867
6,885
—
0
8
21
101
West Virginia
—
1
4
47
59
—
20
34
1,045
831
—
0
3
30
33
E.S. Central
—
3
8
156
178
—
462
632
23,055
29,526
1
5
12
245
220
Alabama
—
3
8
156
178
—
149
257
6,941
9,270
—
1
7
68
55
Kentucky
N
0
0
N
N
—
85
143
4,259
4,283
—
1
4
47
36
Mississippi
N
0
0
N
N
—
98
185
4,964
6,875
—
0
2
26
26
Tennessee
N
0
0
N
N
—
141
205
6,891
9,098
1
2
7
104
103
W.S. Central
2
6
15
342
332
11
945
2,555
47,940
50,094
1
3
20
180
207
Arkansas
2
2
8
112
108
—
73
108
3,525
4,307
—
0
3
24
30
Louisiana
—
4
11
230
224
4
120
657
6,200
8,873
—
1
6
43
57
Oklahoma
—
0
0
—
—
7
86
1,325
4,920
4,441
1
2
17
110
117
Texas
N
0
0
N
N
—
660
824
33,295
32,473
—
0
1
3
3
Mountain
—
17
37
910
1,199
88
264
383
13,637
13,576
2
5
14
286
307
Arizona
—
2
7
106
113
—
103
185
5,303
5,809
—
2
7
106
120
Colorado
—
3
18
181
356
35
53
100
2,798
2,822
—
1
4
60
58
Idaho
—
2
9
127
153
—
3
10
179
167
2
0
1
19
18
Montana
—
1
6
84
67
—
4
10
217
108
—
0
1
6
6
Nevada
—
1
6
74
91
49
50
84
2,521
2,264
—
0
1
13
21
New Mexico
—
2
6
92
95
4
34
71
1,749
1,883
—
1
3
39
46
Utah
—
4
9
217
287
—
15
28
829
479
—
1
2
38
33
Wyoming
—
0
6
29
37
—
1
3
41
44
—
0
1
5
5
Pacific
12
53
126
2,950
2,738
293
891
1,033
45,495
39,822
1
3
9
185
142
Alaska
2
1
7
82
96
4
19
39
1,049
726
1
0
3
20
15
California
8
34
102
2,004
1,715
230
747
873
37,856
33,579
—
1
5
45
32
Hawaii
—
1
3
41
34
—
14
26
688
815
—
1
2
28
22
Oregon
2
6
17
350
381
—
33
55
1,734
1,464
—
1
5
84
69
Washington
—
10
61
473
512
59
80
113
4,168
3,238
—
0
3
8
4
Territories
American Samoa
—
—
—
—
—
—
—
—
—
—
—
—
—
—
—
C.N.M.I.
—
—
—
—
—
—
—
—
—
—
—
—
—
—
—
Guam
—
0
0
—
2
—
0
0
—
—
—
0
0
—
—
Puerto Rico
—
0
4
32
2
—
6
21
346
345
—
0
0
—
—
U.S. Virgin Islands
—
0
0
—
—
—
1
3
26
136
—
0
0
—
—
C.N.M.I.: Commonwealth of Northern Mariana Islands.
U: Unavailable. —: No reported cases. N: Not reportable. NN: Not Nationally Notifiable. Cum: Cumulative year-to-date counts. Med: Median. Max: Maximum.
† Data for H. influenzae (age <5 yrs for serotype b, nonserotype b, and unknown serotype) are available in Table I.
TABLE II. (Continued) Provisional cases of selected notifiable diseases, United States, weeks ending December 28, 2013, and December 29, 2012 (52nd week)*
Reporting area
Hepatitis (viral, acute), by type
A
B
C
Current week
Previous 52 weeks
Cum 2013
Cum 2012
Current week
Previous 52 weeks
Cum 2013
Cum 2012
Current week
Previous 52 weeks
Cum 2013
Cum 2012
Med
Max
Med
Max
Med
Max
United States
9
30
68
1,578
1,562
15
52
105
2,666
2,895
14
32
91
1,655
1,782
New England
—
2
5
85
83
—
1
4
59
105
—
3
7
149
85
Connecticut
—
0
2
17
23
—
0
1
3
15
—
0
0
—
34
Maine
—
0
2
9
9
—
0
1
12
9
—
0
1
6
8
Massachusetts
—
0
3
42
40
—
1
3
40
75
—
3
7
140
37
New Hampshire
—
0
1
6
6
—
0
2
2
4
N
0
0
N
N
Rhode Island
—
0
1
4
3
U
0
0
U
U
U
0
0
U
U
Vermont
—
0
2
7
2
—
0
1
2
2
—
0
1
3
6
Mid. Atlantic
2
4
12
229
233
—
3
10
187
246
3
4
11
209
230
New Jersey
—
0
5
31
60
—
1
3
34
70
—
0
3
22
71
New York (Upstate)
2
1
5
73
63
—
1
6
46
50
2
2
10
104
83
New York City
—
1
7
76
48
—
1
5
69
63
—
0
1
6
10
Pennsylvania
—
1
4
49
62
—
1
4
38
63
1
1
6
77
66
E.N. Central
1
5
12
267
235
4
9
15
445
457
8
6
21
348
245
Illinois
—
1
4
63
67
—
1
4
73
86
—
0
4
30
26
Indiana
—
0
2
28
11
—
2
5
82
90
—
2
7
112
110
Michigan
—
1
7
82
100
—
1
5
56
81
—
1
11
105
76
Ohio
1
1
5
59
36
4
4
8
224
178
8
0
17
72
7
Wisconsin
—
1
3
35
21
—
0
2
10
22
—
0
3
29
26
W.N. Central
—
1
32
63
89
—
2
17
109
99
—
0
32
27
62
Iowa
—
0
3
15
7
—
0
2
9
13
—
0
0
—
3
Kansas
—
0
3
11
15
—
0
3
11
9
—
0
3
14
16
Minnesota
—
0
29
—
29
—
0
17
—
17
—
0
32
—
32
Missouri
—
0
2
13
20
—
1
4
76
48
—
0
4
12
4
Nebraska
—
0
2
13
16
—
0
2
9
10
—
0
1
1
3
North Dakota
—
0
2
7
2
—
0
0
—
—
—
0
0
—
—
South Dakota
—
0
1
4
—
—
0
1
4
2
—
0
0
—
4
S. Atlantic
2
5
15
269
267
9
16
26
796
754
3
6
21
312
423
Delaware
—
0
1
4
9
—
0
1
11
11
U
0
0
U
U
District of Columbia
—
0
0
—
—
—
0
0
—
—
—
0
0
—
—
Florida
2
2
7
116
87
8
6
13
321
247
2
2
7
132
107
Georgia
—
1
4
47
46
—
2
6
105
109
—
0
3
28
82
Maryland
—
0
4
31
28
—
1
3
36
52
—
1
3
45
39
North Carolina
—
1
4
44
34
1
0
16
73
73
—
0
15
48
63
South Carolina
—
0
1
12
6
—
1
5
56
37
—
0
0
—
1
Virginia
—
0
2
10
49
—
0
3
18
84
—
0
5
11
76
West Virginia
—
0
1
5
8
—
3
11
176
141
1
0
5
48
55
E.S. Central
1
1
4
58
78
2
12
17
573
577
—
6
14
330
331
Alabama
—
0
2
10
19
—
1
5
84
79
—
0
5
31
24
Kentucky
1
0
2
24
25
—
4
7
187
180
—
4
10
203
178
Mississippi
—
0
1
4
11
—
1
4
49
78
U
0
0
U
U
Tennessee
—
0
2
20
23
2
5
10
253
240
—
2
7
96
129
W.S. Central
1
2
6
115
161
—
5
40
268
367
—
2
16
91
140
Arkansas
—
0
2
5
8
—
1
4
42
74
—
0
3
17
5
Louisiana
—
0
2
11
7
—
1
8
65
44
—
0
2
17
11
Oklahoma
1
0
4
10
12
—
0
16
37
79
—
0
9
37
80
Texas
—
2
5
89
134
—
3
20
124
170
—
0
5
20
44
Mountain
—
2
16
164
163
—
1
4
71
89
—
1
5
52
112
Arizona
—
1
6
62
93
—
0
3
24
14
U
0
0
U
U
Colorado
—
0
8
42
28
—
0
1
6
24
—
0
1
7
42
Idaho
—
0
2
7
11
—
0
2
10
5
—
0
2
9
11
Montana
—
0
1
6
6
—
0
1
3
2
—
0
2
15
9
Nevada
—
0
3
18
10
—
0
3
25
28
—
0
2
8
12
New Mexico
—
0
2
17
10
—
0
1
1
3
—
0
1
3
21
Utah
—
0
2
12
4
—
0
1
2
13
—
0
2
10
17
Wyoming
—
0
0
—
1
—
0
0
—
—
—
0
0
—
—
Pacific
2
6
18
328
253
—
3
6
158
201
—
3
15
137
154
Alaska
—
0
1
1
1
—
0
1
1
1
—
0
0
—
—
California
2
4
17
241
209
—
2
5
97
136
—
1
4
70
63
Hawaii
—
0
4
16
5
—
0
1
3
5
—
0
0
—
—
Oregon
—
0
3
29
9
—
0
4
31
25
—
0
1
13
37
Washington
—
1
4
41
29
—
0
3
26
34
—
1
15
54
54
Territories
American Samoa
—
—
—
—
—
—
—
—
—
—
—
—
—
—
—
C.N.M.I.
—
—
—
—
—
—
—
—
—
—
—
—
—
—
—
Guam
—
0
0
—
—
—
0
0
—
—
—
0
0
—
—
Puerto Rico
—
0
1
9
—
—
0
6
33
4
N
0
0
N
N
U.S. Virgin Islands
—
0
0
—
—
—
0
0
—
—
—
0
0
—
—
C.N.M.I.: Commonwealth of Northern Mariana Islands.
U: Unavailable. —: No reported cases. N: Not reportable. NN: Not Nationally Notifiable. Cum: Cumulative year-to-date counts. Med: Median. Max: Maximum.
TABLE II. (Continued) Provisional cases of selected notifiable diseases, United States, weeks ending December 28, 2013, and December 29, 2012 (52nd week)*
Reporting area
Legionellosis
Lyme disease
Malaria
Current week
Previous 52 weeks
Cum 2013
Cum 2012
Current week
Previous 52 weeks
Cum 2013
Cum 2012
Current week
Previous 52 weeks
Cum 2013
Cum 2012
Med
Max
Med
Max
Med
Max
United States
20
63
258
4,548
3,688
56
347
2,146
30,552
30,831
4
24
87
1,282
1,503
New England
1
5
25
335
308
1
108
878
10,309
11,095
—
2
11
99
104
Connecticut
—
1
10
59
55
—
22
239
2,448
2,657
—
0
0
—
21
Maine
1
0
2
19
18
—
14
99
1,292
1,111
—
0
2
10
5
Massachusetts
—
3
20
185
173
—
37
437
4,289
5,138
—
1
4
65
48
New Hampshire
—
0
3
22
19
—
6
91
814
1,450
—
0
2
8
9
Rhode Island
—
0
7
36
31
—
9
54
654
217
—
0
10
11
17
Vermont
—
0
2
14
12
1
7
92
812
522
—
0
3
5
4
Mid. Atlantic
5
16
122
1,346
975
30
185
1,004
15,045
11,607
—
8
21
394
386
New Jersey
—
2
20
194
173
—
48
224
3,412
3,576
—
1
5
75
67
New York (Upstate)
3
7
40
440
325
19
46
257
3,940
2,456
—
1
7
55
42
New York City
—
3
47
293
177
—
1
39
306
542
—
4
13
196
225
Pennsylvania
2
6
26
419
300
11
80
540
7,387
5,033
—
1
5
68
52
E.N. Central
3
16
102
1,302
847
2
16
216
2,310
2,209
1
2
8
136
145
Illinois
—
3
31
265
226
—
2
30
325
204
—
1
5
60
43
Indiana
1
3
10
176
54
—
1
12
96
74
—
0
2
17
22
Michigan
—
3
21
246
178
—
2
15
183
98
—
0
2
16
26
Ohio
2
5
66
491
288
2
1
7
95
67
1
0
3
33
41
Wisconsin
—
1
11
124
101
—
12
177
1,611
1,766
—
0
3
10
13
W.N. Central
2
2
13
143
171
—
3
31
313
1,735
—
1
3
36
101
Iowa
—
0
2
9
13
—
2
27
225
165
—
0
2
9
6
Kansas
—
0
3
16
16
—
0
4
34
19
—
0
1
7
7
Minnesota
—
0
2
24
51
—
0
6
—
1,515
—
0
1
—
58
Missouri
2
1
11
65
68
—
0
3
16
2
—
0
1
5
19
Nebraska
—
0
3
19
11
—
0
2
6
15
—
0
2
6
4
North Dakota
—
0
1
3
3
—
0
14
28
15
—
0
1
2
2
South Dakota
—
0
1
7
9
—
0
1
4
4
—
0
3
7
5
S. Atlantic
7
10
36
631
613
23
35
234
2,195
3,842
2
6
15
309
355
Delaware
—
0
4
15
17
—
6
23
409
669
—
0
1
5
2
District of Columbia
N
0
0
N
N
N
0
0
N
N
—
0
1
4
6
Florida
7
4
16
254
213
3
2
14
155
118
1
1
3
54
59
Georgia
—
1
5
60
56
—
0
4
10
31
—
1
5
61
66
Maryland
—
2
14
145
123
1
18
68
1,051
1,651
—
2
9
140
112
North Carolina
—
1
9
89
65
—
0
33
152
122
—
0
8
22
34
South Carolina
—
0
3
20
26
—
0
2
20
44
—
0
2
8
9
Virginia
—
0
8
24
76
19
2
183
293
1,110
1
0
4
13
65
West Virginia
—
0
4
24
37
—
2
19
105
97
—
0
1
2
2
E.S. Central
—
3
13
174
137
—
1
9
80
70
—
0
4
30
36
Alabama
—
0
10
41
20
—
0
3
23
25
—
0
1
2
10
Kentucky
—
1
4
40
43
—
0
9
37
14
—
0
2
9
10
Mississippi
—
0
2
17
17
—
0
0
—
1
—
0
1
2
4
Tennessee
—
1
7
76
57
—
0
3
20
30
—
0
3
17
12
W.S. Central
2
3
39
187
229
—
1
27
55
86
—
1
41
82
143
Arkansas
—
0
3
22
20
—
0
0
—
—
—
0
1
2
4
Louisiana
—
0
3
27
29
—
0
0
—
7
—
0
1
9
13
Oklahoma
—
0
8
15
22
—
0
4
1
4
—
0
3
12
24
Texas
2
2
27
123
158
—
1
23
54
75
—
1
39
59
102
Mountain
—
3
9
143
135
—
2
9
99
44
—
1
6
64
75
Arizona
—
1
4
49
44
—
0
3
30
13
—
0
3
30
19
Colorado
—
0
3
23
24
—
0
0
—
—
—
0
2
17
24
Idaho
—
0
2
12
5
—
0
3
16
5
—
0
1
4
8
Montana
—
0
2
10
4
—
0
3
17
6
—
0
0
—
—
Nevada
—
0
3
17
18
—
0
2
14
10
—
0
1
7
8
New Mexico
—
0
2
10
9
—
0
3
5
1
—
0
0
—
2
Utah
—
0
3
22
27
—
0
3
14
5
—
0
2
6
14
Wyoming
—
0
0
—
4
—
0
1
3
4
—
0
0
—
—
Pacific
—
5
24
287
273
—
2
8
146
143
1
2
8
132
158
Alaska
—
0
1
1
1
—
0
4
27
10
—
0
1
3
8
California
—
4
22
227
219
—
1
5
52
70
1
1
7
89
108
Hawaii
—
0
1
6
4
N
0
0
N
N
—
0
1
1
4
Oregon
—
0
3
17
22
—
1
3
53
48
—
0
1
11
12
Washington
—
0
7
36
27
—
0
2
14
15
—
0
3
28
26
Territories
American Samoa
N
—
—
N
N
N
—
—
N
N
—
—
—
—
—
C.N.M.I.
—
—
—
—
—
—
—
—
—
—
—
—
—
—
—
Guam
—
0
0
—
—
—
0
0
—
—
—
0
0
—
—
Puerto Rico
—
0
2
14
—
N
0
0
N
N
—
0
0
—
—
U.S. Virgin Islands
—
0
0
—
—
N
0
0
N
N
—
0
0
—
—
C.N.M.I.: Commonwealth of Northern Mariana Islands.
U: Unavailable. —: No reported cases. N: Not reportable. NN: Not Nationally Notifiable. Cum: Cumulative year-to-date counts. Med: Median. Max: Maximum.
TABLE II. (Continued) Provisional cases of selected notifiable diseases, United States, weeks ending December 28, 2013, and December 29, 2012 (52nd week)*
Reporting area
Meningococcal disease, invasive† All serogroups
Mumps
Pertussis
Current week
Previous 52 weeks
Cum 2013
Cum 2012
Current week
Previous 52 weeks
Cum 2013
Cum 2012
Current week
Previous 52 weeks
Cum 2013
Cum 2012
Med
Max
Med
Max
Med
Max
United States
4
9
32
494
551
—
6
44
438
229
132
475
1,211
24,231
48,277
New England
1
0
3
23
15
—
0
24
68
8
1
20
53
1,038
2,594
Connecticut
—
0
1
2
4
—
0
2
4
—
—
1
6
57
182
Maine
—
0
1
3
3
—
0
1
1
—
1
6
15
295
737
Massachusetts
—
0
3
11
6
—
0
24
59
6
—
6
24
330
648
New Hampshire
—
0
1
2
—
—
0
0
—
—
—
1
9
104
269
Rhode Island
—
0
1
1
—
—
0
1
3
2
—
1
16
140
113
Vermont
1
0
1
4
2
—
0
1
1
—
—
1
22
112
645
Mid. Atlantic
1
1
7
72
85
—
1
20
136
30
11
32
169
1,693
6,511
New Jersey
—
0
2
15
14
—
0
19
76
—
—
6
24
300
1,395
New York (Upstate)
1
0
3
22
21
—
0
2
10
6
6
13
120
687
2,715
New York City
—
0
2
10
25
—
0
4
32
20
—
2
9
124
456
Pennsylvania
—
0
3
25
25
—
0
5
18
4
5
11
25
582
1,945
E.N. Central
—
1
4
42
72
—
1
6
50
60
46
90
160
4,533
11,085
Illinois
—
0
2
12
17
—
0
4
27
32
—
13
32
686
2,026
Indiana
—
0
1
12
8
—
0
1
3
4
—
7
22
448
441
Michigan
—
0
1
4
13
—
0
1
7
10
4
18
33
858
845
Ohio
—
0
2
10
25
—
0
2
12
6
42
19
104
1,464
893
Wisconsin
—
0
1
4
9
—
0
1
1
8
—
20
65
1,077
6,880
W.N. Central
—
0
3
35
40
—
0
2
16
23
5
40
88
2,139
8,104
Iowa
—
0
1
1
2
—
0
2
3
6
—
5
20
270
1,736
Kansas
—
0
1
3
6
—
0
0
—
4
—
6
20
347
887
Minnesota
—
0
2
10
12
—
0
1
1
7
—
12
36
594
4,142
Missouri
—
0
2
10
16
—
0
2
10
5
3
10
33
582
815
Nebraska
—
0
1
4
3
—
0
0
—
1
2
4
13
223
240
North Dakota
—
0
1
3
1
—
0
1
2
—
—
1
29
73
214
South Dakota
—
0
1
4
—
—
0
0
—
—
—
1
7
50
70
S. Atlantic
1
1
6
94
83
—
0
26
100
22
31
41
92
2,113
2,891
Delaware
—
0
1
1
1
—
0
0
—
—
—
0
3
25
57
District of Columbia
—
0
1
4
2
—
0
1
1
2
—
0
4
40
26
Florida
1
1
3
57
45
—
0
1
1
5
24
13
63
729
575
Georgia
—
0
2
13
11
—
0
0
—
3
—
4
11
188
318
Maryland
—
0
1
3
4
—
0
26
87
—
2
4
8
196
369
North Carolina
—
0
2
10
6
—
0
1
4
2
—
11
29
582
612
South Carolina
—
0
1
3
5
—
0
1
2
1
—
4
11
211
224
Virginia
—
0
1
1
5
—
0
2
5
7
4
0
39
125
625
West Virginia
—
0
1
2
4
—
0
0
—
2
1
0
2
17
85
E.S. Central
—
0
2
14
17
—
0
3
10
6
4
15
35
813
1,260
Alabama
—
0
1
3
6
—
0
1
2
2
—
3
8
176
212
Kentucky
—
0
1
1
1
—
0
1
1
2
4
6
22
346
666
Mississippi
—
0
1
4
3
—
0
0
—
—
—
1
4
57
77
Tennessee
—
0
1
6
7
—
0
3
7
2
—
5
10
234
305
W.S. Central
1
1
5
39
58
—
0
3
17
22
24
81
342
4,116
2,692
Arkansas
—
0
1
7
8
—
0
1
2
1
—
8
27
371
248
Louisiana
—
0
1
2
4
—
0
1
2
2
—
3
11
166
72
Oklahoma
—
0
2
6
9
—
0
3
1
4
—
0
36
143
154
Texas
1
0
4
24
37
—
0
3
12
15
24
68
288
3,436
2,218
Mountain
—
0
4
33
41
—
0
2
11
15
6
96
174
4,834
6,097
Arizona
—
0
3
11
6
—
0
1
1
3
1
23
69
1,292
1,130
Colorado
—
0
1
5
6
—
0
1
2
7
—
20
39
914
1,494
Idaho
—
0
1
4
4
—
0
0
—
—
4
4
10
214
235
Montana
—
0
1
1
10
—
0
0
—
1
—
12
29
636
549
Nevada
—
0
1
1
3
—
0
2
5
—
—
2
12
165
112
New Mexico
—
0
2
2
5
—
0
1
1
—
1
11
22
527
924
Utah
—
0
2
7
4
—
0
1
2
3
—
21
41
1,016
1,591
Wyoming
—
0
1
2
3
—
0
0
—
1
—
1
12
70
62
Pacific
—
2
16
142
140
—
0
4
30
43
4
57
298
2,952
7,043
Alaska
—
0
0
—
2
—
0
1
1
—
1
6
19
313
353
California
—
2
7
114
87
—
0
4
23
34
1
27
53
1,462
795
Hawaii
—
0
1
1
2
—
0
1
1
1
—
1
4
47
73
Oregon
—
0
1
11
25
—
0
1
3
6
2
8
26
468
906
Washington
—
0
12
16
24
—
0
1
2
2
—
13
256
662
4,916
Territories
American Samoa
—
—
—
—
—
—
—
—
—
—
—
—
—
—
—
C.N.M.I.
—
—
—
—
—
—
—
—
—
—
—
—
—
—
—
Guam
—
0
0
—
—
—
0
0
—
4
—
0
0
—
1
Puerto Rico
—
0
0
—
—
—
0
1
3
4
—
0
6
24
—
U.S. Virgin Islands
—
0
0
—
—
—
0
0
—
—
—
0
0
—
—
C.N.M.I.: Commonwealth of Northern Mariana Islands.
U: Unavailable. —: No reported cases. N: Not reportable. NN: Not Nationally Notifiable. Cum: Cumulative year-to-date counts. Med: Median. Max: Maximum.
† Data for meningococcal disease, invasive caused by serogroups A, C, Y, and W-135; serogroup B; other serogroup; and unknown serogroup are available in Table I.
TABLE II. (Continued) Provisional cases of selected notifiable diseases, United States, weeks ending December 28, 2013, and December 29, 2012 (52nd week)*
Reporting area
Rabies, animal
Salmonellosis
Shiga toxin-producing E. coli (STEC)†
Current week
Previous 52 weeks
Cum 2013
Cum 2012
Current week
Previous 52 weeks
Cum 2013
Cum 2012
Current week
Previous 52 weeks
Cum 2013
Cum 2012
Med
Max
Med
Max
Med
Max
United States
12
62
140
3,164
4,192
283
898
1,512
45,538
53,799
24
112
231
5,468
6,460
New England
4
6
12
298
386
3
39
81
2,043
1,993
—
4
12
235
209
Connecticut
—
3
12
145
173
—
7
21
415
444
—
1
7
59
50
Maine
—
1
4
48
91
—
2
11
131
161
—
0
4
27
20
Massachusetts
—
0
0
—
—
—
21
54
1,118
1,036
—
2
8
110
96
New Hampshire
—
0
3
27
28
—
3
11
184
156
—
0
2
19
23
Rhode Island
3
0
4
28
28
3
2
13
126
108
—
0
2
2
2
Vermont
1
1
4
50
66
—
1
5
69
88
—
0
3
18
18
Mid. Atlantic
4
6
19
335
832
31
96
196
4,927
5,417
1
13
37
708
675
New Jersey
—
0
0
—
—
—
18
46
1,007
1,147
—
2
8
124
138
New York (Upstate)
4
6
19
335
420
18
25
74
1,228
1,395
—
4
14
223
243
New York City
—
0
1
—
13
6
20
52
1,126
1,180
—
2
8
103
85
Pennsylvania
—
0
2
—
399
7
30
65
1,566
1,695
1
4
19
258
209
E.N. Central
—
2
24
160
107
17
90
165
4,996
5,896
—
15
45
891
1,176
Illinois
—
1
6
53
—
—
31
61
1,613
1,970
—
4
32
258
218
Indiana
—
0
1
9
8
—
11
23
583
781
—
1
6
98
181
Michigan
—
0
5
37
59
—
17
42
925
995
—
3
14
179
285
Ohio
—
0
19
61
40
17
22
42
1,185
1,268
—
4
15
220
238
Wisconsin
N
0
0
N
N
—
12
28
690
882
—
2
12
136
254
W.N. Central
—
2
48
125
252
13
46
93
2,439
3,554
—
12
38
698
1,025
Iowa
—
0
0
—
33
2
10
36
581
622
—
2
14
167
181
Kansas
—
1
5
59
56
1
7
18
421
491
—
1
6
87
97
Minnesota
—
0
0
—
—
—
0
11
—
781
—
0
1
—
258
Missouri
—
1
3
40
28
7
18
38
877
1,071
—
4
18
285
308
Nebraska
—
0
0
—
—
3
5
20
291
353
—
1
7
76
102
North Dakota
—
0
46
—
75
—
2
7
99
66
—
0
3
41
32
South Dakota
—
0
4
26
60
—
3
10
170
170
—
1
5
42
47
S. Atlantic
—
18
44
943
1,048
186
221
432
12,667
15,344
8
9
17
490
610
Delaware
—
0
0
—
—
—
1
7
99
148
—
0
2
13
13
District of Columbia
—
0
0
—
—
—
1
4
44
70
—
0
1
4
8
Florida
—
0
27
103
103
117
103
226
5,961
6,523
5
2
7
140
93
Georgia
—
0
0
—
—
—
34
101
2,276
2,637
—
2
9
124
136
Maryland
—
7
17
365
325
7
16
36
844
951
—
1
6
67
74
North Carolina
—
0
0
—
—
56
31
136
1,867
2,200
3
1
8
71
162
South Carolina
—
0
0
—
—
4
19
52
1,107
1,452
—
0
2
9
25
Virginia
—
8
15
408
560
2
2
27
292
1,144
—
0
3
30
81
West Virginia
—
1
6
67
60
—
3
9
177
219
—
0
3
32
18
E.S. Central
—
1
7
58
71
12
56
136
3,221
4,229
1
5
18
300
308
Alabama
—
0
6
38
55
1
17
67
994
1,150
—
1
3
49
64
Kentucky
—
0
3
14
14
—
9
21
485
732
—
2
9
98
87
Mississippi
—
0
2
6
2
5
13
41
904
1,246
—
0
4
27
30
Tennessee
—
0
0
—
—
6
15
36
838
1,101
1
2
6
126
127
W.S. Central
4
17
75
1,011
899
8
118
400
6,332
8,697
2
13
126
665
705
Arkansas
—
0
34
149
131
6
13
35
694
1,404
—
1
10
72
69
Louisiana
—
0
0
—
4
—
19
43
1,087
1,544
—
0
2
22
27
Oklahoma
—
0
31
81
81
2
13
49
764
759
1
1
11
103
110
Texas
4
15
40
781
683
—
70
329
3,787
4,990
1
9
105
468
499
Mountain
—
0
9
53
313
2
51
248
2,631
2,465
4
9
34
517
723
Arizona
N
0
0
N
N
—
18
32
929
859
—
2
11
99
141
Colorado
—
0
0
—
183
—
6
27
401
509
—
0
11
93
175
Idaho
—
0
4
20
23
1
2
9
125
134
1
2
6
99
139
Montana
N
0
0
N
N
1
2
9
90
109
—
1
5
44
44
Nevada
—
0
3
13
18
—
4
205
404
185
3
1
3
46
37
New Mexico
—
0
1
8
47
—
6
14
319
334
—
0
3
27
55
Utah
—
0
4
12
15
—
6
14
307
260
—
1
10
86
107
Wyoming
—
0
0
—
27
—
1
4
56
75
—
0
7
23
25
Pacific
—
3
12
181
284
11
112
215
6,282
6,204
8
18
51
964
1,029
Alaska
—
0
2
6
6
2
1
5
93
59
N
0
0
N
N
California
—
2
11
165
252
8
87
171
4,879
4,561
7
8
23
451
585
Hawaii
—
0
0
—
—
1
6
13
331
341
—
0
5
23
20
Oregon
—
0
2
10
17
—
6
25
362
401
1
3
14
189
192
Washington
—
0
9
—
9
—
10
40
617
842
—
3
32
301
232
Territories
American Samoa
—
—
—
—
—
—
—
—
—
4
—
—
—
—
—
C.N.M.I.
—
—
—
—
—
—
—
—
—
—
—
—
—
—
—
Guam
—
0
0
—
—
—
0
0
—
13
—
0
0
—
—
Puerto Rico
—
0
0
—
27
—
8
43
436
32
—
0
6
9
2
U.S. Virgin Islands
—
0
0
—
—
—
0
0
—
—
—
0
0
—
—
C.N.M.I.: Commonwealth of Northern Mariana Islands.
U: Unavailable. —: No reported cases. N: Not reportable. NN: Not Nationally Notifiable. Cum: Cumulative year-to-date counts. Med: Median. Max: Maximum.
† Includes E. coli O157:H7; Shiga toxin-positive, serogroup non-O157; and Shiga toxin-positive, not serogrouped.
TABLE II. (Continued) Provisional cases of selected notifiable diseases, United States, weeks ending December 28, 2013, and December 29, 2012 (52nd week)*
Reporting area
Shigellosis
Spotted Fever Rickettsiosis (including RMSF)†
Confirmed
Probable
Current week
Previous 52 weeks
Cum 2013
Cum 2012
Current week
Previous 52 weeks
Cum 2013
Cum 2012
Current week
Previous 52 weeks
Cum 2013
Cum 2012
Med
Max
Med
Max
Med
Max
United States
119
190
378
10,876
15,283
—
3
9
157
188
—
36
420
2,572
4,278
New England
—
4
94
504
212
—
0
1
1
1
—
0
3
8
25
Connecticut
—
1
5
57
46
—
0
0
—
—
—
0
0
—
—
Maine
—
0
1
5
7
—
0
0
—
—
—
0
1
2
3
Massachusetts
—
2
11
169
131
—
0
0
—
—
—
0
1
2
7
New Hampshire
—
0
1
6
8
—
0
1
1
—
—
0
1
2
2
Rhode Island
—
0
86
264
15
—
0
0
—
—
—
0
3
2
13
Vermont
—
0
1
3
5
—
0
0
—
1
—
0
0
—
—
Mid. Atlantic
6
15
75
818
2,478
—
0
1
7
6
—
1
11
90
198
New Jersey
—
2
7
120
952
—
0
1
2
—
—
0
4
32
128
New York (Upstate)
6
4
61
250
828
—
0
1
2
5
—
0
7
18
23
New York City
—
6
14
312
564
—
0
1
1
—
—
0
1
11
7
Pennsylvania
—
2
9
136
134
—
0
1
2
1
—
0
3
29
40
E.N. Central
21
23
74
1,274
2,568
—
0
2
12
11
—
2
14
186
218
Illinois
—
5
15
284
280
—
0
1
5
9
—
1
8
96
142
Indiana
—
1
6
81
161
—
0
1
3
2
—
1
4
55
28
Michigan
—
3
8
159
251
—
0
1
2
—
—
0
1
4
3
Ohio
21
10
67
714
1,749
—
0
1
1
—
—
0
2
22
23
Wisconsin
—
1
3
36
127
—
0
1
1
—
—
0
2
9
22
W.N. Central
3
7
65
639
973
—
0
1
9
5
—
2
26
261
344
Iowa
2
2
43
316
91
—
0
0
—
—
—
0
2
7
8
Kansas
—
1
4
41
130
—
0
0
—
—
—
0
0
—
—
Minnesota
—
0
9
—
390
—
0
0
—
—
—
0
0
—
15
Missouri
1
2
9
95
71
—
0
1
3
4
—
2
25
238
311
Nebraska
—
1
4
63
272
—
0
1
5
1
—
0
2
9
8
North Dakota
—
0
2
17
8
—
0
0
—
—
—
0
1
2
1
South Dakota
—
0
22
107
11
—
0
1
1
—
—
0
1
5
1
S. Atlantic
55
45
92
2,334
2,903
—
2
5
85
119
—
7
55
562
1,160
Delaware
—
0
2
12
22
—
0
0
—
—
—
0
2
9
30
District of Columbia
—
0
2
11
26
—
0
1
1
1
—
0
0
—
1
Florida
40
16
46
979
1,702
—
0
2
4
3
—
0
4
23
28
Georgia
—
15
36
856
660
—
1
5
61
92
—
0
0
—
—
Maryland
1
2
6
104
222
—
0
1
3
—
—
0
4
26
9
North Carolina
14
2
25
201
136
—
0
2
11
12
—
1
47
383
579
South Carolina
—
2
6
119
37
—
0
1
3
7
—
1
2
34
54
Virginia
—
0
7
45
91
—
0
1
1
4
—
1
11
82
457
West Virginia
—
0
2
7
7
—
0
1
1
—
—
0
2
5
2
E.S. Central
15
18
65
1,184
1,250
—
0
3
19
13
—
11
49
817
937
Alabama
3
5
14
283
332
—
0
1
2
3
—
3
17
234
164
Kentucky
—
1
6
57
426
—
0
1
2
3
—
1
6
62
59
Mississippi
—
4
13
215
285
—
0
1
2
2
—
0
4
29
23
Tennessee
12
7
50
629
207
—
0
2
13
5
—
7
30
492
691
W.S. Central
14
47
159
2,302
2,780
—
0
5
14
13
—
7
366
597
1,319
Arkansas
9
4
19
262
96
—
0
2
4
5
—
5
27
363
832
Louisiana
—
5
21
299
215
—
0
0
—
—
—
0
1
3
9
Oklahoma
5
3
60
173
543
—
0
5
9
6
—
0
351
177
403
Texas
—
28
95
1,568
1,926
—
0
1
1
2
—
1
8
54
75
Mountain
2
9
38
664
789
—
0
3
8
11
—
1
5
44
64
Arizona
—
6
27
396
444
—
0
3
7
10
—
0
5
34
40
Colorado
—
1
5
49
123
—
0
0
—
1
—
0
0
—
5
Idaho
2
0
2
11
9
—
0
1
1
—
—
0
0
—
4
Montana
—
0
10
72
11
—
0
0
—
—
—
0
1
2
3
Nevada
—
0
7
49
55
—
0
0
—
—
—
0
1
1
—
New Mexico
—
1
5
56
108
—
0
0
—
—
—
0
1
3
4
Utah
—
0
2
24
34
—
0
0
—
—
—
0
1
2
6
Wyoming
—
0
2
7
5
—
0
0
—
—
—
0
1
2
2
Pacific
3
21
47
1,157
1,330
—
0
1
2
9
—
0
1
7
13
Alaska
—
0
1
1
7
N
0
0
N
N
N
0
0
N
N
California
2
18
47
951
1,071
—
0
1
1
8
—
0
1
6
12
Hawaii
—
0
6
38
27
N
0
0
N
N
N
0
0
N
N
Oregon
1
1
4
54
92
—
0
1
1
—
—
0
1
1
1
Washington
—
1
11
113
133
—
0
1
—
1
—
0
0
—
—
Territories
American Samoa
—
—
—
—
5
N
—
—
N
N
N
—
—
N
N
C.N.M.I.
—
—
—
—
—
—
—
—
—
—
—
—
—
—
—
Guam
—
0
0
—
1
N
0
0
N
N
N
0
0
N
N
Puerto Rico
—
0
1
4
—
N
0
0
N
N
N
0
0
N
N
U.S. Virgin Islands
—
0
0
—
—
N
0
0
N
N
N
0
0
N
N
C.N.M.I.: Commonwealth of Northern Mariana Islands.
U: Unavailable. —: No reported cases. N: Not reportable. NN: Not Nationally Notifiable. Cum: Cumulative year-to-date counts. Med: Median. Max: Maximum.
† Illnesses with similar clinical presentation that result from Spotted fever group rickettsia infections are reported as Spotted fever rickettsioses. Rocky Mountain spotted fever (RMSF) caused by Rickettsia rickettsii, is the most common and well-known spotted fever.
TABLE II. (Continued) Provisional cases of selected notifiable diseases, United States, weeks ending December 28, 2013, and December 29, 2012 (52nd week)*
Reporting area
Streptococcus pneumoniae,† invasive disease
Syphilis, primary and secondary
All ages
Age <5
Current week
Previous 52 weeks
Cum 2013
Cum 2012
Current week
Previous 52 weeks
Cum 2013
Cum 2012
Current week
Previous 52 weeks
Cum 2013
Cum 2012
Med
Max
Med
Max
Med
Max
United States
149
259
966
14,665
15,635
12
20
55
1,026
1,266
40
316
452
15,639
15,667
New England
4
11
68
624
1,199
—
0
3
40
77
—
8
19
454
474
Connecticut
—
5
21
286
309
—
0
2
13
17
—
1
6
47
55
Maine
1
2
8
111
102
—
0
1
6
3
—
0
1
6
17
Massachusetts
—
0
13
21
571
—
0
2
18
50
—
6
18
336
316
New Hampshire
—
1
5
85
80
—
0
1
3
6
—
0
3
26
36
Rhode Island
3
0
29
65
73
—
0
0
—
1
—
0
3
34
44
Vermont
—
1
6
56
64
—
0
0
—
—
—
0
2
5
6
Mid. Atlantic
33
38
198
2,108
2,290
1
2
13
110
130
9
40
59
1,964
1,947
New Jersey
—
9
30
472
596
—
0
2
32
39
—
4
9
184
229
New York (Upstate)
27
19
147
977
1,045
1
1
9
46
64
5
5
32
257
233
New York City
6
12
36
659
649
—
0
3
32
27
—
21
35
1,080
991
Pennsylvania
N
—
—
N
N
N
0
0
N
N
4
8
16
443
494
E.N. Central
33
51
132
2,872
2,894
3
3
8
176
228
—
36
56
1,734
1,839
Illinois
N
0
0
N
N
—
1
3
41
49
—
12
28
616
804
Indiana
—
12
50
606
728
—
0
3
28
37
—
4
10
222
224
Michigan
5
13
30
692
540
—
1
3
40
30
—
8
17
422
295
Ohio
22
21
63
1,161
1,149
1
1
4
43
86
—
8
14
402
425
Wisconsin
6
8
26
413
477
2
0
3
24
26
—
1
5
72
91
W.N. Central
2
12
39
661
846
2
1
5
94
92
—
12
25
597
399
Iowa
N
0
0
N
N
N
0
0
N
N
—
1
6
87
70
Kansas
N
0
0
N
N
N
0
0
N
N
—
1
4
43
24
Minnesota
—
5
24
325
499
—
0
3
28
31
—
3
8
161
118
Missouri
N
0
0
N
N
1
0
3
33
36
—
4
10
238
157
Nebraska
2
3
7
153
143
1
0
1
14
14
—
0
3
34
8
North Dakota
—
1
6
87
108
—
0
1
9
—
—
0
2
7
4
South Dakota
—
2
6
96
96
—
0
2
10
11
—
0
3
27
18
S. Atlantic
39
64
145
3,357
3,210
1
5
13
249
277
12
75
184
3,785
3,805
Delaware
—
0
3
24
34
—
0
1
1
2
4
0
9
52
38
District of Columbia
1
1
7
81
60
—
0
1
1
4
—
3
8
171
165
Florida
34
18
59
1,079
988
1
2
5
94
80
3
26
43
1,384
1,369
Georgia
—
17
56
1,003
997
—
1
5
80
81
5
15
110
833
937
Maryland
4
8
26
462
426
—
0
4
29
31
—
8
16
389
431
North Carolina
N
0
0
N
N
N
0
0
N
N
—
7
34
410
347
South Carolina
—
7
21
424
382
—
0
2
19
27
—
5
13
270
225
Virginia
N
0
0
N
N
—
0
4
10
36
—
5
17
268
285
West Virginia
—
5
25
284
323
—
0
2
15
16
—
0
1
8
8
E.S. Central
12
27
59
1,371
1,298
1
1
5
91
96
—
10
17
496
782
Alabama
1
3
10
171
112
—
0
2
18
16
—
3
6
133
216
Kentucky
2
4
12
244
209
—
0
1
12
11
—
2
8
115
150
Mississippi
2
4
13
223
187
—
0
2
18
25
—
1
8
75
150
Tennessee
7
14
37
733
790
1
0
5
43
44
—
3
8
173
266
W.S. Central
12
33
368
1,755
1,967
2
3
24
149
197
—
41
64
2,081
2,222
Arkansas
—
2
24
177
185
—
0
1
8
13
—
3
10
161
173
Louisiana
2
5
14
284
247
—
0
2
21
29
—
7
18
338
339
Oklahoma
N
0
0
N
N
—
0
1
19
26
—
2
8
109
83
Texas
10
24
340
1,294
1,535
2
2
23
101
129
—
29
40
1,473
1,627
Mountain
9
31
76
1,740
1,714
—
2
7
97
142
4
14
26
728
698
Arizona
7
14
41
797
661
—
0
4
38
50
—
5
12
250
202
Colorado
—
7
22
365
429
—
0
2
19
35
—
3
9
152
208
Idaho
N
0
0
N
N
—
0
1
4
1
—
0
2
12
26
Montana
1
0
3
29
31
—
0
1
2
2
—
0
1
5
2
Nevada
—
2
7
120
107
—
0
1
4
9
4
3
14
192
113
New Mexico
—
5
17
288
273
—
0
1
11
20
—
1
4
71
101
Utah
—
2
11
120
183
—
0
2
18
23
—
1
4
45
42
Wyoming
1
0
3
21
30
—
0
1
1
2
—
0
1
1
4
Pacific
5
3
7
177
217
2
0
2
20
27
15
76
111
3,800
3,501
Alaska
4
2
6
104
138
2
0
1
15
19
—
0
3
22
11
California
N
0
0
N
N
N
0
0
N
N
9
64
94
3,241
2,953
Hawaii
1
1
4
73
79
—
0
1
5
8
—
1
3
36
23
Oregon
N
0
0
N
N
N
0
0
N
N
—
5
11
253
212
Washington
N
0
0
N
N
N
0
0
N
N
6
5
14
248
302
Territories
American Samoa
N
—
—
N
N
—
—
—
—
—
—
—
—
—
—
C.N.M.I.
—
—
—
—
—
—
—
—
—
—
—
—
—
—
—
Guam
—
0
0
—
—
—
0
0
—
—
—
0
0
—
—
Puerto Rico
—
0
0
—
—
—
0
0
—
—
—
6
30
374
306
U.S. Virgin Islands
—
0
0
—
—
—
0
0
—
—
—
0
1
1
—
C.N.M.I.: Commonwealth of Northern Mariana Islands.
U: Unavailable. —: No reported cases. N: Not reportable. NN: Not Nationally Notifiable. Cum: Cumulative year-to-date counts. Med: Median. Max: Maximum.
† Includes drug resistant and susceptible cases of invasive Streptococcus pneumoniae disease among children <5 years and among all ages. Case definition: Isolation of S. pneumoniae from a normally sterile body site (e.g., blood or cerebrospinal fluid).
TABLE II. (Continued) Provisional cases of selected notifiable diseases, United States, weeks ending December 28, 2013, and December 29, 2012 (52nd week)*
Reporting area
Varicella (chickenpox)
West Nile virus disease†
Neuroinvasive
Nonneuroinvasive§
Current week
Previous 52 weeks
Cum 2013
Cum 2012
Current week
Previous 52 weeks
Cum 2013
Cum 2012
Current week
Previous 52 weeks
Cum 2013
Cum 2012
Med
Max
Med
Max
Med
Max
United States
53
209
316
9,987
13,447
—
1
154
1,204
2,872
—
1
163
1,163
2,801
New England
—
18
42
919
1,424
—
0
3
11
42
—
0
2
5
21
Connecticut
—
4
9
213
265
—
0
1
1
12
—
0
1
3
9
Maine
—
3
7
138
258
—
0
0
—
1
—
0
0
—
—
Massachusetts
—
7
15
383
534
—
0
2
7
25
—
0
1
1
8
New Hampshire
—
1
4
57
142
—
0
1
1
1
—
0
0
—
—
Rhode Island
—
0
10
29
80
—
0
1
1
2
—
0
0
—
2
Vermont
—
1
27
99
145
—
0
1
1
1
—
0
1
1
2
Mid. Atlantic
4
20
40
1,068
1,327
—
0
7
28
116
—
0
6
20
99
New Jersey
—
5
21
345
466
—
0
4
9
22
—
0
2
2
26
New York (Upstate)
N
0
0
N
N
—
0
2
10
35
—
0
4
11
31
New York City
—
0
0
—
—
—
0
1
3
26
—
0
1
2
15
Pennsylvania
4
15
26
723
861
—
0
1
6
33
—
0
1
5
27
E.N. Central
18
63
104
3,228
3,583
—
0
26
165
494
—
0
14
55
253
Illinois
—
13
32
696
898
—
0
21
85
187
—
0
8
31
103
Indiana
—
5
14
306
469
—
0
6
18
46
—
0
1
4
31
Michigan
12
20
44
1,187
971
—
0
5
24
141
—
0
4
12
61
Ohio
4
13
33
661
806
—
0
3
20
76
—
0
2
4
45
Wisconsin
2
7
23
378
439
—
0
3
18
44
—
0
1
4
13
W.N. Central
1
5
15
305
881
—
0
51
280
225
—
0
71
448
437
Iowa
N
0
0
N
N
—
0
10
24
11
—
0
5
20
20
Kansas
—
0
2
—
395
—
0
8
31
20
—
0
17
52
36
Minnesota
—
0
0
—
—
—
0
7
31
34
—
0
8
48
36
Missouri
1
4
12
220
388
—
0
6
24
17
—
0
1
5
3
Nebraska
—
0
2
11
27
—
0
14
53
42
—
0
30
168
151
North Dakota
—
0
3
32
39
—
0
11
60
39
—
0
9
63
50
South Dakota
—
0
4
42
32
—
0
10
57
62
—
0
12
92
141
S. Atlantic
8
26
49
1,280
1,611
—
0
8
32
185
—
0
3
14
129
Delaware
—
0
2
18
3
—
0
1
3
2
—
0
0
—
7
District of Columbia
—
0
2
10
19
—
0
0
—
8
—
0
0
—
2
Florida
8
13
25
652
816
—
0
1
4
52
—
0
1
1
21
Georgia
—
0
5
37
51
—
0
1
2
46
—
0
1
4
53
Maryland
N
0
0
N
N
—
0
4
11
25
—
0
3
5
22
North Carolina
N
0
0
N
N
—
0
2
3
7
—
0
0
—
—
South Carolina
—
2
13
149
11
—
0
1
3
20
—
0
1
4
9
Virginia
—
6
19
299
505
—
0
2
6
20
—
0
0
—
10
West Virginia
—
2
8
115
206
—
0
0
—
5
—
0
0
—
5
E.S. Central
2
3
9
164
201
—
0
6
45
173
—
0
7
34
192
Alabama
2
3
8
159
190
—
0
0
—
38
—
0
3
7
24
Kentucky
N
0
0
N
N
—
0
1
1
13
—
0
1
2
10
Mississippi
—
0
1
5
11
—
0
5
27
103
—
0
3
18
144
Tennessee
N
0
0
N
N
—
0
3
17
19
—
0
2
7
14
W.S. Central
18
37
212
2,013
2,715
—
0
28
213
1,146
—
0
17
113
1,312
Arkansas
—
3
12
182
236
—
0
3
16
44
—
0
1
2
20
Louisiana
—
1
7
52
69
—
0
7
34
155
—
0
3
20
180
Oklahoma
N
0
0
N
N
—
0
9
59
103
—
0
5
26
88
Texas
18
33
209
1,779
2,410
—
0
16
104
844
—
0
12
65
1,024
Mountain
—
19
39
904
1,578
—
0
29
196
190
—
0
53
337
165
Arizona
—
6
23
350
535
—
0
4
31
87
—
0
2
10
46
Colorado
—
3
16
208
483
—
0
17
89
62
—
0
34
228
69
Idaho
N
0
0
N
N
—
0
5
14
5
—
0
7
26
12
Montana
—
1
6
82
132
—
0
5
10
1
—
0
7
28
5
Nevada
N
0
0
N
N
—
0
4
8
5
—
0
1
3
4
New Mexico
—
1
4
51
99
—
0
4
24
24
—
0
3
14
23
Utah
—
3
13
205
310
—
0
1
4
3
—
0
1
3
2
Wyoming
—
0
2
8
19
—
0
4
16
3
—
0
6
25
4
Pacific
2
2
6
106
127
—
0
27
234
301
—
0
18
137
193
Alaska
2
1
6
62
58
—
0
0
—
—
—
0
0
—
—
California
—
0
2
15
24
—
0
27
233
297
—
0
18
135
182
Hawaii
—
0
4
29
45
—
0
0
—
—
—
0
0
—
—
Oregon
N
0
0
N
N
—
0
1
1
—
—
0
1
1
11
Washington
N
0
0
N
N
—
0
0
—
4
—
0
1
1
—
Territories
American Samoa
N
—
—
N
N
—
—
—
—
—
—
—
—
—
—
C.N.M.I.
—
—
—
—
—
—
—
—
—
—
—
—
—
—
—
Guam
—
0
0
—
50
—
0
0
—
—
—
0
0
—
—
Puerto Rico
—
4
14
260
70
—
0
0
—
1
—
0
0
—
—
U.S. Virgin Islands
—
0
0
—
—
—
0
0
—
—
—
0
0
—
—
C.N.M.I.: Commonwealth of Northern Mariana Islands.
U: Unavailable. —: No reported cases. N: Not reportable. NN: Not Nationally Notifiable. Cum: Cumulative year-to-date counts. Med: Median. Max: Maximum.
† Updated weekly from reports to the Division of Vector-Borne Infectious Diseases, National Center for Zoonotic, Vector-Borne, and Enteric Diseases (ArboNET Surveillance). Data for California serogroup, eastern equine, Powassan, St. Louis, and western equine diseases are available in Table I.
§ Not reportable in all states. Data from states where the condition is not reportable are excluded from this table, except starting in 2007 for the domestic arboviral diseases and influenza-associated pediatric mortality, and in 2003 for SARS-CoV. Reporting exceptions are available at http://wwwn.cdc.gov/nndss/document/SRCA_FINAL_REPORT_2006-2012_final.xlsx.
TABLE III. Deaths in 122 U.S. cities,* week ending December 28, 2013 (52nd week)
Reporting area
All causes, by age (years)
P&I† Total
Reporting area (Continued)
All causes, by age (years)
P&I† Total
All Ages
=65
45–64
25–44
1–24
<1
All Ages
=65
45–64
25–44
1–24
<1
New England
488
361
94
21
4
8
43
S. Atlantic
806
497
219
60
14
16
48
Boston, MA
134
89
28
9
2
6
14
Atlanta, GA
70
49
16
4
1
—
3
Bridgeport, CT
38
29
6
2
1
—
1
Baltimore, MD
161
86
53
16
2
4
8
Cambridge, MA
16
12
4
—
—
—
1
Charlotte, NC
81
46
27
5
2
1
9
Fall River, MA
21
17
3
1
—
—
5
Jacksonville, FL
117
77
29
8
1
2
5
Hartford, CT
46
36
10
—
—
—
5
Miami, FL
38
30
4
2
1
1
2
Lowell, MA
20
16
4
—
—
—
4
Norfolk, VA
36
17
14
5
—
—
3
Lynn, MA
6
4
1
1
—
—
—
Richmond, VA
30
14
11
3
1
1
—
New Bedford, MA
28
21
4
1
1
1
1
Savannah, GA
44
30
8
4
—
2
5
New Haven, CT
46
31
13
2
—
—
2
St. Petersburg, FL
57
37
17
2
—
1
6
Providence, RI
32
24
8
—
—
—
—
Tampa, FL
96
65
16
10
5
—
4
Somerville, MA
1
1
—
—
—
—
—
Washington, D.C.
76
46
24
1
1
4
3
Springfield, MA
48
40
6
1
—
1
5
Wilmington, DE
U
U
U
U
U
U
U
Waterbury, CT
11
9
—
2
—
—
1
E.S. Central
614
420
143
38
8
5
43
Worcester, MA
41
32
7
2
—
—
4
Birmingham, AL
78
57
16
4
—
1
4
Mid. Atlantic
1,530
1,128
303
71
15
12
60
Chattanooga, TN
66
44
21
1
—
—
10
Albany, NY
45
33
10
2
—
—
3
Knoxville, TN
134
92
30
10
1
1
4
Allentown, PA
33
26
6
—
1
—
2
Lexington, KY
42
28
11
3
—
—
—
Buffalo, NY
90
67
15
5
2
1
5
Memphis, TN
119
74
30
9
5
1
10
Camden, NJ
20
10
6
4
—
—
—
Mobile, AL
39
30
7
2
—
—
5
Elizabeth, NJ
8
6
2
—
—
—
—
Montgomery, AL
24
17
5
—
2
—
1
Erie, PA
53
37
16
—
—
—
1
Nashville, TN
112
78
23
9
—
2
9
Jersey City, NJ
10
7
2
1
—
—
1
W.S. Central
658
437
151
43
16
11
37
New York City, NY
912
670
184
43
7
8
29
Austin, TX
62
40
19
1
1
1
6
Newark, NJ
37
21
9
5
2
—
2
Baton Rouge, LA
U
U
U
U
U
U
U
Paterson, NJ
U
U
U
U
U
U
U
Corpus Christi, TX
40
30
7
2
1
—
6
Philadelphia, PA
U
U
U
U
U
U
U
Dallas, TX
174
103
48
13
5
5
14
Pittsburgh, PA§
43
28
14
—
1
—
2
El Paso, TX
106
89
11
3
2
1
—
Reading, PA
30
24
2
1
1
2
1
Fort Worth, TX
U
U
U
U
U
U
U
Rochester, NY
126
101
20
3
1
1
6
Houston, TX
192
114
51
21
5
1
9
Schenectady, NY
27
22
3
2
—
—
2
Little Rock, AR
50
33
10
2
2
3
—
Scranton, PA
27
21
6
—
—
—
1
New Orleans, LA
U
U
U
U
U
U
U
Syracuse, NY
47
35
7
4
—
—
3
San Antonio, TX
U
U
U
U
U
U
U
Trenton, NJ
—
—
—
—
—
—
—
Shreveport, LA
U
U
U
U
U
U
U
Utica, NY
9
8
—
1
—
—
—
Tulsa, OK
34
28
5
1
—
—
2
Yonkers, NY
13
12
1
—
—
—
2
Mountain
852
624
173
35
11
9
65
E.N. Central
1,430
953
365
67
22
23
98
Albuquerque, NM
101
64
26
9
2
—
10
Akron, OH
35
27
6
1
—
1
2
Boise, ID
37
31
5
1
—
—
5
Canton, OH
29
17
8
3
—
1
—
Colorado Springs, CO
59
42
16
1
—
—
1
Chicago, IL
285
170
88
13
10
4
16
Denver, CO
79
57
19
3
—
—
7
Cincinnati, OH
64
32
23
8
1
—
6
Las Vegas, NV
154
118
24
7
3
2
16
Cleveland, OH
173
119
44
5
4
1
8
Ogden, UT
29
18
6
4
1
—
3
Columbus, OH
152
98
46
6
—
2
9
Phoenix, AZ
258
203
43
6
3
3
16
Dayton, OH
110
81
25
2
1
1
5
Pueblo, CO
21
19
2
—
—
—
—
Detroit, MI
U
U
U
U
U
U
U
Salt Lake City, UT
114
72
32
4
2
4
7
Evansville, IN
38
20
14
2
—
2
8
Tucson, AZ
U
U
U
U
U
U
U
Fort Wayne, IN
53
41
11
1
—
—
1
Pacific
1,389
972
295
77
26
19
110
Gary, IN
7
5
—
—
—
2
—
Berkeley, CA
9
6
1
2
—
—
3
Grand Rapids, MI
46
38
6
—
—
2
3
Fresno, CA
117
89
18
6
—
4
12
Indianapolis, IN
147
95
33
13
2
4
8
Glendale, CA
24
20
4
—
—
—
3
Lansing, MI
4
4
—
—
—
—
4
Honolulu, HI
57
38
14
2
3
—
6
Milwaukee, WI
84
46
28
5
3
2
12
Long Beach, CA
55
36
14
2
1
2
3
Peoria, IL
U
U
U
U
U
U
U
Los Angeles, CA
216
149
47
11
5
4
21
Rockford, IL
48
37
8
3
—
—
4
Pasadena, CA
19
12
6
1
—
—
2
South Bend, IN
40
28
10
2
—
—
3
Portland, OR
94
64
23
5
2
—
4
Toledo, OH
62
51
8
1
1
1
6
Sacramento, CA
152
106
28
10
6
2
12
Youngstown, OH
53
44
7
2
—
—
3
San Diego, CA
112
83
20
5
4
—
9
W.N. Central
517
341
126
26
9
13
32
San Francisco, CA
96
66
23
6
—
1
11
Des Moines, IA
76
55
17
4
—
—
5
San Jose, CA
155
108
29
13
2
3
12
Duluth, MN
28
21
6
—
—
1
1
Santa Cruz, CA
20
17
1
2
—
—
1
Kansas City, KS
22
11
9
1
—
—
1
Seattle, WA
110
70
29
6
2
3
3
Kansas City, MO
66
47
15
2
—
2
4
Spokane, WA
41
32
9
—
—
—
2
Lincoln, NE
52
36
14
—
2
—
4
Tacoma, WA
112
76
29
6
1
—
6
Minneapolis, MN
46
31
10
3
—
2
3
Total¶
8,284
5,733
1,869
438
125
116
536
Omaha, NE
57
38
10
4
1
4
5
St. Louis, MO
51
22
19
3
4
2
3
St. Paul, MN
36
26
7
2
1
—
2
Wichita, KS
83
54
19
7
1
2
4
U: Unavailable. —: No reported cases.
* Mortality data in this table are voluntarily reported from 122 cities in the United States, most of which have populations of >100,000. A death is reported by the place of its occurrence and by the week that the death certificate was filed. Fetal deaths are not included.
† Pneumonia and influenza.
§ Because of changes in reporting methods in this Pennsylvania city, these numbers are partial counts for the current week. Complete counts will be available in 4 to 6 weeks.