Persons using assistive technology might not be able to fully access information in this file. For assistance, please send e-mail to: mmwrq@cdc.gov. Type 508 Accommodation and the title of the report in the subject line of e-mail.
Notifiable Diseases and Mortality Tables
Table I Summary of provisional cases of selected notifiable diseases, United States, cumulative, week ending January 26, 2013 (4th Week)
Figure I Selected notifiable disease reports, United States, comparison of provisional 4-week totals ending January 26, 2013, with historical data
Table II Provisional cases of selected notifiable diseases, United States, weeks ending January 26, 2013 and January 28, 2012 (4th Week)
Table III Deaths in 122 U.S. cities, week ending January 26, 2013 (4th Week)
TABLE I. Provisional cases of infrequently reported notifiable diseases (<1,000 cases reported during the preceding year) — United States, week ending January 26, 2013 (4th week)*
TABLE I. (Continued) Provisional cases of infrequently reported notifiable diseases (<1,000 cases reported during the preceding year) — United States, week ending January 26, 2013 (4th week)*
—: No reported cases. N: Not reportable. NN: Not Nationally Notifiable. Cum: Cumulative year-to-date counts.
† Calculated by summing the incidence counts for the current week, the 2 weeks preceding the current week, and the 2 weeks following the current week, for a total of 5 preceding years. The total sum of incident cases is then divided by 25 weeks. Additional information is available at http://wwwn.cdc.gov/nndss/document/5yearweeklyaverage.pdf.
§ Not reportable in all states. Data from states where the condition is not reportable are excluded from this table except starting in 2007 for the arboviral diseases, STD data, TB data, and influenza-associated pediatric mortality, and in 2003 for SARS-CoV. Reporting exceptions are available at http://wwwn.cdc.gov/nndss/document/SRCA_FINAL_REPORT_2006-2010.xlsx.
¶ Includes both neuroinvasive and nonneuroinvasive. Updated weekly from reports to the Division of Vector-Borne Infectious Diseases, National Center for Zoonotic, Vector-Borne, and Enteric Diseases (ArboNET Surveillance). Data for West Nile virus are available in Table II.
** Data for H. influenzae (all ages, all serotypes) are available in Table II.
†† Updated weekly from reports to the Influenza Division, National Center for Immunization and Respiratory Diseases. Since September 30, 2012, 45 influenza-associated pediatric deaths occurring during the 2012-13 influenza season have been reported.
§§ The two measles cases reported for the current week were imported.
¶¶ Data for meningococcal disease (all serogroups) are available in Table II.
*** CDC discontinued reporting of individual confirmed and probable cases of 2009 pandemic influenza A (H1N1) virus infections on July 24, 2009. During 2009, four cases of human infection with novel influenza A viruses, different from the 2009 pandemic influenza A (H1N1) strain, were reported to CDC. The four cases of novel influenza A virus infection reported to CDC during 2010, the fourteen cases reported during 2011, and the 313 cases reported in 2012 are different from the 2009 pandemic influenza A (H1N1) virus. Total case counts are provided by the Influenza Division, National Center for Immunization and Respiratory Diseases (NCIRD).
††† No rubella cases were reported for the current week.
§§§ Updated weekly from reports to the Division of STD Prevention, National Center for HIV/AIDS, Viral Hepatitis, STD, and TB Prevention.
¶¶¶ There were no cases of viral hemorrhagic fever reported during the current week. See Table II for dengue hemorrhagic fever.
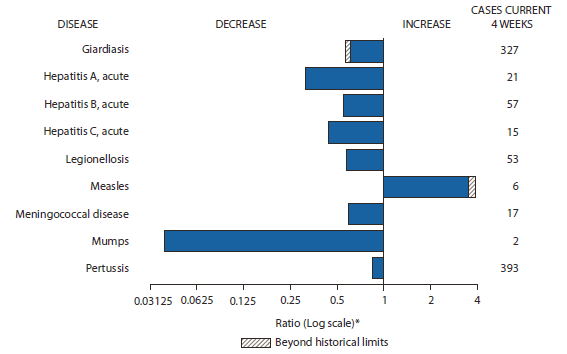
FIGURE I. Selected notifiable disease reports, United States, comparison of provisional 4-week totals January 26, 2013, with historical data
* Ratio of current 4-week total to mean of 15 4-week totals (from previous, comparable, and subsequent 4-week periods for the past 5 years). The point where the hatched area begins is based on the mean and two standard deviations of these 4-week totals.
Alternate Text: The figure above shows selected notifiable disease reports for the United States with comparison of provisional 4-week totals through January 26, 2013, with historical date. Reports of measles increased beyond historical limits. Reports of giardiasis, acute hepatitis A, acute hepatitis B, acute hepatitis C, legionellosis, meningococcal disease, mumps and pertussis all decreased, with giardiasis decreasing beyond historical limits.
TABLE II. Provisional cases of selected notifiable diseases, United States, weeks ending January 26, 2013, and January 28, 2012 (4th week)*
Reporting area
Chlamydia trachomatis infection
Coccidioidomycosis
Cryptosporidiosis
Current week
Previous 52 weeks
Cum 2013
Cum 2012
Current week
Previous 52 weeks
Cum 2013
Cum 2012
Current week
Previous 52 weeks
Cum 2013
Cum 2012
Med
Max
Med
Max
Med
Max
United States
14,049
27,349
30,672
75,051
106,820
10
274
551
81
1,573
50
125
279
221
427
New England
583
948
1,349
2,662
3,362
—
0
1
—
—
—
7
19
5
25
Connecticut
30
243
567
283
792
N
0
0
N
N
—
1
3
3
4
Maine
—
61
101
—
259
N
0
0
N
N
—
1
4
—
2
Massachusetts
334
472
706
1,750
1,669
—
0
0
—
—
—
3
8
—
11
New Hampshire
4
59
83
94
236
—
0
1
—
—
—
0
4
—
3
Rhode Island
118
84
186
320
406
—
0
1
—
—
—
0
3
—
—
Vermont
97
28
87
215
—
N
0
0
N
N
—
1
6
2
5
Mid. Atlantic
2,177
4,278
4,849
12,399
16,296
—
0
1
—
1
5
12
41
22
42
New Jersey
169
540
624
1,626
2,183
N
0
0
N
N
—
0
4
—
4
New York (Upstate)
679
722
1,480
1,821
1,892
N
0
0
N
N
—
2
18
—
8
New York City
463
1,133
1,322
3,637
4,761
N
0
0
N
N
1
2
8
4
6
Pennsylvania
866
1,889
2,358
5,315
7,460
—
0
1
—
1
4
7
21
18
24
E.N. Central
1,254
4,140
4,653
8,730
16,889
—
1
4
1
5
15
29
108
49
117
Illinois
31
1,133
1,510
1,175
5,232
N
0
0
N
N
—
3
8
—
9
Indiana
159
575
838
1,313
2,036
N
0
0
N
N
—
3
8
2
9
Michigan
579
914
1,207
2,392
3,644
—
0
3
1
2
1
5
40
10
25
Ohio
225
1,025
1,189
2,330
4,117
—
0
2
—
3
13
10
28
24
46
Wisconsin
260
469
551
1,520
1,860
—
0
0
—
—
1
8
41
13
28
W.N. Central
130
1,545
1,788
2,858
6,753
—
2
8
—
7
5
16
41
24
41
Iowa
6
213
274
419
1,117
N
0
0
N
N
—
5
22
5
19
Kansas
39
207
292
479
1,055
N
0
0
N
N
—
1
4
—
2
Minnesota
—
313
365
—
1,386
—
2
7
—
7
—
0
0
—
—
Missouri
55
545
657
1,231
2,147
—
0
1
—
—
5
4
12
11
8
Nebraska
—
134
195
421
551
—
0
1
—
—
—
2
10
6
2
North Dakota
1
51
73
71
208
—
0
0
—
—
—
0
3
—
2
South Dakota
29
73
106
237
289
N
0
0
N
N
—
2
6
2
8
S. Atlantic
4,191
5,318
6,337
17,694
21,105
—
0
1
—
—
19
20
59
64
78
Delaware
189
83
322
608
245
—
0
1
—
—
—
0
4
—
1
District of Columbia
—
133
239
297
529
—
0
0
—
—
N
0
0
N
N
Florida
952
1,510
1,729
4,862
5,770
N
0
0
N
N
6
9
24
21
27
Georgia
776
959
1,230
3,182
4,043
N
0
0
N
N
4
4
15
12
20
Maryland
235
441
1,128
966
1,122
—
0
1
—
—
1
2
5
5
12
North Carolina
790
889
1,771
2,843
4,079
N
0
0
N
N
4
0
29
13
—
South Carolina
569
514
908
1,944
2,219
N
0
0
N
N
4
1
4
8
8
Virginia
594
669
903
2,654
2,762
N
0
0
N
N
—
3
6
5
9
West Virginia
86
91
149
338
336
N
0
0
N
N
—
0
1
—
1
E.S. Central
516
1,987
2,647
2,264
7,973
—
0
0
—
—
3
5
14
11
21
Alabama
—
577
862
—
2,092
N
0
0
N
N
1
2
6
8
9
Kentucky
242
336
787
985
873
N
0
0
N
N
—
1
4
—
1
Mississippi
274
415
792
1,279
2,393
N
0
0
N
N
—
0
4
1
4
Tennessee
—
637
827
—
2,615
N
0
0
N
N
2
1
5
2
7
W.S. Central
2,512
3,301
4,357
11,507
11,470
—
0
1
—
—
—
9
20
16
25
Arkansas
262
329
412
1,182
1,333
N
0
0
N
N
—
1
5
1
2
Louisiana
444
454
1,316
1,426
584
—
0
1
—
—
—
2
7
7
8
Oklahoma
192
80
705
466
337
N
0
0
N
N
—
2
6
3
2
Texas
1,614
2,474
3,482
8,433
9,216
N
0
0
N
N
—
4
17
5
13
Mountain
950
1,788
2,071
5,056
6,499
—
201
440
3
1,060
2
11
44
10
34
Arizona
—
597
872
969
2,247
—
194
438
1
1,048
—
1
4
1
—
Colorado
318
424
556
1,541
1,572
N
0
0
N
N
1
1
7
2
4
Idaho
129
85
157
291
318
N
0
0
N
N
1
3
25
3
10
Montana
54
76
108
241
288
—
0
1
—
—
—
1
4
—
5
Nevada
182
214
325
684
404
—
2
7
2
6
—
0
2
1
2
New Mexico
234
222
463
971
847
—
0
4
—
2
—
1
7
2
5
Utah
33
150
179
331
693
—
1
4
—
4
—
2
20
1
5
Wyoming
—
35
62
28
130
—
0
2
—
—
—
0
4
—
3
Pacific
1,736
4,183
4,916
11,881
16,473
10
70
143
77
500
1
13
25
20
44
Alaska
24
105
150
366
458
N
0
0
N
N
—
0
1
—
—
California
1,069
3,224
3,816
9,208
12,907
10
70
143
77
499
—
7
15
14
29
Hawaii
—
121
148
156
455
N
0
0
N
N
—
0
1
—
1
Oregon
292
260
368
871
1,058
—
0
1
—
1
—
3
11
5
14
Washington
351
462
607
1,280
1,595
—
0
0
—
—
1
1
12
1
—
Territories
American Samoa
—
0
59
—
—
N
0
0
N
N
N
0
0
N
N
C.N.M.I.
—
—
—
—
—
—
—
—
—
—
—
—
—
—
—
Guam
—
—
—
—
—
—
—
—
—
—
—
—
—
—
—
Puerto Rico
62
111
307
258
314
N
0
0
N
N
N
0
0
N
N
U.S. Virgin Islands
—
15
29
—
54
—
0
0
—
—
—
0
0
—
—
C.N.M.I.: Commonwealth of Northern Mariana Islands.
U: Unavailable. —: No reported cases. N: Not reportable. NN: Not Nationally Notifiable. Cum: Cumulative year-to-date counts. Med: Median. Max: Maximum.
TABLE II. (Continued) Provisional cases of selected notifiable diseases, United States, weeks ending January 26, 2013, and January 28, 2012 (4th week)*
Reporting area
Dengue Virus Infection
Dengue Fever†
Dengue Hemorrhagic Fever§
Current week
Previous 52 weeks
Cum 2013
Cum 2012
Current week
Previous 52 weeks
Cum 2013
Cum 2012
Med
Max
Med
Max
United States
—
6
26
—
19
—
0
1
—
—
New England
—
0
3
—
2
—
0
0
—
—
Connecticut
—
0
3
—
1
—
0
0
—
—
Maine
—
0
0
—
—
—
0
0
—
—
Massachusetts
—
0
0
—
—
—
0
0
—
—
New Hampshire
—
0
0
—
—
—
0
0
—
—
Rhode Island
—
0
0
—
—
—
0
0
—
—
Vermont
—
0
0
—
1
—
0
0
—
—
Mid. Atlantic
—
1
8
—
7
—
0
0
—
—
New Jersey
—
0
0
—
—
—
0
0
—
—
New York (Upstate)
—
0
0
—
—
—
0
0
—
—
New York City
—
1
7
—
3
—
0
0
—
—
Pennsylvania
—
0
2
—
4
—
0
0
—
—
E.N. Central
—
1
3
—
2
—
0
1
—
—
Illinois
—
0
2
—
1
—
0
1
—
—
Indiana
—
0
2
—
—
—
0
0
—
—
Michigan
—
0
1
—
—
—
0
0
—
—
Ohio
—
0
1
—
—
—
0
0
—
—
Wisconsin
—
0
1
—
1
—
0
0
—
—
W.N. Central
—
0
3
—
—
—
0
0
—
—
Iowa
—
0
1
—
—
—
0
0
—
—
Kansas
—
0
0
—
—
—
0
0
—
—
Minnesota
—
0
3
—
—
—
0
0
—
—
Missouri
—
0
1
—
—
—
0
0
—
—
Nebraska
—
0
0
—
—
—
0
0
—
—
North Dakota
—
0
0
—
—
—
0
0
—
—
South Dakota
—
0
1
—
—
—
0
0
—
—
S. Atlantic
—
2
12
—
7
—
0
0
—
—
Delaware
—
0
0
—
—
—
0
0
—
—
District of Columbia
—
0
0
—
—
—
0
0
—
—
Florida
—
1
9
—
6
—
0
0
—
—
Georgia
—
0
2
—
—
—
0
0
—
—
Maryland
—
0
1
—
—
—
0
0
—
—
North Carolina
—
0
1
—
—
—
0
0
—
—
South Carolina
—
0
1
—
—
—
0
0
—
—
Virginia
—
0
2
—
1
—
0
0
—
—
West Virginia
—
0
0
—
—
—
0
0
—
—
E.S. Central
—
0
2
—
—
—
0
0
—
—
Alabama
—
0
2
—
—
—
0
0
—
—
Kentucky
—
0
1
—
—
—
0
0
—
—
Mississippi
—
0
1
—
—
—
0
0
—
—
Tennessee
—
0
2
—
—
—
0
0
—
—
W.S. Central
—
0
2
—
—
—
0
0
—
—
Arkansas
—
0
0
—
—
—
0
0
—
—
Louisiana
—
0
0
—
—
—
0
0
—
—
Oklahoma
—
0
1
—
—
—
0
0
—
—
Texas
—
0
2
—
—
—
0
0
—
—
Mountain
—
0
1
—
—
—
0
0
—
—
Arizona
—
0
1
—
—
—
0
0
—
—
Colorado
—
0
0
—
—
—
0
0
—
—
Idaho
—
0
1
—
—
—
0
0
—
—
Montana
—
0
1
—
—
—
0
0
—
—
Nevada
—
0
1
—
—
—
0
0
—
—
New Mexico
—
0
0
—
—
—
0
0
—
—
Utah
—
0
0
—
—
—
0
0
—
—
Wyoming
—
0
0
—
—
—
0
0
—
—
Pacific
—
1
5
—
1
—
0
1
—
—
Alaska
—
0
1
—
—
—
0
0
—
—
California
—
1
4
—
1
—
0
0
—
—
Hawaii
—
0
2
—
—
—
0
0
—
—
Oregon
—
0
0
—
—
—
0
0
—
—
Washington
—
0
2
—
—
—
0
1
—
—
Territories
American Samoa
—
0
0
—
—
—
0
0
—
—
C.N.M.I.
—
—
—
—
—
—
—
—
—
—
Guam
—
—
—
—
—
—
—
—
—
—
Puerto Rico
—
50
343
1
88
—
0
3
—
3
U.S. Virgin Islands
—
0
0
—
—
—
0
0
—
—
C.N.M.I.: Commonwealth of Northern Mariana Islands.
U: Unavailable. —: No reported cases. N: Not reportable. NN: Not Nationally Notifiable. Cum: Cumulative year-to-date counts. Med: Median. Max: Maximum.
† Dengue Fever includes cases that meet criteria for Dengue Fever with hemorrhage, other clinical and unknown case classifications.
§ DHF includes cases that meet criteria for dengue shock syndrome (DSS), a more severe form of DHF.
TABLE II. (Continued) Provisional cases of selected notifiable diseases, United States, weeks ending January 26, 2013, and January 28, 2012 (4th week)*
Reporting area
Ehrlichiosis/Anaplasmosis†
Ehrlichia chaffeensis
Anaplasma phagocytophilum
Undetermined
Current week
Previous 52 weeks
Cum 2013
Cum 2012
Current week
Previous 52 weeks
Cum 2013
Cum 2012
Current week
Previous 52 weeks
Cum 2013
Cum 2012
Med
Max
Med
Max
Med
Max
United States
2
9
64
3
4
—
13
41
2
16
—
2
14
—
—
New England
—
0
4
—
—
—
4
20
—
10
—
0
0
—
—
Connecticut
—
0
0
—
—
—
1
10
—
9
—
0
0
—
—
Maine
—
0
2
—
—
—
0
4
—
1
—
0
0
—
—
Massachusetts
—
0
0
—
—
—
0
0
—
—
—
0
0
—
—
New Hampshire
—
0
1
—
—
—
1
5
—
—
—
0
0
—
—
Rhode Island
—
0
3
—
—
—
1
11
—
—
—
0
0
—
—
Vermont
—
0
0
—
—
—
0
2
—
—
—
0
0
—
—
Mid. Atlantic
—
0
6
—
—
—
5
18
1
3
—
0
2
—
—
New Jersey
—
0
0
—
—
—
0
1
—
—
—
0
0
—
—
New York (Upstate)
—
0
3
—
—
—
4
18
—
1
—
0
2
—
—
New York City
—
0
3
—
—
—
0
4
1
2
—
0
0
—
—
Pennsylvania
—
0
1
—
—
—
0
0
—
—
—
0
0
—
—
E.N. Central
—
0
4
—
—
—
1
5
—
1
—
1
9
—
—
Illinois
—
0
4
—
—
—
0
1
—
1
—
0
1
—
—
Indiana
—
0
0
—
—
—
0
0
—
—
—
0
7
—
—
Michigan
—
0
0
—
—
—
0
0
—
—
—
0
1
—
—
Ohio
—
0
1
—
—
—
0
1
—
—
—
0
1
—
—
Wisconsin
—
0
1
—
—
—
0
5
—
—
—
0
2
—
—
W.N. Central
—
2
33
—
2
—
1
7
—
—
—
0
4
—
—
Iowa
N
0
0
N
N
N
0
0
N
N
N
0
0
N
N
Kansas
—
0
4
—
1
—
0
2
—
—
—
0
0
—
—
Minnesota
—
0
1
—
—
—
1
5
—
—
—
0
1
—
—
Missouri
—
2
32
—
1
—
0
4
—
—
—
0
4
—
—
Nebraska
—
0
0
—
—
—
0
1
—
—
—
0
0
—
—
North Dakota
—
0
0
—
—
—
0
0
—
—
—
0
0
—
—
South Dakota
—
0
0
—
—
—
0
0
—
—
—
0
1
—
—
S. Atlantic
2
4
30
3
2
—
0
8
1
1
—
0
2
—
—
Delaware
—
0
2
—
—
—
0
1
—
—
—
0
0
—
—
District of Columbia
N
0
0
N
N
N
0
0
N
N
N
0
0
N
N
Florida
—
0
3
—
—
—
0
2
—
—
—
0
0
—
—
Georgia
2
0
4
3
—
—
0
1
—
1
—
0
1
—
—
Maryland
—
0
4
—
—
—
0
2
—
—
—
0
0
—
—
North Carolina
—
0
19
—
—
—
0
6
—
—
—
0
0
—
—
South Carolina
—
0
1
—
—
—
0
0
—
—
—
0
0
—
—
Virginia
—
1
16
—
2
—
0
2
1
—
—
0
2
—
—
West Virginia
—
0
0
—
—
—
0
1
—
—
—
0
1
—
—
E.S. Central
—
1
9
—
—
—
0
3
—
1
—
0
2
—
—
Alabama
—
0
1
—
—
—
0
3
—
1
—
0
1
—
—
Kentucky
—
0
4
—
—
—
0
1
—
—
—
0
0
—
—
Mississippi
—
0
1
—
—
—
0
1
—
—
—
0
1
—
—
Tennessee
—
1
6
—
—
—
0
2
—
—
—
0
1
—
—
W.S. Central
—
0
16
—
—
—
0
2
—
—
—
0
1
—
—
Arkansas
—
0
11
—
—
—
0
1
—
—
—
0
0
—
—
Louisiana
—
0
1
—
—
—
0
0
—
—
—
0
1
—
—
Oklahoma
—
0
14
—
—
—
0
2
—
—
—
0
0
—
—
Texas
—
0
1
—
—
—
0
1
—
—
—
0
0
—
—
Mountain
—
0
0
—
—
—
0
0
—
—
—
0
0
—
—
Arizona
—
0
0
—
—
—
0
0
—
—
—
0
0
—
—
Colorado
N
0
0
N
N
N
0
0
N
N
N
0
0
N
N
Idaho
N
0
0
N
N
N
0
0
N
N
N
0
0
N
N
Montana
N
0
0
N
N
N
0
0
N
N
N
0
0
N
N
Nevada
—
0
0
—
—
—
0
0
—
—
—
0
0
—
—
New Mexico
N
0
0
N
N
N
0
0
N
N
N
0
0
N
N
Utah
—
0
0
—
—
—
0
0
—
—
—
0
0
—
—
Wyoming
—
0
0
—
—
—
0
0
—
—
—
0
0
—
—
Pacific
—
0
0
—
—
—
0
0
—
—
—
0
1
—
—
Alaska
N
0
0
N
N
N
0
0
N
N
N
0
0
N
N
California
—
0
0
—
—
—
0
0
—
—
—
0
1
—
—
Hawaii
N
0
0
N
N
N
0
0
N
N
N
0
0
N
N
Oregon
—
0
0
—
—
—
0
0
—
—
—
0
0
—
—
Washington
—
0
0
—
—
—
0
0
—
—
—
0
0
—
—
Territories
American Samoa
N
0
0
N
N
N
0
0
N
N
N
0
0
N
N
C.N.M.I.
—
—
—
—
—
—
—
—
—
—
—
—
—
—
—
Guam
N
—
—
N
N
N
—
—
N
N
N
—
—
N
N
Puerto Rico
N
0
0
N
N
N
0
0
N
N
N
0
0
N
N
U.S. Virgin Islands
—
0
0
—
—
—
0
0
—
—
—
0
0
—
—
C.N.M.I.: Commonwealth of Northern Mariana Islands.
U: Unavailable. —: No reported cases. N: Not reportable. NN: Not Nationally Notifiable. Cum: Cumulative year-to-date counts. Med: Median. Max: Maximum.
† Cumulative total E. ewingii cases reported for year 2012 = 13, and 0 cases reported for 2013.
TABLE II. (Continued) Provisional cases of selected notifiable diseases, United States, weeks ending January 26, 2013, and January 28, 2012 (4th week)*
Reporting area
Giardiasis
Gonorrhea
Haemophilus influenzae, invasive† All ages, all serotypes
Current week
Previous 52 weeks
Cum 2013
Cum 2012
Current week
Previous 52 weeks
Cum 2013
Cum 2012
Current week
Previous 52 weeks
Cum 2013
Cum 2012
Med
Max
Med
Max
Med
Max
United States
116
242
405
535
904
3,192
6,445
7,404
18,229
25,542
36
62
112
212
348
New England
1
24
50
17
86
67
113
164
337
372
—
3
8
5
27
Connecticut
—
3
9
3
20
10
43
84
97
117
—
1
5
—
9
Maine
1
3
10
4
7
—
8
14
—
34
—
0
2
2
2
Massachusetts
—
12
27
3
47
48
49
99
200
164
—
2
5
2
14
New Hampshire
—
1
6
2
5
4
3
9
16
15
—
0
0
—
2
Rhode Island
—
0
7
1
2
2
10
18
17
42
—
0
1
—
—
Vermont
—
3
10
4
5
3
2
10
7
—
—
0
1
1
—
Mid. Atlantic
13
47
80
67
153
448
1,146
1,326
3,066
4,354
8
13
42
42
89
New Jersey
—
3
12
—
24
31
145
192
391
603
—
2
7
3
17
New York (Upstate)
—
15
47
—
33
122
148
374
335
347
2
3
28
7
10
New York City
5
16
26
36
69
102
281
349
919
1,111
3
3
7
15
24
Pennsylvania
8
12
23
31
27
193
570
736
1,421
2,293
3
4
9
17
38
E.N. Central
23
38
72
72
183
358
1,053
1,290
2,395
4,493
4
8
18
22
52
Illinois
—
6
14
1
41
2
290
370
297
1,333
—
2
7
1
16
Indiana
—
4
10
1
18
48
147
208
348
504
—
2
6
3
7
Michigan
3
9
21
15
43
175
230
356
704
1,038
1
1
4
4
7
Ohio
18
10
22
41
43
73
312
395
713
1,235
3
3
8
14
17
Wisconsin
2
7
23
14
38
60
90
149
333
383
—
0
3
—
5
W.N. Central
9
19
43
43
98
40
334
433
645
1,392
1
5
9
16
18
Iowa
—
4
11
7
21
1
35
53
75
198
—
0
0
—
—
Kansas
—
2
7
2
13
7
41
71
76
221
1
0
3
3
2
Minnesota
—
0
0
—
—
—
50
87
—
193
—
1
5
—
9
Missouri
4
6
14
19
30
32
155
198
398
608
—
2
6
10
3
Nebraska
4
2
11
12
15
—
28
46
78
111
—
0
3
2
2
North Dakota
—
1
4
—
8
—
6
10
6
25
—
0
2
1
2
South Dakota
1
2
9
3
11
—
13
25
12
36
—
0
0
—
—
S. Atlantic
29
46
63
134
143
1,059
1,337
1,649
4,690
5,760
13
15
30
67
75
Delaware
—
0
2
1
—
37
18
49
111
50
2
0
2
3
—
District of Columbia
—
0
5
—
3
—
45
94
91
220
—
0
1
—
—
Florida
19
21
35
85
61
242
379
477
1,343
1,479
5
4
9
20
15
Georgia
1
8
27
13
34
207
272
358
872
1,166
—
3
7
10
17
Maryland
6
5
11
17
21
46
98
229
253
293
1
2
6
10
11
North Carolina
N
0
0
N
N
217
241
544
841
1,238
4
1
9
8
9
South Carolina
1
2
6
8
12
164
142
219
567
666
—
1
7
13
11
Virginia
2
5
10
10
12
122
130
214
544
606
1
2
9
3
8
West Virginia
—
0
5
—
—
24
15
32
68
42
—
1
6
—
4
E.S. Central
2
3
13
7
14
146
546
790
707
2,298
6
4
12
23
23
Alabama
2
3
13
7
14
—
179
255
—
652
2
1
4
9
6
Kentucky
N
0
0
N
N
72
86
215
273
245
1
1
3
4
4
Mississippi
N
0
0
N
N
74
123
229
434
683
—
0
3
2
3
Tennessee
N
0
0
N
N
—
171
255
—
718
3
2
7
8
10
W.S. Central
2
5
16
6
23
510
896
1,210
2,972
3,096
—
3
14
7
17
Arkansas
2
2
7
3
5
63
84
123
357
379
—
0
3
—
2
Louisiana
—
3
10
3
18
61
121
404
247
238
—
1
5
3
10
Oklahoma
—
0
0
—
—
20
20
193
72
108
—
1
13
4
5
Texas
N
0
0
N
N
366
618
1,030
2,296
2,371
—
0
1
—
—
Mountain
10
21
47
40
60
101
255
323
723
925
4
5
16
21
29
Arizona
—
2
4
1
5
—
108
161
230
425
1
1
6
5
10
Colorado
6
7
15
21
26
35
55
97
220
180
2
1
5
8
4
Idaho
4
2
8
6
5
—
3
9
8
8
—
0
2
2
—
Montana
—
1
4
1
2
2
2
8
12
3
—
0
2
—
1
Nevada
—
2
5
6
5
47
43
79
167
77
—
0
2
2
2
New Mexico
—
1
7
2
4
13
34
60
59
188
1
1
5
4
5
Utah
—
4
15
—
11
4
9
18
27
40
—
0
4
—
6
Wyoming
—
1
2
3
2
—
0
4
—
4
—
0
1
—
1
Pacific
27
51
85
149
144
463
760
901
2,694
2,852
—
3
9
9
18
Alaska
—
2
6
1
5
5
13
33
56
57
—
0
2
—
—
California
22
31
59
115
112
355
652
747
2,238
2,419
—
1
5
1
7
Hawaii
—
0
3
—
3
—
14
23
37
60
—
0
2
—
2
Oregon
4
8
15
30
20
33
27
43
113
102
—
1
6
8
9
Washington
1
8
33
3
4
70
59
98
250
214
—
0
2
—
—
Territories
American Samoa
—
0
0
—
—
—
0
0
—
—
—
0
0
—
—
C.N.M.I.
—
—
—
—
—
—
—
—
—
—
—
—
—
—
—
Guam
—
—
—
—
—
—
—
—
—
—
—
—
—
—
—
Puerto Rico
—
0
1
—
—
—
7
24
13
11
—
0
0
—
—
U.S. Virgin Islands
—
0
0
—
—
—
2
7
—
15
—
0
0
—
—
C.N.M.I.: Commonwealth of Northern Mariana Islands.
U: Unavailable. —: No reported cases. N: Not reportable. NN: Not Nationally Notifiable. Cum: Cumulative year-to-date counts. Med: Median. Max: Maximum.
† Data for H. influenzae (age <5 yrs for serotype b, nonserotype b, and unknown serotype) are available in Table I.
TABLE II. (Continued) Provisional cases of selected notifiable diseases, United States, weeks ending January 26, 2013, and January 28, 2012 (4th week)*
Reporting area
Hepatitis (viral, acute), by type
A
B
C
Current week
Previous 52 weeks
Cum 2013
Cum 2012
Current week
Previous 52 weeks
Cum 2013
Cum 2012
Current week
Previous 52 weeks
Cum 2013
Cum 2012
Med
Max
Med
Max
Med
Max
United States
7
27
49
36
77
20
60
86
103
252
4
32
44
26
114
New England
—
1
7
2
4
—
2
6
1
4
—
1
6
—
9
Connecticut
—
0
2
1
2
—
0
2
—
2
—
0
4
—
4
Maine
—
0
2
—
—
—
0
2
1
—
—
0
2
—
1
Massachusetts
—
1
4
—
2
—
1
4
—
2
—
0
2
—
4
New Hampshire
—
0
1
—
—
—
0
2
—
—
N
0
0
N
N
Rhode Island
—
0
1
—
—
U
0
0
U
U
U
0
0
U
U
Vermont
—
0
1
1
—
—
0
1
—
—
—
0
2
—
—
Mid. Atlantic
—
4
11
3
10
—
4
9
7
18
—
3
10
1
17
New Jersey
—
1
4
—
3
—
0
4
—
9
—
0
3
—
8
New York (Upstate)
—
1
4
1
2
—
1
3
1
1
—
1
5
1
—
New York City
—
1
4
2
3
—
1
5
5
3
—
0
2
—
2
Pennsylvania
—
1
5
—
2
—
1
4
1
5
—
1
4
—
7
E.N. Central
—
4
9
9
11
4
8
15
14
29
—
5
10
5
19
Illinois
—
1
5
—
5
—
1
5
—
7
—
0
3
—
3
Indiana
—
0
2
—
2
—
1
6
—
10
—
2
6
—
7
Michigan
—
2
6
1
3
—
1
7
—
5
—
2
6
5
8
Ohio
—
1
5
8
—
4
3
9
14
6
—
0
2
—
—
Wisconsin
—
0
2
—
1
—
0
3
—
1
—
0
2
—
1
W.N. Central
—
1
6
1
2
—
2
4
3
10
1
0
3
2
—
Iowa
—
0
2
—
—
—
0
2
1
1
—
0
0
—
—
Kansas
—
0
2
1
—
—
0
1
—
—
—
0
2
—
—
Minnesota
—
0
0
—
—
—
0
0
—
—
—
0
0
—
—
Missouri
—
0
3
—
1
—
1
3
2
8
1
0
1
2
—
Nebraska
—
0
3
—
1
—
0
1
—
1
—
0
1
—
—
North Dakota
—
0
1
—
—
—
0
0
—
—
—
0
0
—
—
South Dakota
—
0
0
—
—
—
0
1
—
—
—
0
3
—
—
S. Atlantic
5
5
15
10
10
13
14
25
39
55
2
7
15
12
24
Delaware
—
0
2
—
—
—
0
2
—
3
U
0
0
U
U
District of Columbia
—
0
0
—
—
—
0
0
—
—
—
0
0
—
—
Florida
—
1
9
1
3
7
5
11
21
12
2
2
5
4
5
Georgia
2
1
4
3
2
2
1
5
3
11
—
1
5
1
6
Maryland
—
0
3
—
1
1
1
3
3
14
—
1
3
2
3
North Carolina
2
0
4
3
2
—
1
5
1
4
—
1
6
2
3
South Carolina
—
0
2
—
—
—
1
3
3
3
—
0
1
—
—
Virginia
1
1
3
3
1
3
1
6
5
6
—
1
6
3
—
West Virginia
—
0
2
—
1
—
2
15
3
2
—
1
4
—
7
E.S. Central
1
2
5
5
1
—
10
20
25
57
—
5
12
2
22
Alabama
—
0
2
—
—
—
1
5
1
8
—
0
2
—
3
Kentucky
—
0
3
2
—
—
3
8
10
17
—
3
9
—
12
Mississippi
1
0
2
1
—
—
2
4
3
3
U
0
0
U
U
Tennessee
—
0
2
2
1
—
4
9
11
29
—
2
6
2
7
W.S. Central
1
3
8
2
10
2
5
21
5
18
1
2
10
3
2
Arkansas
—
0
2
—
1
—
1
3
—
2
—
0
1
—
—
Louisiana
—
0
1
1
1
—
0
4
2
6
—
0
3
2
—
Oklahoma
—
0
4
—
—
—
0
16
1
1
—
1
9
—
—
Texas
1
2
8
1
8
2
3
10
2
9
1
1
4
1
2
Mountain
—
3
7
3
12
1
1
4
4
10
—
1
7
1
9
Arizona
—
1
5
2
7
—
0
2
—
1
U
0
0
U
U
Colorado
—
0
3
—
3
—
0
2
—
—
—
0
4
—
2
Idaho
—
0
2
—
1
—
0
1
1
—
—
0
2
—
—
Montana
—
0
1
—
—
—
0
1
—
—
—
0
2
1
—
Nevada
—
0
1
—
1
—
0
3
2
7
—
0
2
—
2
New Mexico
—
0
2
1
—
1
0
1
1
—
—
0
3
—
3
Utah
—
0
1
—
—
—
0
2
—
2
—
0
2
—
2
Wyoming
—
0
0
—
—
—
0
0
—
—
—
0
0
—
—
Pacific
—
4
11
1
17
—
11
19
5
51
—
2
7
—
12
Alaska
—
0
1
—
—
—
0
2
—
—
—
0
0
—
—
California
—
3
10
1
14
—
2
7
4
14
—
1
5
—
7
Hawaii
—
0
2
—
—
—
7
15
—
33
—
0
0
—
—
Oregon
—
0
2
—
1
—
0
3
1
3
—
0
3
—
5
Washington
—
0
3
—
2
—
0
5
—
1
—
1
4
—
—
Territories
American Samoa
—
0
0
—
—
—
0
0
—
—
—
0
0
—
—
C.N.M.I.
—
—
—
—
—
—
—
—
—
—
—
—
—
—
—
Guam
—
—
—
—
—
—
—
—
—
—
—
—
—
—
—
Puerto Rico
—
0
0
—
—
—
0
1
—
1
N
0
0
N
N
U.S. Virgin Islands
—
0
0
—
—
—
0
0
—
—
—
0
0
—
—
C.N.M.I.: Commonwealth of Northern Mariana Islands.
U: Unavailable. —: No reported cases. N: Not reportable. NN: Not Nationally Notifiable. Cum: Cumulative year-to-date counts. Med: Median. Max: Maximum.
TABLE II. (Continued) Provisional cases of selected notifiable diseases, United States, weeks ending January 26, 2013, and January 28, 2012 (4th week)*
Reporting area
Legionellosis
Lyme disease
Malaria
Current week
Previous 52 weeks
Cum 2013
Cum 2012
Current week
Previous 52 weeks
Cum 2013
Cum 2012
Current week
Previous 52 weeks
Cum 2013
Cum 2012
Med
Max
Med
Max
Med
Max
United States
9
55
133
98
170
30
415
1,423
288
1,098
9
22
44
39
95
New England
—
5
19
4
6
—
112
605
15
353
—
1
5
1
7
Connecticut
—
1
7
1
—
—
37
181
3
111
—
0
2
—
—
Maine
—
0
3
1
—
—
16
69
5
32
—
0
1
—
—
Massachusetts
—
2
11
—
4
—
46
340
1
146
—
0
4
—
6
New Hampshire
—
0
2
—
1
—
9
53
—
43
—
0
2
1
—
Rhode Island
—
0
3
—
1
—
1
26
—
—
—
0
1
—
—
Vermont
—
0
2
2
—
—
8
29
6
21
—
0
1
—
1
Mid. Atlantic
1
15
43
9
33
21
198
656
156
526
—
5
13
5
10
New Jersey
—
2
12
—
7
—
51
166
24
204
—
0
0
—
—
New York (Upstate)
—
6
15
—
10
6
41
180
19
29
—
0
4
—
1
New York City
1
2
13
3
5
—
1
12
—
1
—
4
11
5
7
Pennsylvania
—
4
18
6
11
15
93
404
113
292
—
1
4
—
2
E.N. Central
2
11
38
17
39
1
20
167
4
65
—
2
8
4
12
Illinois
—
3
23
—
7
—
2
18
—
3
—
0
6
—
4
Indiana
—
2
5
—
4
—
1
6
—
2
—
0
2
—
3
Michigan
—
1
6
—
7
—
2
9
1
2
—
0
5
2
2
Ohio
2
4
17
17
21
1
1
6
1
4
—
1
3
1
2
Wisconsin
—
0
2
—
—
—
16
137
2
54
—
0
2
1
1
W.N. Central
1
3
10
2
10
—
2
27
—
3
—
0
5
2
3
Iowa
—
0
2
—
—
—
1
16
—
1
—
0
1
—
1
Kansas
—
0
1
—
—
—
0
3
—
—
—
0
2
—
—
Minnesota
—
1
4
—
1
—
1
9
—
2
—
0
0
—
—
Missouri
—
1
8
—
8
—
0
2
—
—
—
0
2
1
2
Nebraska
1
0
2
2
—
—
0
2
—
—
—
0
1
1
—
North Dakota
—
0
1
—
1
—
0
1
—
—
—
0
1
—
—
South Dakota
—
0
1
—
—
—
0
1
—
—
—
0
2
—
—
S. Atlantic
4
10
22
27
41
8
57
160
108
134
9
7
16
24
34
Delaware
—
0
2
—
2
2
11
30
16
34
—
0
1
—
—
District of Columbia
N
0
0
N
N
N
0
0
N
N
—
0
1
—
2
Florida
4
4
11
16
21
2
2
6
6
11
3
1
3
7
12
Georgia
—
1
3
2
4
—
0
4
—
—
—
1
5
2
—
Maryland
—
2
6
4
3
3
22
91
79
53
4
2
8
12
10
North Carolina
—
1
8
3
4
—
0
24
—
—
—
0
7
—
1
South Carolina
—
0
3
1
2
—
1
3
—
3
—
0
2
—
2
Virginia
—
1
4
1
5
1
15
48
6
25
2
1
4
3
7
West Virginia
—
0
2
—
—
—
1
10
1
8
—
0
0
—
—
E.S. Central
—
2
7
4
6
—
1
5
3
1
—
0
4
1
1
Alabama
—
0
2
—
1
—
0
2
1
—
—
0
2
—
1
Kentucky
—
0
4
—
2
—
0
4
1
1
—
0
1
—
—
Mississippi
—
0
2
—
1
—
0
1
—
—
—
0
1
—
—
Tennessee
—
1
3
4
2
—
0
4
1
—
—
0
2
1
—
W.S. Central
1
3
15
4
3
—
1
6
—
1
—
1
6
1
6
Arkansas
—
0
3
—
—
—
0
0
—
—
—
0
1
—
—
Louisiana
—
0
3
2
1
—
0
1
—
1
—
0
2
1
—
Oklahoma
—
0
9
—
—
—
0
0
—
—
—
0
4
—
3
Texas
1
2
12
2
2
—
1
6
—
—
—
0
5
—
3
Mountain
—
2
6
2
10
—
0
5
—
3
—
1
5
1
5
Arizona
—
0
3
—
3
—
0
2
—
1
—
0
2
—
—
Colorado
—
0
3
—
3
—
0
0
—
—
—
0
3
—
2
Idaho
—
0
2
1
1
—
0
1
—
1
—
0
1
—
1
Montana
—
0
1
1
—
—
0
1
—
—
—
0
0
—
—
Nevada
—
0
2
—
1
—
0
2
—
—
—
0
2
1
1
New Mexico
—
0
2
—
—
—
0
1
—
—
—
0
1
—
—
Utah
—
0
4
—
1
—
0
1
—
1
—
0
2
—
1
Wyoming
—
0
1
—
1
—
0
1
—
—
—
0
0
—
—
Pacific
—
5
22
29
22
—
2
8
2
12
—
3
7
—
17
Alaska
—
0
0
—
—
—
0
2
—
—
—
0
1
—
1
California
—
4
21
28
18
—
1
4
1
11
—
2
6
—
14
Hawaii
—
0
1
—
—
N
0
0
N
N
—
0
1
—
1
Oregon
—
0
2
1
4
—
1
6
1
1
—
0
2
—
1
Washington
—
0
5
—
—
—
0
4
—
—
—
0
3
—
—
Territories
American Samoa
N
0
0
N
N
N
0
0
N
N
—
0
0
—
—
C.N.M.I.
—
—
—
—
—
—
—
—
—
—
—
—
—
—
—
Guam
—
—
—
—
—
—
—
—
—
—
—
—
—
—
—
Puerto Rico
—
0
0
—
—
N
0
0
N
N
—
0
0
—
—
U.S. Virgin Islands
—
0
0
—
—
N
0
0
N
N
—
0
0
—
—
C.N.M.I.: Commonwealth of Northern Mariana Islands.
U: Unavailable. —: No reported cases. N: Not reportable. NN: Not Nationally Notifiable. Cum: Cumulative year-to-date counts. Med: Median. Max: Maximum.
TABLE II. (Continued) Provisional cases of selected notifiable diseases, United States, weeks ending January 26, 2013, and January 28, 2012 (4th week)*
Reporting area
Meningococcal disease, invasive† All serogroups
Mumps
Pertussis
Current week
Previous 52 weeks
Cum 2013
Cum 2012
Current week
Previous 52 weeks
Cum 2013
Cum 2012
Current week
Previous 52 weeks
Cum 2013
Cum 2012
Med
Max
Med
Max
Med
Max
United States
7
10
19
37
49
—
4
8
4
20
141
795
1,297
740
1,950
New England
—
0
3
—
—
—
0
1
—
—
7
45
100
73
97
Connecticut
—
0
1
—
—
—
0
0
—
—
—
4
9
1
3
Maine
—
0
1
—
—
—
0
0
—
—
6
14
37
37
16
Massachusetts
—
0
2
—
—
—
0
1
—
—
—
12
28
—
27
New Hampshire
—
0
0
—
—
—
0
1
—
—
—
2
19
2
7
Rhode Island
—
0
0
—
—
—
0
1
—
—
—
1
20
2
2
Vermont
—
0
1
—
—
—
0
0
—
—
1
9
42
31
42
Mid. Atlantic
—
1
4
2
8
—
0
3
1
—
29
105
183
120
355
New Jersey
—
0
2
—
1
—
0
0
—
—
—
15
40
—
66
New York (Upstate)
—
0
2
1
1
—
0
1
—
—
24
46
109
68
100
New York City
—
0
2
1
3
—
0
3
—
—
—
7
19
1
75
Pennsylvania
—
0
2
—
3
—
0
1
1
—
5
33
64
51
114
E.N. Central
—
1
4
1
6
—
1
3
1
8
22
174
356
124
704
Illinois
—
0
3
—
1
—
1
2
1
4
—
36
64
8
182
Indiana
—
0
1
1
—
—
0
2
—
1
—
8
18
1
17
Michigan
—
0
2
—
—
—
0
1
—
2
3
11
40
25
52
Ohio
—
0
2
—
4
—
0
1
—
1
19
17
37
62
62
Wisconsin
—
0
2
—
1
—
0
1
—
—
—
93
262
28
391
W.N. Central
1
1
4
3
2
—
0
2
—
1
7
120
252
53
222
Iowa
—
0
1
—
—
—
0
1
—
—
—
32
100
8
25
Kansas
—
0
1
—
—
—
0
1
—
—
—
15
30
3
32
Minnesota
—
0
3
—
—
—
0
1
—
—
—
49
141
—
93
Missouri
1
0
3
3
2
—
0
1
—
1
6
14
45
29
67
Nebraska
—
0
1
—
—
—
0
1
—
—
1
2
19
12
2
North Dakota
—
0
1
—
—
—
0
0
—
—
—
0
45
—
—
South Dakota
—
0
0
—
—
—
0
0
—
—
—
1
6
1
3
S. Atlantic
5
1
5
13
5
—
0
3
1
2
13
55
105
65
97
Delaware
—
0
1
—
—
—
0
0
—
—
1
1
4
2
4
District of Columbia
—
0
1
—
—
—
0
2
—
—
—
0
4
—
1
Florida
3
1
3
7
3
—
0
1
—
1
9
10
26
20
26
Georgia
—
0
2
—
—
—
0
2
—
—
—
4
15
8
4
Maryland
—
0
1
—
2
—
0
1
1
—
3
6
18
13
23
North Carolina
1
0
2
4
—
—
0
1
—
—
—
7
75
6
5
South Carolina
—
0
1
—
—
—
0
1
—
—
—
4
14
13
4
Virginia
—
0
2
1
—
—
0
1
—
1
—
11
25
2
22
West Virginia
1
0
2
1
—
—
0
1
—
—
—
1
12
1
8
E.S. Central
—
0
2
3
—
—
0
2
1
—
10
24
48
56
58
Alabama
—
0
1
—
—
—
0
1
1
—
2
4
11
10
4
Kentucky
—
0
1
1
—
—
0
1
—
—
3
11
35
26
31
Mississippi
—
0
1
2
—
—
0
1
—
—
—
1
4
—
6
Tennessee
—
0
1
—
—
—
0
1
—
—
5
5
14
20
17
W.S. Central
—
1
4
—
—
—
0
2
—
1
11
47
175
18
26
Arkansas
—
0
1
—
—
—
0
1
—
—
—
2
22
1
2
Louisiana
—
0
0
—
—
—
0
1
—
—
—
1
7
—
2
Oklahoma
—
0
2
—
—
—
0
1
—
—
1
0
34
1
—
Texas
—
0
4
—
—
—
0
2
—
1
10
40
158
16
22
Mountain
—
1
3
2
3
—
0
2
—
2
25
117
167
158
249
Arizona
—
0
2
—
1
—
0
2
—
—
15
15
33
50
72
Colorado
—
0
2
1
1
—
0
2
—
1
4
29
66
47
52
Idaho
—
0
1
—
—
—
0
0
—
—
1
4
14
10
10
Montana
—
0
1
—
1
—
0
1
—
1
4
8
48
28
8
Nevada
—
0
1
—
—
—
0
0
—
—
1
1
6
6
4
New Mexico
—
0
1
—
—
—
0
0
—
—
—
15
31
14
22
Utah
—
0
1
—
—
—
0
1
—
—
—
30
52
3
78
Wyoming
—
0
1
1
—
—
0
1
—
—
—
1
5
—
3
Pacific
1
2
9
13
25
—
0
2
—
6
17
126
301
73
142
Alaska
—
0
1
—
—
—
0
1
—
—
8
5
24
47
7
California
1
1
5
12
18
—
0
2
—
5
2
13
27
9
59
Hawaii
—
0
1
—
—
—
0
1
—
—
—
1
10
1
27
Oregon
—
0
4
1
7
—
0
1
—
1
4
13
54
13
31
Washington
—
0
3
—
—
—
0
1
—
—
3
83
254
3
18
Territories
American Samoa
—
0
0
—
—
—
0
0
—
—
—
0
0
—
—
C.N.M.I.
—
—
—
—
—
—
—
—
—
—
—
—
—
—
—
Guam
—
—
—
—
—
—
—
—
—
—
—
—
—
—
—
Puerto Rico
—
0
0
—
—
—
0
1
—
1
—
0
0
—
—
U.S. Virgin Islands
—
0
0
—
—
—
0
0
—
—
—
0
0
—
—
C.N.M.I.: Commonwealth of Northern Mariana Islands.
U: Unavailable. —: No reported cases. N: Not reportable. NN: Not Nationally Notifiable. Cum: Cumulative year-to-date counts. Med: Median. Max: Maximum.
† Data for meningococcal disease, invasive caused by serogroups A, C, Y, and W-135; serogroup B; other serogroup; and unknown serogroup are available in Table I.
TABLE II. (Continued) Provisional cases of selected notifiable diseases, United States, weeks ending January 26, 2013, and January 28, 2012 (4th week)*
Reporting area
Rabies, animal
Salmonellosis
Shiga toxin-producing E. coli (STEC)†
Current week
Previous 52 weeks
Cum 2013
Cum 2012
Current week
Previous 52 weeks
Cum 2013
Cum 2012
Current week
Previous 52 weeks
Cum 2013
Cum 2012
Med
Max
Med
Max
Med
Max
United States
17
71
127
78
247
208
986
1,677
1,128
2,021
15
114
202
99
238
New England
3
7
16
14
28
—
37
73
25
80
—
4
12
3
6
Connecticut
—
3
8
5
13
—
8
18
20
18
—
1
5
2
3
Maine
—
1
4
2
9
—
2
11
2
6
—
0
6
—
—
Massachusetts
—
0
0
—
—
—
21
54
2
42
—
2
7
—
3
New Hampshire
1
0
3
2
3
—
1
8
—
7
—
0
4
1
—
Rhode Island
1
0
5
1
2
—
2
7
—
—
—
0
1
—
—
Vermont
1
1
7
4
1
—
1
7
1
7
—
0
2
—
—
Mid. Atlantic
4
14
31
21
30
10
89
192
76
220
—
11
23
7
32
New Jersey
—
0
0
—
—
—
17
48
—
65
—
2
6
—
8
New York (Upstate)
4
7
20
21
11
—
23
64
—
27
—
4
13
—
4
New York City
—
0
0
—
—
4
20
49
38
52
—
1
7
3
7
Pennsylvania
—
6
15
—
19
6
26
81
38
76
—
3
11
4
13
E.N. Central
—
2
13
2
2
8
95
212
76
220
4
16
66
12
51
Illinois
—
1
6
1
—
—
33
79
6
74
—
3
16
—
7
Indiana
—
0
2
—
—
—
13
40
3
15
—
2
23
1
3
Michigan
—
0
5
1
1
2
15
46
19
43
—
3
41
2
22
Ohio
—
0
7
—
1
6
24
53
46
50
4
3
20
9
4
Wisconsin
N
0
0
N
N
—
7
24
2
38
—
1
14
—
15
W.N. Central
1
3
18
7
12
9
46
115
87
89
2
15
31
25
25
Iowa
—
0
5
—
—
—
9
32
18
13
—
3
15
2
5
Kansas
—
1
4
4
4
2
9
19
8
27
1
2
7
3
4
Minnesota
—
0
0
—
—
—
0
0
—
—
—
0
0
—
—
Missouri
1
0
3
3
2
5
19
48
50
34
1
6
21
17
11
Nebraska
—
0
0
—
—
2
4
26
7
5
—
1
6
2
2
North Dakota
—
0
13
—
—
—
1
5
—
4
—
0
3
—
—
South Dakota
—
1
7
—
6
—
3
9
4
6
—
1
4
1
3
S. Atlantic
3
19
34
22
130
124
268
608
498
645
6
12
71
23
38
Delaware
—
0
0
—
—
—
2
10
4
6
—
0
2
—
1
District of Columbia
—
0
0
—
—
—
0
3
—
5
—
0
1
—
—
Florida
2
0
21
8
85
71
110
274
249
267
5
4
10
11
14
Georgia
—
0
0
—
—
14
46
125
55
111
—
2
9
6
4
Maryland
—
7
17
11
10
9
17
42
57
62
—
1
5
3
2
North Carolina
—
0
0
—
—
21
27
166
53
76
1
1
61
3
3
South Carolina
—
0
0
—
—
6
23
70
37
59
—
0
7
—
1
Virginia
—
11
23
—
29
3
22
47
43
51
—
1
6
—
13
West Virginia
1
1
6
3
6
—
3
11
—
8
—
0
2
—
—
E.S. Central
—
1
5
—
7
4
62
213
65
144
—
5
14
9
17
Alabama
—
1
5
—
6
—
19
59
20
37
—
1
5
2
4
Kentucky
—
0
3
—
1
—
7
47
—
24
—
1
9
—
3
Mississippi
—
0
1
—
—
1
16
67
20
49
—
0
2
—
5
Tennessee
—
0
0
—
—
3
18
69
25
34
—
2
12
7
5
W.S. Central
6
11
58
12
25
28
139
406
86
232
—
10
37
1
14
Arkansas
—
0
35
—
—
7
16
229
16
16
—
1
6
1
3
Louisiana
—
0
0
—
—
—
24
59
15
60
—
0
3
—
—
Oklahoma
—
0
23
—
4
8
13
34
16
9
—
2
8
—
1
Texas
6
10
29
12
21
13
81
185
39
147
—
7
33
—
10
Mountain
—
1
16
—
10
5
42
78
53
127
—
11
41
6
26
Arizona
N
0
0
N
N
1
12
24
10
43
—
2
7
2
9
Colorado
—
0
0
—
—
1
10
19
13
34
—
3
9
—
7
Idaho
—
0
15
—
—
1
2
7
6
4
—
1
14
1
2
Montana
N
0
0
N
N
—
2
8
2
6
—
0
5
—
—
Nevada
—
0
4
—
—
2
3
12
15
4
—
0
5
3
—
New Mexico
—
0
5
—
10
—
5
16
3
15
—
1
5
—
3
Utah
—
0
2
—
—
—
4
15
3
18
—
1
15
—
5
Wyoming
—
0
0
—
—
—
1
8
1
3
—
0
3
—
—
Pacific
—
3
12
—
3
20
113
214
162
264
3
15
40
13
29
Alaska
—
0
1
—
1
—
1
4
—
7
N
0
0
N
N
California
—
3
11
—
2
13
80
164
141
226
2
8
21
10
22
Hawaii
—
0
0
—
—
—
4
58
5
11
—
0
2
—
—
Oregon
—
0
2
—
—
1
8
16
8
17
1
3
11
2
5
Washington
—
0
0
—
—
6
14
56
8
3
—
3
24
1
2
Territories
American Samoa
—
0
0
—
—
—
1
2
—
—
—
0
0
—
—
C.N.M.I.
—
—
—
—
—
—
—
—
—
—
—
—
—
—
—
Guam
—
—
—
—
—
—
—
—
—
—
—
—
—
—
—
Puerto Rico
—
0
5
—
10
—
0
4
—
6
—
0
2
—
—
U.S. Virgin Islands
—
0
0
—
—
—
0
0
—
—
—
0
0
—
—
C.N.M.I.: Commonwealth of Northern Mariana Islands.
U: Unavailable. —: No reported cases. N: Not reportable. NN: Not Nationally Notifiable. Cum: Cumulative year-to-date counts. Med: Median. Max: Maximum.
† Includes E. coli O157:H7; Shiga toxin-positive, serogroup non-O157; and Shiga toxin-positive, not serogrouped.
TABLE II. (Continued) Provisional cases of selected notifiable diseases, United States, weeks ending January 26, 2013, and January 28, 2012 (4th week)*
Reporting area
Shigellosis
Spotted Fever Rickettsiosis (including RMSF)†
Confirmed
Probable
Current week
Previous 52 weeks
Cum 2013
Cum 2012
Current week
Previous 52 weeks
Cum 2013
Cum 2012
Current week
Previous 52 weeks
Cum 2013
Cum 2012
Med
Max
Med
Max
Med
Max
United States
58
261
398
346
889
—
4
12
3
7
—
51
228
13
47
New England
—
4
12
5
9
—
0
1
—
—
—
0
3
—
—
Connecticut
—
1
3
2
3
—
0
0
—
—
—
0
0
—
—
Maine
—
0
4
—
—
—
0
0
—
—
—
0
1
—
—
Massachusetts
—
2
9
2
6
—
0
0
—
—
—
0
3
—
—
New Hampshire
—
0
1
—
—
—
0
0
—
—
—
0
1
—
—
Rhode Island
—
0
5
—
—
—
0
0
—
—
—
0
2
—
—
Vermont
—
0
1
1
—
—
0
1
—
—
—
0
0
—
—
Mid. Atlantic
2
42
87
22
231
—
0
2
1
1
—
1
5
1
7
New Jersey
—
12
47
—
155
—
0
0
—
—
—
0
1
—
—
New York (Upstate)
—
13
37
—
13
—
0
1
—
—
—
0
3
—
—
New York City
1
9
21
17
52
—
0
0
—
—
—
0
3
—
2
Pennsylvania
1
2
6
5
11
—
0
2
1
1
—
0
4
1
5
E.N. Central
9
35
118
114
138
—
0
2
—
1
—
4
15
3
4
Illinois
—
5
16
1
14
—
0
1
—
—
—
2
12
—
3
Indiana
—
1
17
1
7
—
0
1
—
1
—
1
5
2
—
Michigan
—
4
14
10
27
—
0
0
—
—
—
0
1
—
—
Ohio
9
25
103
99
85
—
0
0
—
—
—
0
3
1
1
Wisconsin
—
2
17
3
5
—
0
0
—
—
—
0
1
—
—
W.N. Central
4
8
32
19
29
—
0
6
—
—
—
5
33
—
4
Iowa
—
1
11
5
1
—
0
0
—
—
—
0
1
—
—
Kansas
—
2
9
2
14
—
0
0
—
—
—
0
0
—
—
Minnesota
—
0
0
—
—
—
0
0
—
—
—
0
0
—
—
Missouri
3
1
7
3
12
—
0
5
—
—
—
5
33
—
4
Nebraska
1
1
22
8
2
—
0
1
—
—
—
0
1
—
—
North Dakota
—
0
1
1
—
—
0
1
—
—
—
0
0
—
—
South Dakota
—
0
3
—
—
—
0
0
—
—
—
0
1
—
—
S. Atlantic
18
54
101
63
157
—
2
9
2
2
—
13
146
5
15
Delaware
—
0
4
1
—
—
0
0
—
—
—
0
2
—
1
District of Columbia
—
0
3
—
2
—
0
0
—
—
—
0
1
—
—
Florida
7
31
66
26
90
—
0
1
—
—
—
0
3
—
1
Georgia
4
13
21
24
47
—
1
5
2
1
—
0
0
—
—
Maryland
2
4
16
3
8
—
0
1
—
—
—
0
3
—
1
North Carolina
3
2
10
6
4
—
0
4
—
—
—
0
133
—
3
South Carolina
—
1
2
—
2
—
0
1
—
1
—
1
6
2
—
Virginia
2
1
6
3
4
—
0
2
—
—
—
4
35
3
9
West Virginia
—
0
1
—
—
—
0
0
—
—
—
0
1
—
—
E.S. Central
1
21
42
14
123
—
0
3
—
—
—
12
57
4
4
Alabama
1
5
20
7
41
—
0
1
—
—
—
3
13
—
1
Kentucky
—
5
21
—
48
—
0
1
—
—
—
0
7
—
—
Mississippi
—
5
13
6
21
—
0
2
—
—
—
0
4
—
—
Tennessee
—
4
9
1
13
—
0
1
—
—
—
10
49
4
3
W.S. Central
14
46
81
49
117
—
0
1
—
—
—
11
72
—
4
Arkansas
1
2
7
6
3
—
0
1
—
—
—
8
65
—
3
Louisiana
—
4
10
2
20
—
0
0
—
—
—
0
2
—
1
Oklahoma
6
7
27
18
19
—
0
1
—
—
—
0
26
—
—
Texas
7
31
70
23
75
—
0
1
—
—
—
0
4
—
—
Mountain
4
11
32
12
27
—
0
1
—
3
—
0
5
—
7
Arizona
4
5
15
4
16
—
0
1
—
3
—
0
3
—
5
Colorado
—
2
19
2
2
—
0
1
—
—
—
0
1
—
—
Idaho
—
0
2
—
1
—
0
0
—
—
—
0
2
—
—
Montana
—
0
2
—
3
—
0
0
—
—
—
0
1
—
—
Nevada
—
0
9
6
1
—
0
0
—
—
—
0
0
—
—
New Mexico
—
1
7
—
3
—
0
0
—
—
—
0
1
—
—
Utah
—
0
4
—
1
—
0
0
—
—
—
0
1
—
2
Wyoming
—
0
3
—
—
—
0
0
—
—
—
0
1
—
—
Pacific
6
21
57
48
58
—
0
2
—
—
—
0
1
—
2
Alaska
—
0
2
—
2
N
0
0
N
N
N
0
0
N
N
California
3
15
57
42
50
—
0
2
—
—
—
0
1
—
2
Hawaii
—
0
3
—
1
N
0
0
N
N
N
0
0
N
N
Oregon
—
1
10
1
5
—
0
0
—
—
—
0
1
—
—
Washington
3
2
19
5
—
—
0
0
—
—
—
0
0
—
—
Territories
American Samoa
—
0
3
—
—
N
0
0
N
N
N
0
0
N
N
C.N.M.I.
—
—
—
—
—
—
—
—
—
—
—
—
—
—
—
Guam
—
—
—
—
—
N
—
—
N
N
N
—
—
N
N
Puerto Rico
—
0
0
—
—
N
0
0
N
N
N
0
0
N
N
U.S. Virgin Islands
—
0
0
—
—
N
0
0
N
N
N
0
0
N
N
C.N.M.I.: Commonwealth of Northern Mariana Islands.
U: Unavailable. —: No reported cases. N: Not reportable. NN: Not Nationally Notifiable. Cum: Cumulative year-to-date counts. Med: Median. Max: Maximum.
† Illnesses with similar clinical presentation that result from Spotted fever group rickettsia infections are reported as Spotted fever rickettsioses. Rocky Mountain spotted fever (RMSF) caused by Rickettsia rickettsii, is the most common and well-known spotted fever.
TABLE II. (Continued) Provisional cases of selected notifiable diseases, United States, weeks ending January 26, 2013, and January 28, 2012 (4th week)*
Reporting area
Streptococcus pneumoniae,† invasive disease
Syphilis, primary and secondary
All ages
Age <5
Current week
Previous 52 weeks
Cum 2013
Cum 2012
Current week
Previous 52 weeks
Cum 2013
Cum 2012
Current week
Previous 52 weeks
Cum 2013
Cum 2012
Med
Max
Med
Max
Med
Max
United States
204
255
486
1,242
1,482
6
20
35
41
103
85
288
366
537
1,039
New England
3
11
23
32
61
—
1
4
—
3
6
7
18
18
33
Connecticut
—
5
13
6
27
—
0
2
—
—
—
0
4
—
11
Maine
3
2
8
14
12
—
0
1
—
—
—
0
5
—
—
Massachusetts
—
1
3
—
3
—
0
2
—
2
5
5
13
15
18
New Hampshire
—
1
5
1
9
—
0
1
—
1
1
1
4
2
3
Rhode Island
—
0
5
—
2
—
0
1
—
—
—
0
6
1
1
Vermont
—
1
6
11
8
—
0
0
—
—
—
0
1
—
—
Mid. Atlantic
8
35
70
94
210
—
2
5
2
13
7
40
60
74
159
New Jersey
—
6
24
1
66
—
0
3
—
6
—
4
8
1
15
New York (Upstate)
—
15
35
—
75
—
1
3
—
3
3
4
15
10
9
New York City
8
14
34
93
69
—
0
3
2
4
1
18
29
29
72
Pennsylvania
N
0
0
N
N
N
0
0
N
N
3
15
27
34
63
E.N. Central
40
55
114
333
324
1
3
10
7
21
2
30
49
18
105
Illinois
N
0
0
N
N
—
0
0
—
5
—
10
26
—
40
Indiana
—
13
30
22
66
—
1
2
—
2
1
4
10
7
14
Michigan
3
11
27
62
68
—
0
3
2
3
—
4
13
—
24
Ohio
26
21
63
183
136
1
1
6
4
7
—
8
15
5
22
Wisconsin
11
9
29
66
54
—
0
2
1
4
1
2
5
6
5
W.N. Central
5
13
24
28
78
1
1
4
3
7
—
7
14
8
29
Iowa
N
0
0
N
N
N
0
0
N
N
—
1
4
2
3
Kansas
N
0
0
N
N
N
0
0
N
N
—
0
4
—
1
Minnesota
—
9
22
—
50
—
0
3
—
3
—
2
5
—
7
Missouri
N
0
0
N
N
—
0
0
—
—
—
2
7
5
18
Nebraska
4
2
8
13
19
1
0
2
3
1
—
0
2
1
—
North Dakota
—
0
4
—
1
—
0
1
—
—
—
0
1
—
—
South Dakota
1
2
6
15
8
—
0
2
—
3
—
0
2
—
—
S. Atlantic
59
56
110
366
327
2
4
11
20
21
27
65
103
120
223
Delaware
—
0
3
1
6
—
0
1
—
—
—
0
6
2
4
District of Columbia
—
0
4
—
3
—
0
1
—
1
—
3
10
11
19
Florida
28
18
59
161
115
—
1
6
8
8
4
25
36
39
100
Georgia
8
15
42
77
85
1
2
4
5
2
9
12
31
27
29
Maryland
11
6
23
51
35
1
0
5
2
2
9
7
15
22
16
North Carolina
N
0
0
N
N
N
0
0
N
N
—
5
21
—
23
South Carolina
9
6
17
57
56
—
0
3
1
2
5
4
9
13
21
Virginia
N
0
0
N
N
—
0
2
2
3
—
3
40
6
11
West Virginia
3
5
33
19
27
—
0
2
2
3
—
0
2
—
—
E.S. Central
26
22
56
141
150
2
2
5
7
10
3
15
25
9
44
Alabama
3
2
8
19
7
—
0
3
2
—
—
4
10
—
16
Kentucky
3
4
11
29
23
—
0
1
—
—
3
2
9
4
4
Mississippi
4
3
12
20
15
1
0
2
1
1
—
3
12
5
7
Tennessee
16
12
37
73
105
1
0
3
4
9
—
5
14
—
17
W.S. Central
32
26
224
108
130
—
2
13
1
11
14
43
66
119
159
Arkansas
6
3
21
17
16
—
0
3
—
2
1
3
13
11
31
Louisiana
—
4
12
14
29
—
0
4
1
2
1
6
19
9
19
Oklahoma
N
0
0
N
N
—
0
0
—
—
1
1
5
3
5
Texas
26
20
203
77
85
—
2
13
—
7
11
33
47
96
104
Mountain
31
28
53
131
189
—
2
7
—
12
3
12
25
19
41
Arizona
17
9
22
42
91
—
1
3
—
6
—
4
8
2
17
Colorado
6
8
22
40
32
—
0
3
—
1
—
4
12
8
11
Idaho
N
0
0
N
N
—
0
0
—
—
—
0
4
—
1
Montana
—
0
4
2
9
—
0
1
—
—
—
0
1
—
—
Nevada
4
1
8
15
13
—
0
2
—
2
3
2
8
8
7
New Mexico
3
5
15
30
26
—
0
4
—
2
—
1
5
—
3
Utah
—
3
7
—
18
—
0
3
—
1
—
0
2
1
2
Wyoming
1
0
3
2
—
—
0
1
—
—
—
0
1
—
—
Pacific
—
4
10
9
13
—
0
2
1
5
23
67
99
152
246
Alaska
—
3
8
9
8
—
0
2
1
5
2
0
2
2
1
California
N
0
0
N
N
N
0
0
N
N
19
56
82
130
208
Hawaii
—
1
6
—
5
—
0
1
—
—
—
0
2
—
1
Oregon
N
0
0
N
N
N
0
0
N
N
2
3
11
12
10
Washington
N
0
0
N
N
N
0
0
N
N
—
4
10
8
26
Territories
American Samoa
N
0
0
N
N
—
0
0
—
—
—
0
0
—
—
C.N.M.I.
—
—
—
—
—
—
—
—
—
—
—
—
—
—
—
Guam
—
—
—
—
—
—
—
—
—
—
—
—
—
—
—
Puerto Rico
—
0
0
—
—
—
0
0
—
—
2
6
17
18
14
U.S. Virgin Islands
—
0
0
—
—
—
0
0
—
—
—
0
0
—
—
C.N.M.I.: Commonwealth of Northern Mariana Islands.
U: Unavailable. —: No reported cases. N: Not reportable. NN: Not Nationally Notifiable. Cum: Cumulative year-to-date counts. Med: Median. Max: Maximum.
† Includes drug resistant and susceptible cases of invasive Streptococcus pneumoniae disease among children <5 years and among all ages. Case definition: Isolation of S. pneumoniae from a normally sterile body site (e.g., blood or cerebrospinal fluid).
TABLE II. (Continued) Provisional cases of selected notifiable diseases, United States, weeks ending January 26, 2013, and January 28, 2012 (4th week)*
Reporting area
Varicella (chickenpox)
West Nile virus disease†
Neuroinvasive
Nonneuroinvasive§
Current week
Previous 52 weeks
Cum 2013
Cum 2012
Current week
Previous 52 weeks
Cum 2013
Cum 2012
Current week
Previous 52 weeks
Cum 2013
Cum 2012
Med
Max
Med
Max
Med
Max
United States
32
214
370
224
1,016
—
4
321
—
—
—
2
338
—
—
New England
3
20
49
25
107
—
0
8
—
—
—
0
5
—
—
Connecticut
3
5
10
21
25
—
0
2
—
—
—
0
3
—
—
Maine
—
3
22
2
22
—
0
1
—
—
—
0
0
—
—
Massachusetts
—
10
21
—
48
—
0
7
—
—
—
0
3
—
—
New Hampshire
—
0
0
—
—
—
0
1
—
—
—
0
0
—
—
Rhode Island
—
0
9
—
1
—
0
1
—
—
—
0
1
—
—
Vermont
—
2
13
2
11
—
0
1
—
—
—
0
1
—
—
Mid. Atlantic
7
20
56
44
97
—
0
16
—
—
—
0
17
—
—
New Jersey
—
6
25
—
36
—
0
5
—
—
—
0
4
—
—
New York (Upstate)
N
0
0
N
N
—
0
6
—
—
—
0
8
—
—
New York City
—
0
0
—
—
—
0
5
—
—
—
0
2
—
—
Pennsylvania
7
15
35
44
61
—
0
4
—
—
—
0
3
—
—
E.N. Central
19
61
126
116
279
—
0
90
—
—
—
0
42
—
—
Illinois
—
16
36
24
90
—
0
31
—
—
—
0
18
—
—
Indiana
—
8
26
5
22
—
0
8
—
—
—
0
6
—
—
Michigan
4
17
45
28
80
—
0
32
—
—
—
0
13
—
—
Ohio
15
16
33
51
87
—
0
19
—
—
—
0
12
—
—
Wisconsin
—
0
7
8
—
—
0
11
—
—
—
0
5
—
—
W.N. Central
—
6
26
—
77
—
0
36
—
—
—
0
57
—
—
Iowa
N
0
0
N
N
—
0
3
—
—
—
0
5
—
—
Kansas
—
0
14
—
38
—
0
3
—
—
—
0
6
—
—
Minnesota
—
0
0
—
—
—
0
6
—
—
—
0
7
—
—
Missouri
—
5
24
—
35
—
0
3
—
—
—
0
1
—
—
Nebraska
—
0
3
—
1
—
0
8
—
—
—
0
23
—
—
North Dakota
—
0
5
—
1
—
0
9
—
—
—
0
11
—
—
South Dakota
—
0
3
—
2
—
0
17
—
—
—
0
27
—
—
S. Atlantic
—
23
76
7
138
—
0
20
—
—
—
0
19
—
—
Delaware
—
0
1
—
1
—
0
1
—
—
—
0
2
—
—
District of Columbia
—
0
4
—
1
—
0
3
—
—
—
0
1
—
—
Florida
—
12
50
—
81
—
0
5
—
—
—
0
5
—
—
Georgia
—
1
9
4
—
—
0
6
—
—
—
0
10
—
—
Maryland
N
0
0
N
N
—
0
5
—
—
—
0
5
—
—
North Carolina
N
0
0
N
N
—
0
4
—
—
—
0
0
—
—
South Carolina
—
0
2
—
—
—
0
5
—
—
—
0
2
—
—
Virginia
—
7
17
1
26
—
0
4
—
—
—
0
3
—
—
West Virginia
—
3
12
2
29
—
0
1
—
—
—
0
2
—
—
E.S. Central
—
3
13
3
18
—
0
20
—
—
—
0
21
—
—
Alabama
—
3
12
3
15
—
0
7
—
—
—
0
3
—
—
Kentucky
N
0
0
N
N
—
0
4
—
—
—
0
2
—
—
Mississippi
—
0
1
—
3
—
0
12
—
—
—
0
17
—
—
Tennessee
N
0
0
N
N
—
0
4
—
—
—
0
2
—
—
W.S. Central
2
43
98
17
153
—
1
144
—
—
—
1
163
—
—
Arkansas
—
3
17
—
12
—
0
9
—
—
—
0
3
—
—
Louisiana
—
1
7
3
15
—
0
18
—
—
—
0
26
—
—
Oklahoma
N
0
0
N
N
—
0
24
—
—
—
0
22
—
—
Texas
2
40
94
14
126
—
1
104
—
—
—
1
128
—
—
Mountain
—
28
61
8
139
—
0
37
—
—
—
0
22
—
—
Arizona
—
8
20
—
56
—
0
10
—
—
—
0
6
—
—
Colorado
—
8
25
—
34
—
0
17
—
—
—
0
13
—
—
Idaho
N
0
0
N
N
—
0
1
—
—
—
0
3
—
—
Montana
—
2
8
3
11
—
0
1
—
—
—
0
2
—
—
Nevada
N
0
0
N
N
—
0
1
—
—
—
0
2
—
—
New Mexico
—
1
8
—
12
—
0
9
—
—
—
0
5
—
—
Utah
—
5
15
5
24
—
0
1
—
—
—
0
1
—
—
Wyoming
—
0
2
—
2
—
0
1
—
—
—
0
2
—
—
Pacific
1
2
8
4
8
—
0
31
—
—
—
0
26
—
—
Alaska
1
1
4
4
1
—
0
0
—
—
—
0
0
—
—
California
—
0
3
—
4
—
0
31
—
—
—
0
25
—
—
Hawaii
—
1
3
—
3
—
0
0
—
—
—
0
0
—
—
Oregon
N
0
0
N
N
—
0
0
—
—
—
0
2
—
—
Washington
N
0
0
N
N
—
0
4
—
—
—
0
0
—
—
Territories
American Samoa
N
0
0
N
N
—
0
0
—
—
—
0
0
—
—
C.N.M.I.
—
—
—
—
—
—
—
—
—
—
—
—
—
—
—
Guam
—
—
—
—
—
—
—
—
—
—
—
—
—
—
—
Puerto Rico
—
0
6
—
17
—
0
0
—
—
—
0
0
—
—
U.S. Virgin Islands
—
0
0
—
—
—
0
0
—
—
—
0
0
—
—
C.N.M.I.: Commonwealth of Northern Mariana Islands.
U: Unavailable. —: No reported cases. N: Not reportable. NN: Not Nationally Notifiable. Cum: Cumulative year-to-date counts. Med: Median. Max: Maximum.
† Updated weekly from reports to the Division of Vector-Borne Infectious Diseases, National Center for Zoonotic, Vector-Borne, and Enteric Diseases (ArboNET Surveillance). Data for California serogroup, eastern equine, Powassan, St. Louis, and western equine diseases are available in Table I.
§ Not reportable in all states. Data from states where the condition is not reportable are excluded from this table, except starting in 2007 for the domestic arboviral diseases and influenza-associated pediatric mortality, and in 2003 for SARS-CoV. Reporting exceptions are available at http://wwwn.cdc.gov/nndss/document/SRCA_FINAL_REPORT_2006-2010.xlsx.
TABLE III. Deaths in 122 U.S. cities,* week ending January 26, 2013 (4th week)
Reporting area
All causes, by age (years)
P&I† Total
Reporting area (Continued)
All causes, by age (years)
P&I† Total
All Ages
=65
45–64
25–44
1–24
<1
All Ages
=65
45–64
25–44
1–24
<1
New England
625
453
122
27
11
12
89
S. Atlantic
973
640
255
45
19
14
101
Boston, MA
166
111
34
10
5
6
31
Atlanta, GA
158
77
63
9
6
3
18
Bridgeport, CT
33
27
4
1
1
—
3
Baltimore, MD
121
74
37
5
3
2
18
Cambridge, MA
23
17
5
1
—
—
4
Charlotte, NC
168
119
36
8
3
2
19
Fall River, MA
20
17
3
—
—
—
1
Jacksonville, FL
127
82
39
3
1
2
13
Hartford, CT
53
38
11
3
—
1
6
Miami, FL
1
1
—
—
—
—
—
Lowell, MA
27
20
5
2
—
—
4
Norfolk, VA
57
44
10
1
—
2
4
Lynn, MA
12
10
1
1
—
—
—
Richmond, VA
64
49
10
3
1
1
4
New Bedford, MA
18
14
3
1
—
—
—
Savannah, GA
51
34
11
5
—
1
3
New Haven, CT
34
20
9
2
3
—
8
St. Petersburg, FL
71
57
10
3
1
—
3
Providence, RI
70
54
15
1
—
—
5
Tampa, FL
14
11
2
1
—
—
4
Somerville, MA
1
—
—
—
1
—
—
Washington, D.C.
126
83
33
6
3
1
13
Springfield, MA
47
34
12
1
—
—
5
Wilmington, DE
15
9
4
1
1
—
2
Waterbury, CT
33
28
4
1
—
—
3
E.S. Central
1,111
717
275
84
21
14
123
Worcester, MA
88
63
16
3
1
5
19
Birmingham, AL
248
161
57
19
6
5
31
Mid. Atlantic
2,019
1,457
413
109
18
22
148
Chattanooga, TN
95
69
16
7
2
1
11
Albany, NY
58
42
9
2
2
3
4
Knoxville, TN
106
73
30
2
1
—
16
Allentown, PA
30
23
5
1
1
—
1
Lexington, KY
81
53
15
7
3
3
1
Buffalo, NY
112
76
30
6
—
—
10
Memphis, TN
211
125
57
24
4
1
26
Camden, NJ
30
21
3
6
—
—
4
Mobile, AL
129
92
30
7
—
—
20
Elizabeth, NJ
14
9
4
1
—
—
2
Montgomery, AL
72
51
15
4
2
—
7
Erie, PA
63
46
12
3
—
2
5
Nashville, TN
169
93
55
14
3
4
11
Jersey City, NJ
29
21
7
1
—
—
4
W.S. Central
1,670
1,144
383
77
42
24
121
New York City, NY
1,218
875
254
65
10
14
77
Austin, TX
136
91
33
9
2
1
16
Newark, NJ
39
23
14
2
—
—
2
Baton Rouge, LA
99
68
19
5
4
3
7
Paterson, NJ
19
15
2
1
1
—
4
Corpus Christi, TX
54
44
8
1
1
—
7
Philadelphia, PA
U
U
U
U
U
U
U
Dallas, TX
251
160
67
8
11
5
20
Pittsburgh, PA§
48
36
8
3
—
1
4
El Paso, TX
120
87
23
6
2
2
5
Reading, PA
54
44
8
1
1
—
5
Fort Worth, TX
U
U
U
U
U
U
U
Rochester, NY
89
65
20
3
1
—
6
Houston, TX
281
178
77
15
5
6
16
Schenectady, NY
23
18
5
—
—
—
1
Little Rock, AR
140
94
35
8
1
2
1
Scranton, PA
38
33
3
2
—
—
6
New Orleans, LA
79
42
24
11
1
1
1
Syracuse, NY
81
65
12
—
2
2
9
San Antonio, TX
315
231
64
9
8
3
30
Trenton, NJ
34
17
8
9
—
—
1
Shreveport, LA
111
78
23
3
6
1
6
Utica, NY
14
7
5
2
—
—
—
Tulsa, OK
84
71
10
2
1
—
12
Yonkers, NY
26
21
4
1
—
—
3
Mountain
1,410
953
322
87
31
13
104
E.N. Central
2,275
1,623
501
83
35
33
238
Albuquerque, NM
135
88
30
11
4
1
20
Akron, OH
58
45
11
—
—
2
11
Boise, ID
59
43
14
2
—
—
5
Canton, OH
41
32
7
—
1
1
4
Colorado Springs, CO
119
76
29
8
5
1
3
Chicago, IL
267
176
62
16
6
7
28
Denver, CO
84
53
21
7
1
2
1
Cincinnati, OH
87
55
23
5
1
3
5
Las Vegas, NV
352
239
86
21
3
3
28
Cleveland, OH
265
200
55
6
2
2
33
Ogden, UT
33
27
6
—
—
—
3
Columbus, OH
280
200
68
8
2
2
34
Phoenix, AZ
215
133
55
12
8
5
20
Dayton, OH
139
98
34
4
1
2
16
Pueblo, CO
42
31
10
1
—
—
2
Detroit, MI
170
103
47
13
5
2
14
Salt Lake City, UT
140
91
32
12
5
—
12
Evansville, IN
71
51
17
3
—
—
11
Tucson, AZ
231
172
39
13
5
1
10
Fort Wayne, IN
96
69
20
4
2
1
10
Pacific
1,967
1,427
387
90
32
31
215
Gary, IN
12
7
2
1
2
—
—
Berkeley, CA
15
12
3
—
—
—
3
Grand Rapids, MI
74
59
13
—
2
—
10
Fresno, CA
135
100
25
6
1
3
17
Indianapolis, IN
191
143
37
4
3
4
18
Glendale, CA
34
32
1
1
—
—
8
Lansing, MI
50
34
14
1
1
—
5
Honolulu, HI
85
66
13
4
1
1
9
Milwaukee, WI
94
69
18
4
2
1
10
Long Beach, CA
87
60
16
6
2
3
12
Peoria, IL
64
46
13
2
2
1
9
Los Angeles, CA
305
202
72
19
6
6
35
Rockford, IL
60
41
13
5
1
—
7
Pasadena, CA
22
18
1
2
1
—
6
South Bend, IN
69
53
15
1
—
—
6
Portland, OR
111
76
25
5
1
4
6
Toledo, OH
103
77
17
3
1
5
2
Sacramento, CA
229
160
53
7
4
5
26
Youngstown, OH
84
65
15
3
1
—
5
San Diego, CA
193
143
38
8
3
1
23
W.N. Central
833
557
191
46
24
15
74
San Francisco, CA
156
116
32
7
1
—
17
Des Moines, IA
102
80
18
3
1
—
11
San Jose, CA
222
176
33
5
3
5
18
Duluth, MN
32
22
7
2
1
—
5
Santa Cruz, CA
41
30
5
3
3
—
3
Kansas City, KS
49
25
16
3
2
3
6
Seattle, WA
126
85
33
5
1
2
13
Kansas City, MO
118
81
26
8
2
1
10
Spokane, WA
64
48
10
5
1
—
6
Lincoln, NE
52
38
9
1
1
3
1
Tacoma, WA
142
103
27
7
4
1
13
Minneapolis, MN
88
57
20
5
3
3
9
Total¶
12,883
8,971
2,849
648
233
178
1,213
Omaha, NE
118
82
28
5
3
—
16
St. Louis, MO
85
38
31
9
4
3
3
St. Paul, MN
67
51
11
4
1
—
6
Wichita, KS
122
83
25
6
6
2
7
U: Unavailable. —: No reported cases.
* Mortality data in this table are voluntarily reported from 122 cities in the United States, most of which have populations of >100,000. A death is reported by the place of its occurrence and by the week that the death certificate was filed. Fetal deaths are not included.
† Pneumonia and influenza.
§ Because of changes in reporting methods in this Pennsylvania city, these numbers are partial counts for the current week. Complete counts will be available in 4 to 6 weeks.