Persons using assistive technology might not be able to fully access information in this file. For assistance, please send e-mail to: mmwrq@cdc.gov. Type 508 Accommodation and the title of the report in the subject line of e-mail.
Notifiable Diseases and Mortality Tables
Table I Summary of provisional cases of selected notifiable diseases, United States, cumulative, week ending February 16, 2013 (7th Week)
Figure I Selected notifiable disease reports, United States, comparison of provisional 4-week totals ending February 16, 2013, with historical data
Table II Provisional cases of selected notifiable diseases, United States, weeks ending February 16, 2013 and February 18, 2012 (7th Week)
Table III Deaths in 122 U.S. cities, week ending February 16, 2013 (7th Week)
TABLE I. Provisional cases of infrequently reported notifiable diseases (<1,000 cases reported during the preceding year) — United States, week ending February 16, 2013 (7th week)*
NY (2), IN (2), IL (1), MN (2), FL (1), AR (1), TX (1), NM (2), UT (1), NYC (1)
Listeriosis
4
41
9
691
870
821
851
759
NY (1), FL (1), CO (1), CA (1)
Measles§§
—
11
2
56
220
63
71
140
Meningococcal disease, invasive¶¶:
A, C, Y, and W-135
1
16
7
125
257
280
301
330
WA (1)
serogroup B
3
9
4
82
159
135
174
188
NY (1), VA (2)
other serogroup
—
1
0
16
20
12
23
38
unknown serogroup
3
53
10
311
323
406
482
616
FL (2), WA (1)
Novel influenza A virus infections***
—
—
22
313
14
4
43,774
2
Plague
—
—
—
3
3
2
8
3
Poliomyelitis, paralytic
—
—
—
—
—
—
1
—
Polio virus Infection, nonparalytic§
—
—
—
—
—
—
—
—
Psittacosis§
—
—
0
2
2
4
9
8
Q fever, total§
1
5
2
132
134
131
113
120
acute
1
2
2
113
110
106
93
106
CA (1)
chronic
—
3
0
19
24
25
20
14
Rabies, human
—
—
—
1
6
2
4
2
Rubella†††
—
1
0
8
4
5
3
16
Rubella, congenital syndrome
—
—
0
2
—
—
2
—
SARS-CoV§
—
—
—
—
—
—
—
—
Smallpox§
—
—
—
—
—
—
—
—
Streptococcal toxic-shock syndrome§
1
18
4
127
168
142
161
157
NY (1)
Syphilis, congenital (age <1 yr)§§§
—
2
8
249
360
377
423
431
Tetanus
1
5
0
37
36
26
18
19
TX (1)
Toxic-shock syndrome (staphylococcal)§
—
4
1
61
78
82
74
71
Trichinellosis
—
—
1
17
15
7
13
39
Tularemia
—
1
0
159
166
124
93
123
Typhoid fever
—
20
8
312
390
467
397
449
Vancomycin-intermediate Staphylococcus aureus§
—
8
1
85
82
91
78
63
Vancomycin-resistant Staphylococcus aureus§
—
—
0
1
—
2
1
—
Vibriosis (noncholera Vibrio species infections)§
9
34
4
986
832
846
789
588
NC (8), CA (1)
Viral hemorrhagic fever¶¶¶
—
—
—
—
—
1
NN
NN
Yellow fever
—
—
—
—
—
—
—
—
See Table 1 footnotes on next page.
TABLE I. (Continued) Provisional cases of infrequently reported notifiable diseases (<1,000 cases reported during the preceding year) — United States, week ending February 16, 2013 (7th week)*
—: No reported cases. N: Not reportable. NN: Not Nationally Notifiable. Cum: Cumulative year-to-date counts.
† Calculated by summing the incidence counts for the current week, the 2 weeks preceding the current week, and the 2 weeks following the current week, for a total of 5 preceding years. The total sum of incident cases is then divided by 25 weeks. Additional information is available at http://wwwn.cdc.gov/nndss/document/5yearweeklyaverage.pdf.
§ Not reportable in all states. Data from states where the condition is not reportable are excluded from this table except starting in 2007 for the arboviral diseases, STD data, TB data, and influenza-associated pediatric mortality, and in 2003 for SARS-CoV. Reporting exceptions are available at http://wwwn.cdc.gov/nndss/document/SRCA_FINAL_REPORT_2006-2010.xlsx.
¶ Includes both neuroinvasive and nonneuroinvasive. Updated weekly from reports to the Division of Vector-Borne Infectious Diseases, National Center for Zoonotic, Vector-Borne, and Enteric Diseases (ArboNET Surveillance). Data for West Nile virus are available in Table II.
** Data for H. influenzae (all ages, all serotypes) are available in Table II.
†† Updated weekly from reports to the Influenza Division, National Center for Immunization and Respiratory Diseases. Since September 30, 2012, 78 influenza-associated pediatric deaths occurring during the 2012-13 influenza season have been reported.
§§ No measles cases were reported for the current week.
¶¶ Data for meningococcal disease (all serogroups) are available in Table II.
*** CDC discontinued reporting of individual confirmed and probable cases of 2009 pandemic influenza A (H1N1) virus infections on July 24, 2009. During 2009, four cases of human infection with novel influenza A viruses, different from the 2009 pandemic influenza A (H1N1) strain, were reported to CDC. The four cases of novel influenza A virus infection reported to CDC during 2010, the fourteen cases reported during 2011, and the 313 cases reported in 2012 are different from the 2009 pandemic influenza A (H1N1) virus. Total case counts are provided by the Influenza Division, National Center for Immunization and Respiratory Diseases (NCIRD).
††† No rubella cases were reported for the current week.
§§§ Updated weekly from reports to the Division of STD Prevention, National Center for HIV/AIDS, Viral Hepatitis, STD, and TB Prevention.
¶¶¶ There were no cases of viral hemorrhagic fever reported during the current week. See Table II for dengue hemorrhagic fever.
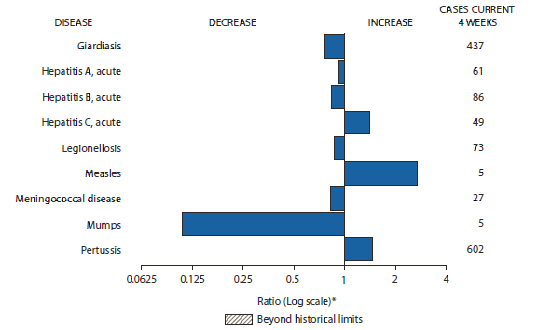
FIGURE I. Selected notifiable disease reports, United States, comparison of provisional 4-week totals February 16, 2013, with historical data
* Ratio of current 4-week total to mean of 15 4-week totals (from previous, comparable, and subsequent 4-week periods for the past 5 years). The point where the hatched area begins is based on the mean and two standard deviations of these 4-week totals.
Alternate Text: The figure above shows selected notifiable disease reports for the United States with comparison of provisional 4-week totals through February 16, 2013, with historical data. Reports of acute hepatitis C, measles, and pertussis all increased. Reports of giardiasis, acute hepatitis A, acute hepatitis B, legionellosis, meningococcal disease, and mumps all decreased.
TABLE II. Provisional cases of selected notifiable diseases, United States, weeks ending February 16, 2013, and February 18, 2012 (7th week)*
Reporting area
Chlamydia trachomatis infection
Coccidioidomycosis
Cryptosporidiosis
Current week
Previous 52 weeks
Cum 2013
Cum 2012
Current week
Previous 52 weeks
Cum 2013
Cum 2012
Current week
Previous 52 weeks
Cum 2013
Cum 2012
Med
Max
Med
Max
Med
Max
United States
10,993
26,810
30,427
144,011
191,299
18
270
555
223
2,758
40
124
281
480
744
New England
733
944
1,347
5,642
6,246
—
0
1
1
—
2
7
19
14
38
Connecticut
68
245
567
1,406
1,545
N
0
0
N
N
—
1
3
3
5
Maine
—
56
101
—
457
N
0
0
N
N
—
1
4
2
5
Massachusetts
460
472
706
3,081
2,920
—
0
0
—
—
2
2
8
6
19
New Hampshire
1
60
83
330
444
—
0
1
1
—
—
0
4
1
4
Rhode Island
161
81
158
538
768
—
0
1
—
—
—
0
3
—
—
Vermont
43
28
98
287
112
N
0
0
N
N
—
1
6
2
5
Mid. Atlantic
1,828
3,841
4,467
23,342
26,831
—
0
1
—
2
11
12
41
60
73
New Jersey
168
539
628
3,259
3,838
N
0
0
N
N
—
0
4
—
8
New York (Upstate)
792
721
1,637
4,098
3,885
N
0
0
N
N
4
3
18
16
13
New York City
—
1,129
1,263
6,249
8,541
N
0
0
N
N
—
2
8
6
12
Pennsylvania
868
1,452
1,988
9,736
10,567
—
0
1
—
2
7
7
21
38
40
E.N. Central
1,394
4,097
4,500
17,842
30,010
—
1
4
4
8
5
28
110
94
183
Illinois
—
1,145
1,514
1,843
9,080
N
0
0
N
N
—
3
8
3
18
Indiana
212
569
838
2,901
3,948
N
0
0
N
N
—
3
8
6
20
Michigan
565
889
1,207
5,057
6,475
—
0
3
2
5
—
5
40
20
40
Ohio
346
1,018
1,189
5,085
7,300
—
0
2
—
3
5
10
28
40
61
Wisconsin
271
469
552
2,956
3,207
—
0
1
2
—
—
9
43
25
44
W.N. Central
92
1,528
1,760
6,175
11,554
—
2
8
—
11
—
16
41
43
80
Iowa
7
210
255
1,024
1,796
N
0
0
N
N
—
4
22
6
37
Kansas
73
205
292
1,167
1,767
N
0
0
N
N
—
1
4
1
4
Minnesota
—
307
365
—
2,351
—
2
7
—
10
—
0
0
—
—
Missouri
—
544
657
2,548
3,797
—
0
1
—
1
—
4
12
22
17
Nebraska
—
134
196
792
961
—
0
1
—
—
—
2
10
9
7
North Dakota
—
50
73
182
374
—
0
0
—
—
—
0
3
1
4
South Dakota
12
75
106
462
508
N
0
0
N
N
—
2
6
4
11
S. Atlantic
3,258
5,234
6,417
31,635
38,295
—
0
1
—
1
10
19
59
137
143
Delaware
119
83
322
955
503
—
0
1
—
—
—
0
4
1
5
District of Columbia
—
134
241
823
932
—
0
0
—
—
N
0
0
N
N
Florida
816
1,515
1,729
9,526
10,412
N
0
0
N
N
6
9
24
39
53
Georgia
660
923
1,179
5,436
7,668
N
0
0
N
N
2
4
15
24
36
Maryland
—
455
1,208
1,676
2,362
—
0
1
—
1
1
1
5
9
18
North Carolina
773
865
1,771
4,383
6,675
N
0
0
N
N
1
0
29
38
—
South Carolina
—
525
908
3,261
4,043
N
0
0
N
N
—
1
4
12
12
Virginia
793
656
936
4,923
5,019
N
0
0
N
N
—
3
6
11
18
West Virginia
97
89
149
652
681
N
0
0
N
N
—
0
3
3
1
E.S. Central
930
1,931
2,559
6,770
14,891
—
0
0
—
—
—
4
14
18
39
Alabama
—
563
862
—
3,980
N
0
0
N
N
—
2
6
11
16
Kentucky
406
335
787
2,314
1,934
N
0
0
N
N
—
1
4
2
4
Mississippi
524
411
766
2,327
4,203
N
0
0
N
N
—
0
4
1
7
Tennessee
—
621
784
2,129
4,774
N
0
0
N
N
—
1
5
4
12
W.S. Central
387
3,298
4,390
19,751
21,359
—
0
1
—
—
3
9
27
39
53
Arkansas
—
327
394
1,896
2,335
N
0
0
N
N
—
1
5
1
3
Louisiana
126
468
1,317
2,045
719
—
0
1
—
—
—
2
7
22
12
Oklahoma
261
84
910
1,231
1,196
N
0
0
N
N
1
1
6
4
8
Texas
—
2,450
3,647
14,579
17,109
N
0
0
N
N
2
4
24
12
30
Mountain
704
1,776
2,071
8,801
12,113
—
186
441
52
1,856
5
12
45
22
62
Arizona
—
590
872
969
4,048
—
185
439
43
1,827
—
1
4
1
2
Colorado
363
416
556
2,671
2,911
N
0
0
N
N
1
1
7
3
7
Idaho
—
86
158
534
649
N
0
0
N
N
3
3
25
6
12
Montana
46
75
109
456
525
—
0
1
—
—
—
1
4
3
9
Nevada
33
215
325
1,250
984
—
1
7
6
12
—
0
2
1
2
New Mexico
251
225
463
2,167
1,607
—
0
3
—
8
—
1
5
3
16
Utah
—
150
179
637
1,134
—
1
4
2
7
1
2
20
5
11
Wyoming
11
33
63
117
255
—
0
1
1
2
—
0
4
—
3
Pacific
1,667
4,179
4,934
24,053
30,000
18
72
137
166
880
4
13
25
53
73
Alaska
44
106
150
744
793
N
0
0
N
N
—
0
1
—
—
California
1,002
3,220
4,026
18,884
23,233
18
72
137
166
879
4
7
15
36
49
Hawaii
—
120
148
323
859
N
0
0
N
N
—
0
1
—
2
Oregon
262
259
368
1,699
1,968
—
0
1
—
1
—
4
11
14
22
Washington
359
456
607
2,403
3,147
—
0
0
—
—
—
1
15
3
—
Territories
American Samoa
—
0
59
—
—
N
0
0
N
N
N
0
0
N
N
C.N.M.I.
—
—
—
—
—
—
—
—
—
—
—
—
—
—
—
Guam
—
—
—
—
—
—
—
—
—
—
—
—
—
—
—
Puerto Rico
115
111
307
733
830
N
0
0
N
N
N
0
0
N
N
U.S. Virgin Islands
—
14
29
—
97
—
0
0
—
—
—
0
0
—
—
C.N.M.I.: Commonwealth of Northern Mariana Islands.
U: Unavailable. —: No reported cases. N: Not reportable. NN: Not Nationally Notifiable. Cum: Cumulative year-to-date counts. Med: Median. Max: Maximum.
TABLE II. (Continued) Provisional cases of selected notifiable diseases, United States, weeks ending February 16, 2013, and February 18, 2012 (7th week)*
Reporting area
Dengue Virus Infection
Dengue Fever†
Dengue Hemorrhagic Fever§
Current week
Previous 52 weeks
Cum 2013
Cum 2012
Current week
Previous 52 weeks
Cum 2013
Cum 2012
Med
Max
Med
Max
United States
—
9
30
19
32
—
0
1
—
—
New England
—
0
3
3
2
—
0
0
—
—
Connecticut
—
0
3
2
1
—
0
0
—
—
Maine
—
0
0
—
—
—
0
0
—
—
Massachusetts
—
0
0
—
—
—
0
0
—
—
New Hampshire
—
0
0
—
—
—
0
0
—
—
Rhode Island
—
0
0
—
—
—
0
0
—
—
Vermont
—
0
1
1
1
—
0
0
—
—
Mid. Atlantic
—
1
8
3
13
—
0
0
—
—
New Jersey
—
0
0
—
—
—
0
0
—
—
New York (Upstate)
—
0
3
—
2
—
0
0
—
—
New York City
—
1
7
3
7
—
0
0
—
—
Pennsylvania
—
0
2
—
4
—
0
0
—
—
E.N. Central
—
1
3
—
5
—
0
1
—
—
Illinois
—
0
3
—
2
—
0
1
—
—
Indiana
—
0
2
—
—
—
0
0
—
—
Michigan
—
0
1
—
1
—
0
0
—
—
Ohio
—
0
1
—
1
—
0
0
—
—
Wisconsin
—
0
1
—
1
—
0
0
—
—
W.N. Central
—
0
2
—
1
—
0
1
—
—
Iowa
—
0
1
—
1
—
0
0
—
—
Kansas
—
0
0
—
—
—
0
0
—
—
Minnesota
—
0
2
—
—
—
0
0
—
—
Missouri
—
0
1
—
—
—
0
1
—
—
Nebraska
—
0
0
—
—
—
0
0
—
—
North Dakota
—
0
0
—
—
—
0
0
—
—
South Dakota
—
0
1
—
—
—
0
0
—
—
S. Atlantic
—
3
12
10
8
—
0
0
—
—
Delaware
—
0
0
—
—
—
0
0
—
—
District of Columbia
—
0
0
—
—
—
0
0
—
—
Florida
—
2
9
10
7
—
0
0
—
—
Georgia
—
0
2
—
—
—
0
0
—
—
Maryland
—
0
2
—
—
—
0
0
—
—
North Carolina
—
0
1
—
—
—
0
0
—
—
South Carolina
—
0
1
—
—
—
0
0
—
—
Virginia
—
0
2
—
1
—
0
0
—
—
West Virginia
—
0
0
—
—
—
0
0
—
—
E.S. Central
—
0
2
1
1
—
0
0
—
—
Alabama
—
0
2
—
1
—
0
0
—
—
Kentucky
—
0
1
—
—
—
0
0
—
—
Mississippi
—
0
1
1
—
—
0
0
—
—
Tennessee
—
0
2
—
—
—
0
0
—
—
W.S. Central
—
0
2
—
—
—
0
0
—
—
Arkansas
—
0
0
—
—
—
0
0
—
—
Louisiana
—
0
0
—
—
—
0
0
—
—
Oklahoma
—
0
1
—
—
—
0
0
—
—
Texas
—
0
2
—
—
—
0
0
—
—
Mountain
—
0
1
—
—
—
0
0
—
—
Arizona
—
0
1
—
—
—
0
0
—
—
Colorado
—
0
0
—
—
—
0
0
—
—
Idaho
—
0
1
—
—
—
0
0
—
—
Montana
—
0
1
—
—
—
0
0
—
—
Nevada
—
0
1
—
—
—
0
0
—
—
New Mexico
—
0
0
—
—
—
0
0
—
—
Utah
—
0
0
—
—
—
0
0
—
—
Wyoming
—
0
0
—
—
—
0
0
—
—
Pacific
—
1
7
2
2
—
0
1
—
—
Alaska
—
0
1
—
—
—
0
0
—
—
California
—
1
5
—
2
—
0
0
—
—
Hawaii
—
0
2
—
—
—
0
0
—
—
Oregon
—
0
0
—
—
—
0
0
—
—
Washington
—
0
2
2
—
—
0
1
—
—
Territories
American Samoa
—
0
0
—
—
—
0
0
—
—
C.N.M.I.
—
—
—
—
—
—
—
—
—
—
Guam
—
—
—
—
—
—
—
—
—
—
Puerto Rico
—
61
343
564
127
—
0
3
—
3
U.S. Virgin Islands
—
0
0
—
—
—
0
0
—
—
C.N.M.I.: Commonwealth of Northern Mariana Islands.
U: Unavailable. —: No reported cases. N: Not reportable. NN: Not Nationally Notifiable. Cum: Cumulative year-to-date counts. Med: Median. Max: Maximum.
† Dengue Fever includes cases that meet criteria for Dengue Fever with hemorrhage, other clinical and unknown case classifications.
§ DHF includes cases that meet criteria for dengue shock syndrome (DSS), a more severe form of DHF.
TABLE II. (Continued) Provisional cases of selected notifiable diseases, United States, weeks ending February 16, 2013, and February 18, 2012 (7th week)*
Reporting area
Ehrlichiosis/Anaplasmosis†
Ehrlichia chaffeensis
Anaplasma phagocytophilum
Undetermined
Current week
Previous 52 weeks
Cum 2013
Cum 2012
Current week
Previous 52 weeks
Cum 2013
Cum 2012
Current week
Previous 52 weeks
Cum 2013
Cum 2012
Med
Max
Med
Max
Med
Max
United States
—
10
66
8
5
—
20
67
7
46
—
3
18
—
—
New England
—
0
4
1
—
—
4
20
1
17
—
0
0
—
—
Connecticut
—
0
0
—
—
—
0
10
—
13
—
0
0
—
—
Maine
—
0
2
—
—
—
0
4
—
1
—
0
0
—
—
Massachusetts
—
0
0
—
—
—
0
0
—
—
—
0
0
—
—
New Hampshire
—
0
1
1
—
—
1
5
1
2
—
0
0
—
—
Rhode Island
—
0
3
—
—
—
1
11
—
1
—
0
0
—
—
Vermont
—
0
0
—
—
—
0
2
—
—
—
0
0
—
—
Mid. Atlantic
—
0
6
1
—
—
5
18
1
9
—
0
2
—
—
New Jersey
—
0
0
—
—
—
0
1
—
—
—
0
0
—
—
New York (Upstate)
—
0
3
1
—
—
4
18
—
6
—
0
2
—
—
New York City
—
0
3
—
—
—
0
4
1
3
—
0
0
—
—
Pennsylvania
—
0
1
—
—
—
0
0
—
—
—
0
0
—
—
E.N. Central
—
1
5
—
—
—
9
40
3
17
—
2
13
—
—
Illinois
—
0
4
—
—
—
0
1
—
3
—
0
1
—
—
Indiana
—
0
0
—
—
—
0
0
—
—
—
0
7
—
—
Michigan
—
0
0
—
—
—
0
0
—
—
—
0
1
—
—
Ohio
—
0
1
—
—
—
0
1
—
—
—
0
1
—
—
Wisconsin
—
0
3
—
—
—
9
40
3
14
—
1
6
—
—
W.N. Central
—
2
33
1
2
—
1
7
—
—
—
0
4
—
—
Iowa
N
0
0
N
N
N
0
0
N
N
N
0
0
N
N
Kansas
—
0
4
1
1
—
0
2
—
—
—
0
0
—
—
Minnesota
—
0
1
—
—
—
1
5
—
—
—
0
1
—
—
Missouri
—
2
32
—
1
—
0
4
—
—
—
0
4
—
—
Nebraska
—
0
0
—
—
—
0
1
—
—
—
0
0
—
—
North Dakota
—
0
0
—
—
—
0
0
—
—
—
0
0
—
—
South Dakota
—
0
0
—
—
—
0
0
—
—
—
0
1
—
—
S. Atlantic
—
4
30
3
3
—
1
8
2
1
—
0
2
—
—
Delaware
—
0
2
—
—
—
0
1
—
—
—
0
0
—
—
District of Columbia
N
0
0
N
N
N
0
0
N
N
N
0
0
N
N
Florida
—
0
3
—
—
—
0
2
—
—
—
0
0
—
—
Georgia
—
0
4
3
—
—
0
1
—
1
—
0
1
—
—
Maryland
—
0
4
—
—
—
0
2
1
—
—
0
0
—
—
North Carolina
—
0
19
—
1
—
0
6
—
—
—
0
0
—
—
South Carolina
—
0
1
—
—
—
0
0
—
—
—
0
0
—
—
Virginia
—
1
16
—
2
—
0
2
1
—
—
0
2
—
—
West Virginia
—
0
0
—
—
—
0
1
—
—
—
0
1
—
—
E.S. Central
—
1
9
2
—
—
0
3
—
2
—
0
2
—
—
Alabama
—
0
1
—
—
—
0
3
—
1
—
0
1
—
—
Kentucky
—
0
4
1
—
—
0
1
—
—
—
0
0
—
—
Mississippi
—
0
1
—
—
—
0
1
—
—
—
0
1
—
—
Tennessee
—
1
6
1
—
—
0
2
—
1
—
0
1
—
—
W.S. Central
—
1
16
—
—
—
0
2
—
—
—
0
1
—
—
Arkansas
—
1
11
—
—
—
0
1
—
—
—
0
0
—
—
Louisiana
—
0
1
—
—
—
0
0
—
—
—
0
1
—
—
Oklahoma
—
0
14
—
—
—
0
2
—
—
—
0
0
—
—
Texas
—
0
1
—
—
—
0
1
—
—
—
0
0
—
—
Mountain
—
0
0
—
—
—
0
0
—
—
—
0
1
—
—
Arizona
—
0
0
—
—
—
0
0
—
—
—
0
0
—
—
Colorado
N
0
0
N
N
N
0
0
N
N
N
0
0
N
N
Idaho
N
0
0
N
N
N
0
0
N
N
N
0
0
N
N
Montana
N
0
0
N
N
N
0
0
N
N
N
0
0
N
N
Nevada
—
0
0
—
—
—
0
0
—
—
—
0
0
—
—
New Mexico
N
0
0
N
N
N
0
0
N
N
N
0
0
N
N
Utah
—
0
0
—
—
—
0
0
—
—
—
0
1
—
—
Wyoming
—
0
0
—
—
—
0
0
—
—
—
0
0
—
—
Pacific
—
0
0
—
—
—
0
0
—
—
—
0
1
—
—
Alaska
N
0
0
N
N
N
0
0
N
N
N
0
0
N
N
California
—
0
0
—
—
—
0
0
—
—
—
0
1
—
—
Hawaii
N
0
0
N
N
N
0
0
N
N
N
0
0
N
N
Oregon
—
0
0
—
—
—
0
0
—
—
—
0
0
—
—
Washington
—
0
0
—
—
—
0
0
—
—
—
0
0
—
—
Territories
American Samoa
N
0
0
N
N
N
0
0
N
N
N
0
0
N
N
C.N.M.I.
—
—
—
—
—
—
—
—
—
—
—
—
—
—
—
Guam
N
—
—
N
N
N
—
—
N
N
N
—
—
N
N
Puerto Rico
N
0
0
N
N
N
0
0
N
N
N
0
0
N
N
U.S. Virgin Islands
—
0
0
—
—
—
0
0
—
—
—
0
0
—
—
C.N.M.I.: Commonwealth of Northern Mariana Islands.
U: Unavailable. —: No reported cases. N: Not reportable. NN: Not Nationally Notifiable. Cum: Cumulative year-to-date counts. Med: Median. Max: Maximum.
† Cumulative total E. ewingii cases reported for year 2012 = 13, and 0 cases reported for 2013.
TABLE II. (Continued) Provisional cases of selected notifiable diseases, United States, weeks ending February 16, 2013, and February 18, 2012 (7th week)*
Reporting area
Giardiasis
Gonorrhea
Haemophilus influenzae, invasive† All ages, all serotypes
Current week
Previous 52 weeks
Cum 2013
Cum 2012
Current week
Previous 52 weeks
Cum 2013
Cum 2012
Current week
Previous 52 weeks
Cum 2013
Cum 2012
Med
Max
Med
Max
Med
Max
United States
127
244
408
1,235
1,608
2,497
6,278
7,288
34,107
43,897
36
61
120
479
594
New England
11
25
53
114
137
116
113
166
763
691
—
4
9
31
40
Connecticut
—
3
9
4
32
40
43
84
293
231
—
1
3
3
12
Maine
6
3
10
27
12
—
8
14
—
52
—
0
2
6
4
Massachusetts
3
13
27
72
75
67
50
99
398
308
—
2
6
20
21
New Hampshire
—
1
6
2
8
1
3
9
24
26
—
0
0
—
2
Rhode Island
—
0
7
1
2
3
9
18
36
70
—
0
1
—
1
Vermont
2
3
10
8
8
5
2
10
12
4
—
0
1
2
—
Mid. Atlantic
23
44
80
221
303
379
1,004
1,176
5,624
6,895
—
14
46
92
135
New Jersey
—
2
12
—
41
43
143
192
775
1,031
—
2
9
16
25
New York (Upstate)
14
15
47
80
67
145
150
429
789
677
—
3
31
18
28
New York City
4
16
26
76
124
—
276
351
1,509
1,979
—
3
7
19
37
Pennsylvania
5
12
23
65
71
191
428
557
2,551
3,208
—
5
10
39
45
E.N. Central
18
38
72
154
302
380
1,038
1,299
4,766
7,625
5
8
18
52
93
Illinois
—
6
14
6
57
—
294
340
457
2,167
—
2
7
11
32
Indiana
—
4
10
5
36
51
142
208
731
948
—
2
6
10
17
Michigan
3
8
21
30
80
177
230
356
1,435
1,737
—
1
4
8
12
Ohio
13
11
22
74
75
103
300
395
1,556
2,106
5
3
8
23
25
Wisconsin
2
8
25
39
54
49
88
150
587
667
—
0
3
—
7
W.N. Central
—
18
43
80
140
16
333
433
1,325
2,328
2
5
9
24
35
Iowa
—
5
11
18
32
1
34
53
170
295
—
0
0
—
—
Kansas
—
2
7
6
19
15
40
71
173
351
—
0
3
4
2
Minnesota
—
0
0
—
—
—
52
87
—
341
—
1
5
—
14
Missouri
—
6
14
28
42
—
154
198
746
1,056
—
2
6
13
10
Nebraska
—
3
11
19
20
—
29
46
160
178
2
0
2
5
5
North Dakota
—
0
4
1
11
—
6
10
25
37
—
0
1
2
4
South Dakota
—
2
9
8
16
—
13
25
51
70
—
0
0
—
—
S. Atlantic
35
45
63
263
270
792
1,323
1,649
8,246
10,110
17
16
34
150
129
Delaware
—
0
2
1
1
19
18
49
173
108
1
0
2
5
—
District of Columbia
—
0
5
—
6
—
43
94
196
366
—
0
1
—
—
Florida
13
21
35
138
122
223
379
477
2,610
2,587
8
4
9
40
29
Georgia
18
8
27
57
56
171
265
358
1,603
2,126
4
3
7
34
26
Maryland
2
5
11
29
38
—
100
241
416
613
1
2
6
20
19
North Carolina
N
0
0
N
N
205
219
544
1,229
2,039
3
1
12
23
11
South Carolina
—
2
6
10
18
—
144
219
895
1,133
—
1
8
18
20
Virginia
2
5
10
25
29
156
127
214
1,003
1,041
—
2
9
8
17
West Virginia
—
0
5
3
—
18
16
32
121
97
—
0
6
2
7
E.S. Central
1
3
13
17
25
268
544
790
1,929
4,041
2
4
12
46
43
Alabama
1
3
13
17
25
—
169
255
—
1,153
1
1
7
21
11
Kentucky
N
0
0
N
N
123
89
215
646
483
1
1
3
7
7
Mississippi
N
0
0
N
N
145
122
223
713
1,163
—
0
2
4
7
Tennessee
N
0
0
N
N
—
170
239
570
1,242
—
2
7
14
18
W.S. Central
—
5
16
18
37
121
906
1,227
5,206
5,590
5
3
14
25
32
Arkansas
—
2
7
5
12
—
83
123
529
619
—
0
3
—
6
Louisiana
—
3
10
13
25
45
141
404
570
347
2
1
5
10
14
Oklahoma
—
0
0
—
—
76
22
262
288
358
3
2
13
15
12
Texas
N
0
0
N
N
—
617
1,041
3,819
4,266
—
0
1
—
—
Mountain
8
21
48
75
113
46
254
323
1,143
1,620
1
4
15
32
57
Arizona
—
2
4
3
13
—
108
161
230
730
—
1
4
6
18
Colorado
2
7
15
27
35
32
54
99
379
330
—
1
5
9
8
Idaho
4
3
8
15
12
—
3
8
13
18
—
0
2
2
4
Montana
2
1
4
6
7
4
2
8
22
11
—
0
2
1
1
Nevada
—
2
5
8
8
2
45
79
277
175
—
0
2
3
4
New Mexico
—
1
8
8
12
8
34
60
170
291
1
1
4
8
11
Utah
—
5
15
2
22
—
9
18
51
60
—
0
4
3
10
Wyoming
—
1
3
6
4
—
0
4
1
5
—
0
1
—
1
Pacific
31
51
89
293
281
379
774
903
5,105
4,997
4
3
9
27
30
Alaska
—
2
6
3
9
5
14
33
110
100
1
0
2
2
2
California
24
31
59
223
205
287
663
753
4,272
4,219
—
1
5
4
11
Hawaii
—
0
3
1
4
—
14
23
44
90
—
0
2
1
3
Oregon
2
8
15
45
46
28
28
43
232
200
2
1
6
19
14
Washington
5
8
57
21
17
59
59
98
447
388
1
0
2
1
—
Territories
American Samoa
—
0
0
—
—
—
0
0
—
—
—
0
0
—
—
C.N.M.I.
—
—
—
—
—
—
—
—
—
—
—
—
—
—
—
Guam
—
—
—
—
—
—
—
—
—
—
—
—
—
—
—
Puerto Rico
—
0
1
—
1
12
6
24
37
30
—
0
0
—
—
U.S. Virgin Islands
—
0
0
—
—
—
2
7
—
21
—
0
0
—
—
C.N.M.I.: Commonwealth of Northern Mariana Islands.
U: Unavailable. —: No reported cases. N: Not reportable. NN: Not Nationally Notifiable. Cum: Cumulative year-to-date counts. Med: Median. Max: Maximum.
† Data for H. influenzae (age <5 yrs for serotype b, nonserotype b, and unknown serotype) are available in Table I.
TABLE II. (Continued) Provisional cases of selected notifiable diseases, United States, weeks ending February 16, 2013, and February 18, 2012 (7th week)*
Reporting area
Hepatitis (viral, acute), by type
A
B
C
Current week
Previous 52 weeks
Cum 2013
Cum 2012
Current week
Previous 52 weeks
Cum 2013
Cum 2012
Current week
Previous 52 weeks
Cum 2013
Cum 2012
Med
Max
Med
Max
Med
Max
United States
13
28
49
121
186
18
59
85
222
424
14
32
44
120
214
New England
—
1
7
3
8
—
2
6
3
9
—
1
6
2
14
Connecticut
—
0
2
1
3
—
0
2
—
3
—
0
4
—
6
Maine
—
0
2
—
1
—
0
2
3
2
—
0
2
1
1
Massachusetts
—
1
4
1
4
—
1
5
—
4
—
0
2
—
7
New Hampshire
—
0
1
—
—
—
0
2
—
—
N
0
0
N
N
Rhode Island
—
0
1
—
—
U
0
0
U
U
U
0
0
U
U
Vermont
—
0
1
1
—
—
0
1
—
—
—
0
2
1
—
Mid. Atlantic
5
4
10
20
33
1
4
9
17
34
2
2
10
11
26
New Jersey
—
1
4
—
9
—
0
4
—
15
—
0
3
—
10
New York (Upstate)
1
1
4
7
8
1
1
6
5
4
1
1
9
8
4
New York City
—
1
4
6
8
—
1
5
8
9
—
0
1
—
4
Pennsylvania
4
1
4
7
8
—
1
4
4
6
1
1
4
3
8
E.N. Central
3
4
9
22
36
2
8
15
32
57
—
5
10
14
40
Illinois
—
1
5
2
16
—
1
5
—
13
—
0
3
1
5
Indiana
—
0
2
1
7
—
1
6
2
13
—
2
6
1
16
Michigan
—
2
6
4
10
—
1
7
6
7
—
2
6
11
16
Ohio
3
1
5
15
1
2
3
9
24
21
—
0
2
1
—
Wisconsin
—
0
2
—
2
—
0
3
—
3
—
0
2
—
3
W.N. Central
—
1
6
5
9
—
1
4
4
17
—
0
3
3
2
Iowa
—
0
2
1
—
—
0
2
1
2
—
0
0
—
—
Kansas
—
0
2
1
1
—
0
1
—
—
—
0
2
—
2
Minnesota
—
0
0
—
—
—
0
0
—
—
—
0
0
—
—
Missouri
—
0
3
—
5
—
1
3
3
14
—
0
1
3
—
Nebraska
—
0
3
2
3
—
0
1
—
1
—
0
1
—
—
North Dakota
—
0
1
1
—
—
0
0
—
—
—
0
0
—
—
South Dakota
—
0
0
—
—
—
0
1
—
—
—
0
3
—
—
S. Atlantic
1
5
15
35
25
6
14
25
76
92
5
7
16
30
51
Delaware
—
0
2
—
1
—
0
2
2
3
U
0
0
U
U
District of Columbia
—
0
0
—
—
—
0
0
—
—
—
0
0
—
—
Florida
1
1
9
6
9
5
5
11
38
25
2
2
5
12
17
Georgia
—
1
4
10
5
1
1
5
10
20
—
1
5
1
10
Maryland
—
0
3
—
3
—
1
4
4
16
3
1
3
8
5
North Carolina
—
0
4
6
3
—
1
5
4
7
—
1
6
2
4
South Carolina
—
0
2
2
—
—
1
3
3
7
—
0
1
—
—
Virginia
—
1
7
11
3
—
1
6
7
10
—
1
6
5
4
West Virginia
—
0
2
—
1
—
2
15
8
4
—
1
5
2
11
E.S. Central
3
2
5
13
4
5
10
21
58
84
6
7
12
45
39
Alabama
—
0
2
—
2
—
1
5
6
11
—
0
2
—
3
Kentucky
2
0
3
7
—
2
3
8
21
28
3
4
9
34
22
Mississippi
—
0
2
1
—
—
2
4
7
6
U
0
0
U
U
Tennessee
1
0
2
5
2
3
4
9
24
39
3
2
6
11
14
W.S. Central
—
2
8
6
22
3
5
21
19
32
—
2
10
5
5
Arkansas
—
0
2
—
2
—
1
3
2
6
—
0
2
—
—
Louisiana
—
0
1
2
1
—
0
4
4
7
—
0
3
3
—
Oklahoma
—
0
4
—
—
—
0
16
1
2
—
1
9
—
—
Texas
—
2
8
4
19
3
3
13
12
17
—
1
5
2
5
Mountain
—
3
7
6
19
1
1
4
5
10
—
2
7
3
17
Arizona
—
1
5
5
11
—
0
1
—
1
U
0
0
U
U
Colorado
—
0
3
—
3
—
0
2
—
—
—
0
3
—
8
Idaho
—
0
2
—
2
—
0
1
1
—
—
0
2
1
—
Montana
—
0
2
—
—
—
0
1
—
—
—
0
2
1
—
Nevada
—
0
1
—
2
1
0
2
3
7
—
0
2
1
2
New Mexico
—
0
2
1
1
—
0
1
1
—
—
0
3
—
3
Utah
—
0
1
—
—
—
0
2
—
2
—
0
2
—
4
Wyoming
—
0
0
—
—
—
0
0
—
—
—
0
0
—
—
Pacific
1
4
11
11
30
—
10
19
8
89
1
2
8
7
20
Alaska
—
0
1
—
—
—
0
2
—
—
—
0
0
—
—
California
—
3
10
4
25
—
2
7
4
19
—
1
6
3
11
Hawaii
—
0
2
—
2
—
6
15
—
64
—
0
0
—
—
Oregon
—
0
2
3
1
—
0
3
4
5
—
0
3
—
8
Washington
1
0
3
4
2
—
0
5
—
1
1
1
7
4
1
Territories
American Samoa
—
0
0
—
—
—
0
0
—
—
—
0
0
—
—
C.N.M.I.
—
—
—
—
—
—
—
—
—
—
—
—
—
—
—
Guam
—
—
—
—
—
—
—
—
—
—
—
—
—
—
—
Puerto Rico
—
0
0
—
—
—
0
1
—
2
N
0
0
N
N
U.S. Virgin Islands
—
0
0
—
—
—
0
0
—
—
—
0
0
—
—
C.N.M.I.: Commonwealth of Northern Mariana Islands.
U: Unavailable. —: No reported cases. N: Not reportable. NN: Not Nationally Notifiable. Cum: Cumulative year-to-date counts. Med: Median. Max: Maximum.
TABLE II. (Continued) Provisional cases of selected notifiable diseases, United States, weeks ending February 16, 2013, and February 18, 2012 (7th week)*
Reporting area
Legionellosis
Lyme disease
Malaria
Current week
Previous 52 weeks
Cum 2013
Cum 2012
Current week
Previous 52 weeks
Cum 2013
Cum 2012
Current week
Previous 52 weeks
Cum 2013
Cum 2012
Med
Max
Med
Max
Med
Max
United States
27
61
145
239
321
44
432
1,460
638
1,872
7
23
44
96
139
New England
2
5
19
16
15
—
113
607
42
574
—
1
5
7
8
Connecticut
—
1
7
2
2
—
39
182
3
197
—
0
2
—
—
Maine
—
0
3
1
—
—
16
69
19
47
—
0
1
—
—
Massachusetts
2
3
11
8
8
—
47
343
2
230
—
1
4
5
7
New Hampshire
—
0
2
—
1
—
8
53
2
73
—
0
2
2
—
Rhode Island
—
0
4
3
4
—
0
26
—
3
—
0
1
—
—
Vermont
—
0
2
2
—
—
8
29
16
24
—
0
1
—
1
Mid. Atlantic
9
14
43
44
81
25
200
659
386
891
1
6
14
19
21
New Jersey
—
2
12
1
17
—
51
166
87
319
—
0
0
—
—
New York (Upstate)
3
6
15
15
17
15
41
224
55
82
1
1
4
7
2
New York City
—
2
13
9
18
—
1
12
—
3
—
3
11
10
15
Pennsylvania
6
4
19
19
29
10
95
407
244
487
—
1
4
2
4
E.N. Central
4
12
45
52
66
—
21
168
18
103
1
2
8
8
16
Illinois
—
3
23
3
14
—
2
18
—
6
—
0
6
—
4
Indiana
1
2
5
19
11
—
1
6
—
3
—
0
2
—
4
Michigan
—
1
6
—
10
—
2
9
4
2
—
0
5
3
2
Ohio
3
5
17
30
28
—
1
6
6
5
1
1
3
4
4
Wisconsin
—
1
7
—
3
—
17
138
8
87
—
0
2
1
2
W.N. Central
—
3
10
7
19
—
2
27
1
7
—
0
5
3
7
Iowa
—
0
2
—
—
—
1
16
—
2
—
0
1
—
1
Kansas
—
0
1
1
—
—
0
3
—
—
—
0
2
—
3
Minnesota
—
1
4
—
6
—
1
9
—
5
—
0
0
—
—
Missouri
—
1
8
2
12
—
0
2
1
—
—
0
2
1
3
Nebraska
—
0
2
3
—
—
0
2
—
—
—
0
1
1
—
North Dakota
—
0
1
—
1
—
0
1
—
—
—
0
1
—
—
South Dakota
—
0
1
1
—
—
0
1
—
—
—
0
2
1
—
S. Atlantic
8
10
25
53
65
18
61
179
179
266
2
7
16
47
47
Delaware
—
0
2
—
4
—
10
30
32
66
—
0
1
—
1
District of Columbia
N
0
0
N
N
N
0
0
N
N
—
0
0
—
2
Florida
3
4
11
28
27
5
2
6
12
17
1
1
3
11
13
Georgia
—
1
3
3
8
—
0
4
3
2
—
1
5
3
2
Maryland
—
2
6
9
10
8
28
98
113
101
1
2
8
27
12
North Carolina
5
1
8
8
5
—
0
29
—
1
—
0
8
—
2
South Carolina
—
0
3
1
3
—
1
3
—
5
—
0
2
—
3
Virginia
—
1
4
4
8
5
17
71
15
65
—
1
4
6
12
West Virginia
—
0
2
—
—
—
1
10
4
9
—
0
0
—
—
E.S. Central
1
2
7
8
9
—
1
5
3
3
1
0
4
5
1
Alabama
—
0
2
1
2
—
0
2
1
1
—
0
2
—
1
Kentucky
1
0
4
2
3
—
0
4
1
2
1
0
2
3
—
Mississippi
—
0
2
—
1
—
0
1
—
—
—
0
1
—
—
Tennessee
—
1
3
5
3
—
0
4
1
—
—
0
2
2
—
W.S. Central
2
3
21
13
7
—
1
6
—
3
—
1
10
1
8
Arkansas
—
0
3
1
—
—
0
0
—
—
—
0
1
—
—
Louisiana
—
0
3
3
2
—
0
1
—
1
—
0
2
1
—
Oklahoma
—
0
9
—
—
—
0
0
—
—
—
0
4
—
4
Texas
2
2
18
9
5
—
1
6
—
2
—
0
10
—
4
Mountain
—
2
6
8
15
—
0
5
5
5
1
1
5
2
11
Arizona
—
0
3
—
4
—
0
2
—
1
—
0
2
—
1
Colorado
—
0
3
—
4
—
0
0
—
—
—
0
3
—
4
Idaho
—
0
2
1
1
—
0
3
4
2
—
0
1
—
1
Montana
—
0
1
1
—
—
0
1
1
—
—
0
0
—
—
Nevada
—
0
2
1
3
—
0
2
—
—
1
0
1
2
4
New Mexico
—
0
2
1
—
—
0
1
—
—
—
0
1
—
—
Utah
—
0
4
4
2
—
0
1
—
1
—
0
2
—
1
Wyoming
—
0
1
—
1
—
0
1
—
1
—
0
0
—
—
Pacific
1
5
23
38
44
1
2
8
4
20
1
3
7
4
20
Alaska
—
0
0
—
—
—
0
2
—
2
—
0
1
—
1
California
1
4
21
34
39
1
1
4
2
14
1
1
6
2
17
Hawaii
—
0
1
1
—
N
0
0
N
N
—
0
1
—
1
Oregon
—
0
2
1
5
—
1
6
2
4
—
0
2
—
1
Washington
—
0
5
2
—
—
0
4
—
—
—
0
3
2
—
Territories
American Samoa
N
0
0
N
N
N
0
0
N
N
—
0
0
—
—
C.N.M.I.
—
—
—
—
—
—
—
—
—
—
—
—
—
—
—
Guam
—
—
—
—
—
—
—
—
—
—
—
—
—
—
—
Puerto Rico
—
0
0
—
—
N
0
0
N
N
—
0
0
—
—
U.S. Virgin Islands
—
0
0
—
—
N
0
0
N
N
—
0
0
—
—
C.N.M.I.: Commonwealth of Northern Mariana Islands.
U: Unavailable. —: No reported cases. N: Not reportable. NN: Not Nationally Notifiable. Cum: Cumulative year-to-date counts. Med: Median. Max: Maximum.
TABLE II. (Continued) Provisional cases of selected notifiable diseases, United States, weeks ending February 16, 2013, and February 18, 2012 (7th week)*
Reporting area
Meningococcal disease, invasive† All serogroups
Mumps
Pertussis
Current week
Previous 52 weeks
Cum 2013
Cum 2012
Current week
Previous 52 weeks
Cum 2013
Cum 2012
Current week
Previous 52 weeks
Cum 2013
Cum 2012
Med
Max
Med
Max
Med
Max
United States
7
10
18
79
87
2
3
8
18
33
160
848
1,305
1,667
3,623
New England
—
0
3
4
1
—
0
2
2
—
6
48
101
141
179
Connecticut
—
0
1
1
—
—
0
1
1
—
—
4
9
2
8
Maine
—
0
1
1
—
—
0
1
1
—
3
14
37
61
21
Massachusetts
—
0
2
2
1
—
0
2
—
—
1
13
29
22
40
New Hampshire
—
0
0
—
—
—
0
1
—
—
—
3
19
9
16
Rhode Island
—
0
0
—
—
—
0
1
—
—
2
1
20
6
16
Vermont
—
0
1
—
—
—
0
0
—
—
—
8
42
41
78
Mid. Atlantic
1
1
5
7
11
—
0
3
2
1
24
100
183
202
658
New Jersey
—
0
2
1
1
—
0
0
—
—
—
13
40
—
123
New York (Upstate)
1
0
2
3
1
—
0
1
—
—
20
45
115
115
232
New York City
—
0
2
2
4
—
0
3
1
1
—
7
19
3
110
Pennsylvania
—
0
2
1
5
—
0
1
1
—
4
34
66
84
193
E.N. Central
—
1
4
2
10
—
1
3
4
12
17
176
356
306
1,196
Illinois
—
0
3
—
1
—
0
2
2
7
—
34
65
25
321
Indiana
—
0
1
2
1
—
0
2
—
1
—
8
18
11
29
Michigan
—
0
2
—
2
—
0
1
—
2
1
11
40
41
107
Ohio
—
0
2
—
5
—
0
1
2
1
16
18
37
114
91
Wisconsin
—
0
2
—
1
—
0
1
—
1
—
97
262
115
648
W.N. Central
—
1
4
4
5
—
0
2
—
2
2
123
256
107
391
Iowa
—
0
1
—
—
—
0
1
—
—
—
32
100
26
59
Kansas
—
0
1
—
1
—
0
1
—
—
—
15
30
17
48
Minnesota
—
0
3
—
1
—
0
1
—
—
—
52
145
—
167
Missouri
—
0
3
3
3
—
0
1
—
2
—
14
45
43
108
Nebraska
—
0
1
—
—
—
0
1
—
—
2
2
19
19
5
North Dakota
—
0
1
—
—
—
0
0
—
—
—
0
45
—
—
South Dakota
—
0
1
1
—
—
0
0
—
—
—
1
6
2
4
S. Atlantic
4
2
6
28
9
—
0
3
2
4
30
56
105
156
220
Delaware
—
0
1
—
—
—
0
0
—
—
1
1
4
7
6
District of Columbia
—
0
1
—
—
—
0
2
—
—
—
0
4
—
4
Florida
2
1
3
14
7
—
0
1
—
2
10
10
26
46
57
Georgia
—
0
2
2
—
—
0
2
—
—
4
4
15
12
12
Maryland
—
0
1
2
2
—
0
1
1
—
1
6
18
28
42
North Carolina
—
0
2
5
—
—
0
1
—
—
9
8
75
30
10
South Carolina
—
0
1
—
—
—
0
1
—
—
—
4
14
15
15
Virginia
2
0
2
3
—
—
0
1
1
1
5
11
41
17
52
West Virginia
—
0
2
2
—
—
0
1
—
1
—
1
12
1
22
E.S. Central
—
0
2
4
—
—
0
2
2
1
2
24
48
98
102
Alabama
—
0
1
1
—
—
0
1
1
—
—
4
11
20
17
Kentucky
—
0
1
1
—
—
0
1
—
—
—
12
35
43
48
Mississippi
—
0
1
2
—
—
0
1
—
1
—
1
4
2
14
Tennessee
—
0
1
—
—
—
0
1
1
—
2
5
15
33
23
W.S. Central
—
1
4
2
5
1
0
2
3
2
19
47
245
96
94
Arkansas
—
0
1
—
—
—
0
1
—
—
—
2
22
9
2
Louisiana
—
0
0
—
—
—
0
1
1
—
—
1
7
5
2
Oklahoma
—
0
2
—
1
—
0
1
—
—
—
0
34
5
—
Texas
—
0
4
2
4
1
0
2
2
2
19
40
227
77
90
Mountain
—
0
3
2
8
—
0
2
—
4
21
119
167
353
458
Arizona
—
0
2
—
1
—
0
2
—
1
—
14
33
84
128
Colorado
—
0
2
1
1
—
0
2
—
1
10
29
66
70
92
Idaho
—
0
1
—
1
—
0
0
—
—
6
4
14
29
16
Montana
—
0
1
—
2
—
0
0
—
1
4
10
48
83
14
Nevada
—
0
1
—
2
—
0
0
—
—
1
1
6
12
10
New Mexico
—
0
2
—
1
—
0
0
—
—
—
17
33
53
42
Utah
—
0
1
—
—
—
0
1
—
1
—
31
52
22
153
Wyoming
—
0
1
1
—
—
0
1
—
—
—
0
5
—
3
Pacific
2
2
6
26
38
1
0
2
3
7
39
126
301
208
325
Alaska
—
0
1
—
—
—
0
1
—
—
7
7
24
92
12
California
—
1
5
21
28
1
0
2
3
5
—
12
27
21
109
Hawaii
—
0
1
—
1
—
0
1
—
—
—
1
6
1
39
Oregon
—
0
2
2
9
—
0
1
—
1
3
13
54
41
50
Washington
2
0
3
3
—
—
0
1
—
1
29
83
254
53
115
Territories
American Samoa
—
0
0
—
—
—
0
0
—
—
—
0
0
—
—
C.N.M.I.
—
—
—
—
—
—
—
—
—
—
—
—
—
—
—
Guam
—
—
—
—
—
—
—
—
—
—
—
—
—
—
—
Puerto Rico
—
0
0
—
—
—
0
1
—
1
—
0
0
—
—
U.S. Virgin Islands
—
0
0
—
—
—
0
0
—
—
—
0
0
—
—
C.N.M.I.: Commonwealth of Northern Mariana Islands.
U: Unavailable. —: No reported cases. N: Not reportable. NN: Not Nationally Notifiable. Cum: Cumulative year-to-date counts. Med: Median. Max: Maximum.
† Data for meningococcal disease, invasive caused by serogroups A, C, Y, and W-135; serogroup B; other serogroup; and unknown serogroup are available in Table I.
TABLE II. (Continued) Provisional cases of selected notifiable diseases, United States, weeks ending February 16, 2013, and February 18, 2012 (7th week)*
Reporting area
Rabies, animal
Salmonellosis
Shiga toxin-producing E. coli (STEC)†
Current week
Previous 52 weeks
Cum 2013
Cum 2012
Current week
Previous 52 weeks
Cum 2013
Cum 2012
Current week
Previous 52 weeks
Cum 2013
Cum 2012
Med
Max
Med
Max
Med
Max
United States
9
72
128
135
443
176
987
1,687
2,389
3,600
13
121
204
227
406
New England
—
6
16
23
49
6
37
72
99
123
—
4
12
10
10
Connecticut
—
3
8
9
23
—
8
18
21
31
—
1
4
2
5
Maine
—
1
4
5
15
1
3
11
5
9
—
0
6
—
—
Massachusetts
—
0
0
—
—
5
21
53
55
58
—
2
7
6
5
New Hampshire
—
0
3
2
4
—
2
8
7
9
—
0
4
2
—
Rhode Island
—
0
5
2
5
—
2
7
5
5
—
0
1
—
—
Vermont
—
1
7
5
2
—
1
7
6
11
—
0
2
—
—
Mid. Atlantic
5
14
31
34
57
17
90
193
248
382
1
11
23
25
49
New Jersey
—
0
0
—
—
—
17
48
12
101
—
1
6
—
15
New York (Upstate)
5
7
20
34
23
9
23
64
73
70
—
4
13
11
6
New York City
—
0
0
—
—
2
20
49
82
93
—
1
7
4
10
Pennsylvania
—
6
15
—
34
6
28
82
81
118
1
3
11
10
18
E.N. Central
—
2
13
2
4
15
100
239
213
399
3
16
72
43
77
Illinois
—
1
6
1
—
—
34
79
52
143
—
3
16
—
13
Indiana
—
0
2
—
—
—
13
40
15
36
—
2
23
8
6
Michigan
—
0
5
1
3
—
15
46
52
74
—
3
41
13
30
Ohio
—
0
7
—
1
15
24
53
85
80
3
3
20
15
7
Wisconsin
N
0
0
N
N
—
13
35
9
66
—
3
21
7
21
W.N. Central
—
3
18
8
19
6
46
115
151
177
—
16
31
35
44
Iowa
—
0
5
—
—
3
9
32
34
34
—
3
15
2
8
Kansas
—
1
4
5
7
1
9
18
24
42
—
2
7
5
4
Minnesota
—
0
0
—
—
—
0
0
—
—
—
0
0
—
—
Missouri
—
0
3
3
2
—
19
48
67
70
—
6
21
22
19
Nebraska
—
0
0
—
—
2
4
26
14
15
—
1
6
3
6
North Dakota
—
0
13
—
4
—
1
5
4
6
—
0
3
1
2
South Dakota
—
1
7
—
6
—
3
9
8
10
—
1
4
2
5
S. Atlantic
—
18
34
30
197
72
268
611
855
1,114
4
12
71
44
68
Delaware
—
0
0
—
—
—
2
10
8
10
—
0
3
—
1
District of Columbia
—
0
0
—
—
—
0
3
—
7
—
0
1
—
1
Florida
—
0
13
14
105
51
110
274
421
439
1
4
10
18
24
Georgia
—
0
0
—
—
12
46
125
131
165
1
2
9
11
8
Maryland
—
6
17
11
32
8
18
43
86
85
1
1
5
5
2
North Carolina
—
0
0
—
—
—
26
166
66
214
—
1
61
4
15
South Carolina
—
0
0
—
—
—
24
72
56
91
—
0
7
—
3
Virginia
—
10
23
—
50
1
22
48
81
95
1
1
6
3
14
West Virginia
—
1
6
5
10
—
3
11
6
8
—
0
2
3
—
E.S. Central
—
1
5
1
9
3
62
215
164
241
—
5
14
16
25
Alabama
—
1
5
1
8
2
19
59
57
62
—
1
5
3
8
Kentucky
—
0
3
—
1
—
8
48
35
46
—
1
9
5
5
Mississippi
—
0
1
—
—
—
16
67
22
66
—
0
2
—
5
Tennessee
—
0
0
—
—
1
18
69
50
67
—
2
12
8
7
W.S. Central
4
12
61
37
82
23
139
407
230
463
2
10
83
7
30
Arkansas
—
0
35
10
10
7
16
229
32
26
—
1
6
2
3
Louisiana
—
0
0
—
—
2
24
59
37
85
—
0
3
—
1
Oklahoma
—
0
23
—
7
3
13
34
34
41
1
1
8
2
5
Texas
4
11
30
27
65
11
81
268
127
311
1
7
77
3
21
Mountain
—
1
16
—
14
6
42
78
115
227
1
11
43
15
38
Arizona
N
0
0
N
N
—
12
24
35
69
—
2
7
3
11
Colorado
—
0
0
—
—
—
9
19
15
62
—
3
9
—
10
Idaho
—
0
15
—
—
1
2
7
8
22
—
2
26
5
3
Montana
N
0
0
N
N
3
2
8
9
8
—
0
5
—
1
Nevada
—
0
4
—
—
1
3
12
22
11
1
0
5
5
1
New Mexico
—
0
5
—
14
1
5
18
16
26
—
1
5
—
3
Utah
—
0
2
—
—
—
4
15
8
24
—
1
15
2
6
Wyoming
—
0
0
—
—
—
1
8
2
5
—
0
3
—
3
Pacific
—
3
12
—
12
28
114
214
314
474
2
15
44
32
65
Alaska
—
0
1
—
2
—
1
4
—
9
N
0
0
N
N
California
—
3
11
—
10
19
82
164
257
387
1
8
21
19
48
Hawaii
—
0
0
—
—
—
4
58
8
13
—
0
2
2
—
Oregon
—
0
2
—
—
1
7
16
18
35
—
3
11
4
11
Washington
—
0
0
—
—
8
13
61
31
30
1
3
24
7
6
Territories
American Samoa
—
0
0
—
—
—
1
2
—
—
—
0
0
—
—
C.N.M.I.
—
—
—
—
—
—
—
—
—
—
—
—
—
—
—
Guam
—
—
—
—
—
—
—
—
—
—
—
—
—
—
—
Puerto Rico
—
0
5
—
14
—
0
4
—
11
—
0
2
—
—
U.S. Virgin Islands
—
0
0
—
—
—
0
0
—
—
—
0
0
—
—
C.N.M.I.: Commonwealth of Northern Mariana Islands.
U: Unavailable. —: No reported cases. N: Not reportable. NN: Not Nationally Notifiable. Cum: Cumulative year-to-date counts. Med: Median. Max: Maximum.
† Includes E. coli O157:H7; Shiga toxin-positive, serogroup non-O157; and Shiga toxin-positive, not serogrouped.
TABLE II. (Continued) Provisional cases of selected notifiable diseases, United States, weeks ending February 16, 2013, and February 18, 2012 (7th week)*
Reporting area
Shigellosis
Spotted Fever Rickettsiosis (including RMSF)†
Confirmed
Probable
Current week
Previous 52 weeks
Cum 2013
Cum 2012
Current week
Previous 52 weeks
Cum 2013
Cum 2012
Current week
Previous 52 weeks
Cum 2013
Cum 2012
Med
Max
Med
Max
Med
Max
United States
71
265
401
795
1,577
—
4
12
11
11
3
52
229
34
100
New England
1
4
13
23
16
—
0
1
—
—
—
0
3
—
—
Connecticut
—
1
3
3
6
—
0
0
—
—
—
0
0
—
—
Maine
—
0
4
—
—
—
0
0
—
—
—
0
1
—
—
Massachusetts
1
2
10
17
10
—
0
0
—
—
—
0
3
—
—
New Hampshire
—
0
1
1
—
—
0
0
—
—
—
0
1
—
—
Rhode Island
—
0
5
—
—
—
0
0
—
—
—
0
3
—
—
Vermont
—
0
1
2
—
—
0
1
—
—
—
0
0
—
—
Mid. Atlantic
6
39
73
88
406
—
0
2
1
3
—
1
5
2
9
New Jersey
—
9
35
—
256
—
0
0
—
—
—
0
1
—
—
New York (Upstate)
3
12
37
38
46
—
0
1
—
—
—
0
3
—
—
New York City
3
9
21
41
88
—
0
0
—
—
—
0
3
—
2
Pennsylvania
—
2
6
9
16
—
0
2
1
3
—
1
4
2
7
E.N. Central
28
39
118
261
194
—
0
2
—
1
—
4
17
4
11
Illinois
—
5
16
2
17
—
0
1
—
—
—
2
12
—
4
Indiana
—
1
17
7
11
—
0
1
—
1
—
1
5
3
2
Michigan
1
4
14
25
41
—
0
0
—
—
—
0
1
—
—
Ohio
27
28
103
220
117
—
0
0
—
—
—
0
3
1
3
Wisconsin
—
2
18
7
8
—
0
0
—
—
—
0
3
—
2
W.N. Central
—
8
32
26
53
—
0
6
—
—
—
6
34
—
4
Iowa
—
1
11
6
3
—
0
0
—
—
—
0
1
—
—
Kansas
—
2
6
3
26
—
0
0
—
—
—
0
0
—
—
Minnesota
—
0
0
—
—
—
0
0
—
—
—
0
0
—
—
Missouri
—
1
7
5
20
—
0
5
—
—
—
6
34
—
4
Nebraska
—
1
22
9
3
—
0
1
—
—
—
0
1
—
—
North Dakota
—
0
1
3
1
—
0
1
—
—
—
0
0
—
—
South Dakota
—
0
3
—
—
—
0
0
—
—
—
0
1
—
—
S. Atlantic
9
53
102
123
297
—
2
9
10
4
2
13
147
16
29
Delaware
—
0
4
1
—
—
0
0
—
—
—
0
2
2
2
District of Columbia
—
0
3
—
4
—
0
0
—
—
—
0
1
—
—
Florida
4
31
66
43
153
—
0
1
—
—
—
0
3
1
2
Georgia
5
12
21
50
90
—
1
5
9
3
—
0
0
—
—
Maryland
—
5
16
9
23
—
0
0
—
—
1
0
3
4
3
North Carolina
—
2
10
8
14
—
0
4
—
—
—
0
133
—
5
South Carolina
—
1
3
5
3
—
0
1
1
1
—
1
6
2
1
Virginia
—
1
6
6
10
—
0
2
—
—
1
4
35
7
16
West Virginia
—
0
1
1
—
—
0
0
—
—
—
0
1
—
—
E.S. Central
1
20
39
40
218
—
0
2
—
—
1
12
57
12
14
Alabama
—
5
20
15
50
—
0
1
—
—
—
3
13
2
5
Kentucky
—
5
21
12
96
—
0
1
—
—
—
1
7
2
—
Mississippi
—
4
13
7
47
—
0
2
—
—
—
0
4
—
—
Tennessee
1
3
9
6
25
—
0
1
—
—
1
10
49
8
9
W.S. Central
21
46
82
137
246
—
0
1
—
—
—
11
73
—
16
Arkansas
1
1
7
9
9
—
0
1
—
—
—
8
65
—
11
Louisiana
1
4
10
14
32
—
0
0
—
—
—
0
2
—
1
Oklahoma
4
7
27
22
37
—
0
1
—
—
—
0
26
—
—
Texas
15
32
80
92
168
—
0
1
—
—
—
1
5
—
4
Mountain
2
11
32
27
44
—
0
1
—
3
—
0
5
—
14
Arizona
—
6
15
12
24
—
0
1
—
3
—
0
2
—
10
Colorado
1
2
19
3
3
—
0
1
—
—
—
0
1
—
—
Idaho
—
0
2
—
2
—
0
0
—
—
—
0
1
—
2
Montana
—
0
2
—
3
—
0
0
—
—
—
0
1
—
—
Nevada
1
0
9
7
1
—
0
1
—
—
—
0
0
—
—
New Mexico
—
1
7
4
7
—
0
0
—
—
—
0
1
—
—
Utah
—
0
4
1
4
—
0
0
—
—
—
0
1
—
2
Wyoming
—
0
3
—
—
—
0
0
—
—
—
0
1
—
—
Pacific
3
21
57
70
103
—
0
2
—
—
—
0
1
—
3
Alaska
—
0
2
—
2
N
0
0
N
N
N
0
0
N
N
California
2
16
57
56
87
—
0
2
—
—
—
0
1
—
3
Hawaii
—
0
3
—
1
N
0
0
N
N
N
0
0
N
N
Oregon
—
1
10
5
10
—
0
0
—
—
—
0
1
—
—
Washington
1
2
19
9
3
—
0
0
—
—
—
0
0
—
—
Territories
American Samoa
—
0
3
—
—
N
0
0
N
N
N
0
0
N
N
C.N.M.I.
—
—
—
—
—
—
—
—
—
—
—
—
—
—
—
Guam
—
—
—
—
—
N
—
—
N
N
N
—
—
N
N
Puerto Rico
—
0
0
—
—
N
0
0
N
N
N
0
0
N
N
U.S. Virgin Islands
—
0
0
—
—
N
0
0
N
N
N
0
0
N
N
C.N.M.I.: Commonwealth of Northern Mariana Islands.
U: Unavailable. —: No reported cases. N: Not reportable. NN: Not Nationally Notifiable. Cum: Cumulative year-to-date counts. Med: Median. Max: Maximum.
† Illnesses with similar clinical presentation that result from Spotted fever group rickettsia infections are reported as Spotted fever rickettsioses. Rocky Mountain spotted fever (RMSF) caused by Rickettsia rickettsii, is the most common and well-known spotted fever.
TABLE II. (Continued) Provisional cases of selected notifiable diseases, United States, weeks ending February 16, 2013, and February 18, 2012 (7th week)*
Reporting area
Streptococcus pneumoniae,† invasive disease
Syphilis, primary and secondary
All ages
Age <5
Current week
Previous 52 weeks
Cum 2013
Cum 2012
Current week
Previous 52 weeks
Cum 2013
Cum 2012
Current week
Previous 52 weeks
Cum 2013
Cum 2012
Med
Max
Med
Max
Med
Max
United States
236
259
612
2,561
2,577
17
20
39
115
167
53
290
368
1,253
1,902
New England
4
11
28
103
111
—
1
4
1
8
4
8
18
42
62
Connecticut
—
5
21
54
53
—
0
2
—
3
—
0
4
2
14
Maine
3
2
8
23
18
—
0
1
—
1
—
0
5
—
—
Massachusetts
—
0
3
1
5
—
0
2
1
3
1
6
13
30
39
New Hampshire
—
1
5
10
16
—
0
1
—
1
—
1
4
3
4
Rhode Island
—
0
6
—
8
—
0
1
—
—
3
0
6
5
5
Vermont
1
1
6
15
11
—
0
0
—
—
—
0
2
2
—
Mid. Atlantic
32
37
64
341
380
3
2
5
14
21
15
39
61
173
268
New Jersey
—
5
24
2
127
—
0
3
—
8
—
4
8
2
25
New York (Upstate)
22
17
40
190
140
3
1
3
9
8
10
4
16
33
14
New York City
10
14
35
149
113
—
0
3
5
5
—
18
29
71
123
Pennsylvania
N
0
0
N
N
N
0
0
N
N
5
14
25
67
106
E.N. Central
43
55
127
565
517
2
3
10
13
21
—
28
48
68
203
Illinois
N
0
0
N
N
—
0
0
—
—
—
10
18
5
87
Indiana
—
13
36
74
123
—
1
2
—
3
—
4
10
15
27
Michigan
4
11
28
117
112
1
0
3
5
6
—
4
13
13
35
Ohio
36
21
63
277
200
1
1
6
6
7
—
7
15
24
45
Wisconsin
3
9
29
97
82
—
0
2
2
5
—
2
5
11
9
W.N. Central
3
12
24
47
133
—
1
3
4
11
—
7
14
24
48
Iowa
N
0
0
N
N
N
0
0
N
N
—
1
4
5
5
Kansas
N
0
0
N
N
N
0
0
N
N
—
0
4
1
3
Minnesota
—
9
22
—
83
—
0
3
—
5
—
2
5
—
11
Missouri
N
0
0
N
N
—
0
0
—
—
—
2
7
12
27
Nebraska
2
2
8
26
31
—
0
2
3
1
—
0
2
4
1
North Dakota
—
0
4
—
2
—
0
1
—
—
—
0
1
—
1
South Dakota
1
2
6
21
17
—
0
2
1
5
—
0
2
2
—
S. Atlantic
59
58
120
609
583
7
4
11
37
45
17
65
104
289
456
Delaware
1
0
3
3
7
—
0
1
—
—
1
0
6
3
7
District of Columbia
—
0
4
—
8
—
0
1
—
1
—
3
10
23
27
Florida
27
18
59
243
200
2
1
6
14
15
—
25
36
122
182
Georgia
21
15
44
168
167
4
1
4
12
9
12
11
31
47
78
Maryland
9
6
25
81
79
1
0
5
3
5
—
8
15
41
44
North Carolina
N
0
0
N
N
N
0
0
N
N
—
5
21
—
55
South Carolina
1
6
17
71
83
—
0
3
2
4
—
4
9
25
35
Virginia
N
0
0
N
N
—
0
0
4
5
4
4
40
28
28
West Virginia
—
5
33
43
39
—
0
2
2
6
—
0
2
—
—
E.S. Central
24
22
56
249
249
1
2
5
12
16
3
14
25
24
78
Alabama
4
2
10
40
19
1
0
3
4
—
—
4
10
—
26
Kentucky
8
4
12
51
37
—
0
1
—
—
3
2
9
9
10
Mississippi
—
3
12
27
30
—
0
2
3
5
—
2
12
8
18
Tennessee
12
12
37
131
163
—
0
3
5
11
—
5
14
7
24
W.S. Central
49
26
310
296
256
2
2
19
14
23
—
43
66
226
282
Arkansas
8
3
21
35
31
—
0
3
—
2
—
3
13
17
46
Louisiana
1
4
14
40
40
—
0
4
3
3
—
6
20
18
31
Oklahoma
N
0
0
N
N
—
0
0
—
—
—
2
5
12
11
Texas
40
20
289
221
185
2
2
19
11
18
—
33
48
179
194
Mountain
19
29
57
333
321
2
2
7
15
20
2
12
25
51
74
Arizona
8
9
36
174
141
1
1
3
9
10
—
3
8
2
26
Colorado
2
8
22
47
60
—
0
3
—
2
1
4
12
22
25
Idaho
N
0
0
N
N
—
0
0
—
—
—
0
4
1
4
Montana
1
0
4
5
11
1
0
1
1
—
—
0
1
1
—
Nevada
4
1
8
26
24
—
0
2
—
3
—
2
8
16
10
New Mexico
4
5
17
63
46
—
0
4
3
4
1
2
5
7
5
Utah
—
3
10
15
35
—
0
3
2
1
—
0
3
2
4
Wyoming
—
0
2
3
4
—
0
1
—
—
—
0
1
—
—
Pacific
3
4
10
18
27
—
0
2
4
7
12
67
98
356
431
Alaska
3
2
8
16
17
—
0
1
3
7
—
0
2
3
2
California
N
0
0
N
N
N
0
0
N
N
10
58
81
311
362
Hawaii
—
1
6
2
10
—
0
1
1
—
—
0
2
—
2
Oregon
N
0
0
N
N
N
0
0
N
N
2
3
11
28
19
Washington
N
0
0
N
N
N
0
0
N
N
—
4
10
14
46
Territories
American Samoa
N
0
0
N
N
—
0
0
—
—
—
0
0
—
—
C.N.M.I.
—
—
—
—
—
—
—
—
—
—
—
—
—
—
—
Guam
—
—
—
—
—
—
—
—
—
—
—
—
—
—
—
Puerto Rico
—
0
0
—
—
—
0
0
—
—
8
5
17
40
28
U.S. Virgin Islands
—
0
0
—
—
—
0
0
—
—
—
0
0
—
—
C.N.M.I.: Commonwealth of Northern Mariana Islands.
U: Unavailable. —: No reported cases. N: Not reportable. NN: Not Nationally Notifiable. Cum: Cumulative year-to-date counts. Med: Median. Max: Maximum.
† Includes drug resistant and susceptible cases of invasive Streptococcus pneumoniae disease among children <5 years and among all ages. Case definition: Isolation of S. pneumoniae from a normally sterile body site (e.g., blood or cerebrospinal fluid).
TABLE II. (Continued) Provisional cases of selected notifiable diseases, United States, weeks ending February 16, 2013, and February 18, 2012 (7th week)*
Reporting area
Varicella (chickenpox)
West Nile virus disease†
Neuroinvasive
Nonneuroinvasive§
Current week
Previous 52 weeks
Cum 2013
Cum 2012
Current week
Previous 52 weeks
Cum 2013
Cum 2012
Current week
Previous 52 weeks
Cum 2013
Cum 2012
Med
Max
Med
Max
Med
Max
United States
104
223
380
955
1,957
—
4
323
—
1
—
3
338
—
—
New England
1
19
49
84
186
—
0
8
—
—
—
0
5
—
—
Connecticut
—
5
10
33
35
—
0
2
—
—
—
0
3
—
—
Maine
1
3
22
18
50
—
0
1
—
—
—
0
0
—
—
Massachusetts
—
9
21
23
76
—
0
7
—
—
—
0
3
—
—
New Hampshire
—
0
1
3
—
—
0
1
—
—
—
0
0
—
—
Rhode Island
—
0
9
1
3
—
0
1
—
—
—
0
1
—
—
Vermont
—
2
13
6
22
—
0
1
—
—
—
0
1
—
—
Mid. Atlantic
18
19
56
88
207
—
0
17
—
—
—
0
17
—
—
New Jersey
—
5
25
—
77
—
0
5
—
—
—
0
4
—
—
New York (Upstate)
N
0
0
N
N
—
0
6
—
—
—
0
8
—
—
New York City
—
0
0
—
—
—
0
5
—
—
—
0
2
—
—
Pennsylvania
18
15
35
88
130
—
0
4
—
—
—
0
3
—
—
E.N. Central
29
68
129
361
519
—
0
92
—
—
—
0
39
—
—
Illinois
—
16
36
42
129
—
0
31
—
—
—
0
18
—
—
Indiana
6
8
26
41
49
—
0
8
—
—
—
0
6
—
—
Michigan
1
17
45
118
134
—
0
33
—
—
—
0
12
—
—
Ohio
17
15
33
123
142
—
0
19
—
—
—
0
12
—
—
Wisconsin
5
7
24
37
65
—
0
11
—
—
—
0
3
—
—
W.N. Central
—
7
31
19
142
—
0
36
—
—
—
0
59
—
—
Iowa
N
0
0
N
N
—
0
3
—
—
—
0
5
—
—
Kansas
—
0
11
—
73
—
0
3
—
—
—
0
6
—
—
Minnesota
—
0
0
—
—
—
0
6
—
—
—
0
7
—
—
Missouri
—
6
31
10
61
—
0
4
—
—
—
0
1
—
—
Nebraska
—
0
3
—
3
—
0
8
—
—
—
0
22
—
—
North Dakota
—
1
5
8
2
—
0
9
—
—
—
0
11
—
—
South Dakota
—
0
3
1
3
—
0
17
—
—
—
0
28
—
—
S. Atlantic
21
23
76
140
262
—
0
21
—
—
—
0
19
—
—
Delaware
—
0
1
—
2
—
0
1
—
—
—
0
2
—
—
District of Columbia
—
0
4
—
2
—
0
3
—
—
—
0
1
—
—
Florida
16
12
50
99
139
—
0
5
—
—
—
0
5
—
—
Georgia
—
1
9
9
1
—
0
6
—
—
—
0
10
—
—
Maryland
N
0
0
N
N
—
0
5
—
—
—
0
4
—
—
North Carolina
N
0
0
N
N
—
0
3
—
—
—
0
0
—
—
South Carolina
—
0
2
4
—
—
0
5
—
—
—
0
2
—
—
Virginia
5
8
20
24
62
—
0
4
—
—
—
0
3
—
—
West Virginia
—
2
12
4
56
—
0
1
—
—
—
0
2
—
—
E.S. Central
—
3
13
11
30
—
0
20
—
—
—
0
22
—
—
Alabama
—
2
12
11
26
—
0
7
—
—
—
0
4
—
—
Kentucky
N
0
0
N
N
—
0
4
—
—
—
0
2
—
—
Mississippi
—
0
1
—
4
—
0
12
—
—
—
0
17
—
—
Tennessee
N
0
0
N
N
—
0
4
—
—
—
0
2
—
—
W.S. Central
31
41
154
194
348
—
1
144
—
1
—
1
164
—
—
Arkansas
—
3
17
15
23
—
0
9
—
—
—
0
3
—
—
Louisiana
—
1
7
6
21
—
0
18
—
—
—
0
26
—
—
Oklahoma
N
0
0
N
N
—
0
24
—
—
—
0
22
—
—
Texas
31
39
152
173
304
—
1
104
—
1
—
1
129
—
—
Mountain
4
24
61
50
248
—
0
37
—
—
—
0
22
—
—
Arizona
1
8
21
5
90
—
0
10
—
—
—
0
6
—
—
Colorado
—
8
25
—
74
—
0
17
—
—
—
0
13
—
—
Idaho
N
0
0
N
N
—
0
1
—
—
—
0
3
—
—
Montana
1
2
8
14
17
—
0
1
—
—
—
0
2
—
—
Nevada
N
0
0
N
N
—
0
1
—
—
—
0
2
—
—
New Mexico
—
1
8
5
16
—
0
9
—
—
—
0
5
—
—
Utah
2
5
15
26
46
—
0
1
—
—
—
0
1
—
—
Wyoming
—
0
2
—
5
—
0
1
—
—
—
0
2
—
—
Pacific
—
2
8
8
15
—
0
32
—
—
—
0
26
—
—
Alaska
—
1
4
6
5
—
0
0
—
—
—
0
0
—
—
California
—
0
3
1
4
—
0
32
—
—
—
0
25
—
—
Hawaii
—
1
3
1
6
—
0
0
—
—
—
0
0
—
—
Oregon
N
0
0
N
N
—
0
0
—
—
—
0
2
—
—
Washington
N
0
0
N
N
—
0
4
—
—
—
0
0
—
—
Territories
American Samoa
N
0
0
N
N
—
0
0
—
—
—
0
0
—
—
C.N.M.I.
—
—
—
—
—
—
—
—
—
—
—
—
—
—
—
Guam
—
—
—
—
—
—
—
—
—
—
—
—
—
—
—
Puerto Rico
—
0
6
—
27
—
0
0
—
—
—
0
0
—
—
U.S. Virgin Islands
—
0
0
—
—
—
0
0
—
—
—
0
0
—
—
C.N.M.I.: Commonwealth of Northern Mariana Islands.
U: Unavailable. —: No reported cases. N: Not reportable. NN: Not Nationally Notifiable. Cum: Cumulative year-to-date counts. Med: Median. Max: Maximum.
† Updated weekly from reports to the Division of Vector-Borne Infectious Diseases, National Center for Zoonotic, Vector-Borne, and Enteric Diseases (ArboNET Surveillance). Data for California serogroup, eastern equine, Powassan, St. Louis, and western equine diseases are available in Table I.
§ Not reportable in all states. Data from states where the condition is not reportable are excluded from this table, except starting in 2007 for the domestic arboviral diseases and influenza-associated pediatric mortality, and in 2003 for SARS-CoV. Reporting exceptions are available at http://wwwn.cdc.gov/nndss/document/SRCA_FINAL_REPORT_2006-2010.xlsx.
TABLE III. Deaths in 122 U.S. cities,* week ending February 16, 2013 (7th week)
Reporting area
All causes, by age (years)
P&I† Total
Reporting area (Continued)
All causes, by age (years)
P&I† Total
All Ages
=65
45–64
25–44
1–24
<1
All Ages
=65
45–64
25–44
1–24
<1
New England
501
350
117
24
7
3
49
S. Atlantic
1,121
701
279
61
19
14
96
Boston, MA
139
82
42
11
3
1
13
Atlanta, GA
154
92
46
15
1
—
10
Bridgeport, CT
29
21
7
1
—
—
—
Baltimore, MD
188
115
54
11
5
3
15
Cambridge, MA
16
14
2
—
—
—
4
Charlotte, NC
153
101
40
7
4
1
17
Fall River, MA
27
23
4
—
—
—
—
Jacksonville, FL
150
105
39
6
—
—
15
Hartford, CT
61
43
16
—
1
1
7
Miami, FL
3
1
2
—
—
—
1
Lowell, MA
26
20
5
1
—
—
1
Norfolk, VA
53
29
17
2
4
1
6
Lynn, MA
8
5
2
1
—
—
—
Richmond, VA
67
40
18
7
1
1
3
New Bedford, MA
40
35
4
1
—
—
2
Savannah, GA
111
67
32
10
1
1
7
New Haven, CT
39
24
12
2
—
1
7
St. Petersburg, FL
68
44
22
1
—
1
5
Providence, RI
U
U
U
U
U
U
U
Tampa, FL
10
8
2
—
—
—
—
Somerville, MA
1
1
—
—
—
—
—
Washington, D.C.
152
89
5
2
3
6
16
Springfield, MA
48
31
12
4
1
—
4
Wilmington, DE
12
10
2
—
—
—
1
Waterbury, CT
U
U
U
U
U
U
U
E.S. Central
1,079
719
265
59
18
18
91
Worcester, MA
67
51
11
3
2
—
11
Birmingham, AL
245
165
57
14
4
5
24
Mid. Atlantic
1,909
1,384
391
86
33
15
127
Chattanooga, TN
84
60
18
5
1
—
6
Albany, NY
50
35
11
1
1
2
5
Knoxville, TN
142
100
25
13
3
1
11
Allentown, PA
27
24
2
1
—
—
3
Lexington, KY
98
62
26
8
1
1
7
Buffalo, NY
90
63
20
5
2
—
9
Memphis, TN
199
121
61
12
2
3
34
Camden, NJ
39
26
6
4
1
2
2
Mobile, AL
72
47
22
1
2
—
3
Elizabeth, NJ
18
14
3
—
1
—
2
Montgomery, AL
44
32
10
1
1
—
6
Erie, PA
62
56
3
3
—
—
6
Nashville, TN
195
132
46
5
4
8
—
Jersey City, NJ
27
18
9
—
—
—
2
W.S. Central
1,500
1,025
344
75
27
26
104
New York City, NY
1,180
850
255
49
18
8
68
Austin, TX
103
68
29
3
1
2
9
Newark, NJ
43
29
7
3
4
—
2
Baton Rouge, LA
91
58
21
3
2
7
2
Paterson, NJ
28
17
5
5
1
—
—
Corpus Christi, TX
U
U
U
U
U
U
U
Philadelphia, PA
U
U
U
U
U
U
U
Dallas, TX
235
140
62
19
7
5
20
Pittsburgh, PA§
56
42
11
2
—
1
9
El Paso, TX
86
64
18
2
2
—
6
Reading, PA
38
30
5
3
—
—
3
Fort Worth, TX
U
U
U
U
U
U
U
Rochester, NY
86
62
18
3
2
1
3
Houston, TX
334
240
65
20
5
4
10
Schenectady, NY
13
11
2
—
—
—
3
Little Rock, AR
107
77
23
6
1
—
6
Scranton, PA
25
18
5
1
1
—
—
New Orleans, LA
34
13
15
4
2
—
3
Syracuse, NY
66
48
15
1
1
1
6
San Antonio, TX
358
245
85
13
7
7
28
Trenton, NJ
16
11
3
1
1
—
1
Shreveport, LA
69
52
13
3
—
1
6
Utica, NY
28
18
7
3
—
—
1
Tulsa, OK
83
68
13
2
—
—
14
Yonkers, NY
17
12
4
1
—
—
2
Mountain
1,371
968
273
90
24
15
101
E.N. Central
2,325
1,602
535
123
36
29
192
Albuquerque, NM
159
104
36
14
2
3
15
Akron, OH
71
52
15
2
2
—
8
Boise, ID
62
43
16
2
—
1
5
Canton, OH
41
27
13
1
—
—
5
Colorado Springs, CO
91
67
15
5
4
—
7
Chicago, IL
287
190
65
23
7
2
26
Denver, CO
89
56
19
10
2
2
—
Cincinnati, OH
96
47
30
9
5
5
5
Las Vegas, NV
340
250
64
22
3
1
26
Cleveland, OH
298
214
67
12
3
2
17
Ogden, UT
38
29
5
4
—
—
4
Columbus, OH
216
147
49
14
2
4
12
Phoenix, AZ
203
127
50
16
6
4
18
Dayton, OH
174
126
37
6
3
2
14
Pueblo, CO
44
33
10
—
—
1
6
Detroit, MI
177
114
40
18
3
2
18
Salt Lake City, UT
142
92
31
13
4
2
15
Evansville, IN
49
37
10
2
—
—
5
Tucson, AZ
203
167
27
4
3
1
5
Fort Wayne, IN
81
68
10
2
—
1
4
Pacific
1,996
1,434
418
81
39
24
236
Gary, IN
14
6
7
1
—
—
1
Berkeley, CA
16
13
2
—
—
1
2
Grand Rapids, MI
66
45
14
3
2
2
7
Fresno, CA
148
103
33
3
6
3
14
Indianapolis, IN
219
155
52
8
3
1
31
Glendale, CA
41
38
3
—
—
—
12
Lansing, MI
59
39
16
3
1
—
4
Honolulu, HI
73
53
15
1
3
1
9
Milwaukee, WI
89
53
27
9
—
—
6
Long Beach, CA
77
53
20
2
2
—
15
Peoria, IL
65
46
14
1
2
2
4
Los Angeles, CA
288
179
73
19
10
7
49
Rockford, IL
73
54
16
3
—
—
5
Pasadena, CA
34
27
7
—
—
—
6
South Bend, IN
71
57
8
1
1
4
9
Portland, OR
162
118
35
7
—
2
14
Toledo, OH
119
80
33
3
1
2
9
Sacramento, CA
230
176
42
9
2
1
14
Youngstown, OH
60
45
12
2
1
—
2
San Diego, CA
192
138
37
10
4
3
25
W.N. Central
789
539
180
43
12
12
81
San Francisco, CA
143
89
46
4
3
1
18
Des Moines, IA
102
78
17
3
3
1
17
San Jose, CA
248
200
37
6
3
2
25
Duluth, MN
34
30
4
—
—
—
3
Santa Cruz, CA
37
33
2
2
—
—
4
Kansas City, KS
24
14
7
2
—
1
4
Seattle, WA
126
81
33
8
3
1
9
Kansas City, MO
155
106
36
9
2
1
13
Spokane, WA
73
55
12
3
1
2
8
Lincoln, NE
58
43
11
3
1
—
3
Tacoma, WA
108
78
21
7
2
—
12
Minneapolis, MN
75
50
17
3
2
2
10
Total¶
12,591
8,722
2,802
642
215
156
1,077
Omaha, NE
112
74
27
8
1
2
13
St. Louis, MO
95
54
28
6
1
5
2
St. Paul, MN
45
32
11
2
—
—
5
Wichita, KS
89
58
22
7
2
—
11
U: Unavailable. —: No reported cases.
* Mortality data in this table are voluntarily reported from 122 cities in the United States, most of which have populations of >100,000. A death is reported by the place of its occurrence and by the week that the death certificate was filed. Fetal deaths are not included.
† Pneumonia and influenza.
§ Because of changes in reporting methods in this Pennsylvania city, these numbers are partial counts for the current week. Complete counts will be available in 4 to 6 weeks.