Table I Summary of provisional cases of selected notifiable diseases, United States, cumulative, week ending January 18, 2014 (3rd Week)
Figure I Selected notifiable disease reports, United States, comparison of provisional 4-week totals ending January 18, 2014, with historical data
Table II Provisional cases of selected notifiable diseases, United States, weeks ending January 18, 2014 and January 19, 2013 (3rd Week)
Table III Deaths in 122 U.S. cities, week ending January 18, 2014 (3rd Week)
TABLE I. Provisional cases of infrequently reported notifiable diseases (<1,000 cases reported during the preceding year) — United States, week ending January 18, 2014 (3rd week)* (Export data)
TABLE I. (Continued) Provisional cases of infrequently reported notifiable diseases (<1,000 cases reported during the preceding year) — United States, week ending January 18, 2014 (3rd week)*
—: No reported cases. N: Not reportable. NN: Not Nationally Notifiable. Cum: Cumulative year-to-date counts.
† Calculated by summing the incidence counts for the current week, the 2 weeks preceding the current week, and the 2 weeks following the current week, for a total of 5 preceding years. Additional information is available at http://wwwn.cdc.gov/nndss/document/5yearweeklyaverage.pdf.
§ Not reportable in all states. Data from states where the condition is not reportable are excluded from this table except starting in 2007 for the arboviral diseases, STD data, TB data, and influenza-associated pediatric mortality, and in 2003 for SARS-CoV. Reporting exceptions are available at http://wwwn.cdc.gov/nndss/document/SRCA_FINAL_REPORT_2006-2012_final.xlsx.
¶ Includes both neuroinvasive and nonneuroinvasive. Updated weekly from reports to the Division of Vector-Borne Infectious Diseases, National Center for Zoonotic, Vector-Borne, and Enteric Diseases (ArboNET Surveillance). Data for West Nile virus are available in Table II.
** Data for H. influenzae (all ages, all serotypes) are available in Table II.
†† Updated weekly from reports to the Influenza Division, National Center for Immunization and Respiratory Diseases. Since September 29, 2013, 28 influenza-associated pediatric deaths occurring during the 2013-14 influenza season have been reported.
§§ Of the four measles cases reported for the current week, three were indigenous and one was imported.
¶¶ Data for meningococcal disease (all serogroups) are available in Table II.
*** CDC discontinued reporting of individual confirmed and probable cases of influenza A (H1N1)pdm09 virus infections on July 24, 2009. During 2009, four cases of human infection with novel influenza A viruses, different from the influenza A (H1N1)pdm09 virus, were reported to CDC. The four cases of novel influenza A virus infection reported to CDC during 2010, the fourteen cases reported during 2011, the 313 cases reported in 2012, and the 21 cases reported during 2013 are different from the influenza A (H1N1)pdm09 virus. Total case counts are provided by the Influenza Division, National Center for Immunization and Respiratory Diseases (NCIRD).
††† No rubella cases were reported for the current week.
§§§ Updated weekly from reports to the Division of STD Prevention, National Center for HIV/AIDS, Viral Hepatitis, STD, and TB Prevention.
¶¶¶ There were no cases of viral hemorrhagic fever reported during the current week. See Table II for dengue hemorrhagic fever.
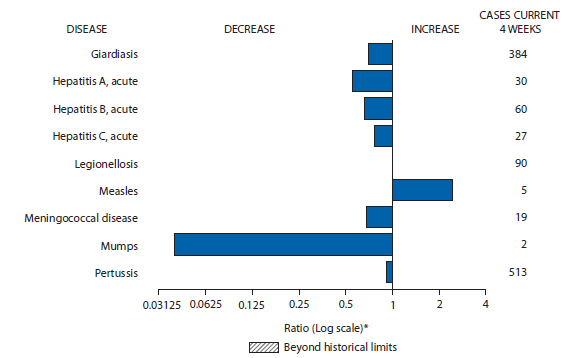
FIGURE I. Selected notifiable disease reports, United States, comparison of provisional 4-week totals January 18, 2014, with historical data
* Ratio of current 4-week total to mean of 15 4-week totals (from previous, comparable, and subsequent 4-week periods for the past 5 years). The point where the hatched area begins is based on the mean and two standard deviations of these 4-week totals.
Alternate Text: The figure above shows selected notifiable disease reports for the United States, with comparison of provisional 4-week totals through January 18, 2014, with historical data. Reports of legionellosis and measles increased. Reports of giardiasis, acute hepatitis A, acute hepatitis B, acute hepatitis C, meningococcal disease, mumps, and pertussis all decreased.
TABLE II. Provisional cases of selected notifiable diseases, United States, weeks ending January 18, 2014, and January 19, 2013 (3rd week)* (Export data)
Reporting area
Babesiosis
Chlamydia trachomatis infection
Coccidioidomycosis
Current week
Previous 52 weeks
Cum 2014
Cum 2013
Current week
Previous 52 weeks
Cum 2014
Cum 2013
Current week
Previous 52 weeks
Cum 2014
Cum 2013
Med
Max
Med
Max
Med
Max
United States
1
14
132
2
8
10,630
26,514
29,510
43,536
77,973
70
205
291
287
735
New England
1
3
69
2
6
510
915
1,163
1,395
2,824
—
0
1
—
1
Connecticut
—
1
33
—
2
—
231
379
151
699
N
0
0
N
N
Maine
1
0
6
1
—
—
65
110
—
171
N
0
0
N
N
Massachusetts
—
1
43
1
3
390
432
681
932
1,407
—
0
0
—
—
New Hampshire
—
0
1
—
1
2
59
81
5
192
—
0
1
—
1
Rhode Island
—
0
26
—
—
88
81
160
216
210
—
0
0
—
—
Vermont
—
0
1
—
—
30
33
111
91
145
N
0
0
N
N
Mid. Atlantic
—
7
56
—
1
2,405
3,409
3,733
7,176
8,774
—
0
0
—
—
New Jersey
—
0
24
—
1
232
558
628
1,058
1,664
N
0
0
N
N
New York (Upstate)
—
3
41
—
—
588
745
1,460
1,045
1,000
N
0
0
N
N
New York City
—
0
12
—
—
486
1,083
1,290
2,216
3,291
N
0
0
N
N
Pennsylvania
N
0
0
N
N
1,099
1,012
1,328
2,857
2,819
N
0
0
N
N
E.N. Central
—
0
11
—
—
1,204
3,889
4,698
4,291
11,861
—
0
2
1
3
Illinois
—
0
0
—
—
—
1,038
1,430
14
3,603
N
0
0
N
N
Indiana
—
0
1
—
—
165
564
792
691
1,529
N
0
0
N
N
Michigan
—
0
0
—
—
431
873
1,091
1,233
2,161
—
0
2
—
1
Ohio
N
0
0
N
N
376
1,027
1,186
1,443
3,198
—
0
2
1
—
Wisconsin
—
0
11
—
—
232
427
550
910
1,370
—
0
1
—
2
W.N. Central
—
0
1
—
—
198
1,509
1,753
1,431
4,422
—
1
7
—
—
Iowa
N
0
0
N
N
6
201
243
308
569
N
0
0
N
N
Kansas
N
0
0
N
N
—
211
255
73
583
N
0
0
N
N
Minnesota
—
0
0
—
—
—
315
421
—
1,118
—
1
5
—
—
Missouri
N
0
0
N
N
157
527
632
854
1,294
—
0
3
—
—
Nebraska
—
0
1
—
—
—
125
229
—
429
—
0
1
—
—
North Dakota
—
0
1
—
—
4
53
78
53
170
—
0
2
—
—
South Dakota
—
0
0
—
—
31
74
98
143
259
N
0
0
N
N
S. Atlantic
—
0
2
—
—
2,706
5,358
6,549
11,031
15,587
—
0
1
—
—
Delaware
—
0
1
—
—
42
89
220
122
419
—
0
1
—
—
District of Columbia
N
0
0
N
N
—
125
284
—
297
—
0
0
—
—
Florida
N
0
0
N
N
946
1,546
1,757
3,349
4,171
N
0
0
N
N
Georgia
N
0
0
N
N
1,010
913
1,200
2,375
2,725
N
0
0
N
N
Maryland
—
0
2
—
—
—
459
877
302
830
—
0
1
—
—
North Carolina
N
0
0
N
N
—
947
1,772
2,039
3,702
N
0
0
N
N
South Carolina
—
0
0
—
—
449
529
929
1,817
1,341
N
0
0
N
N
Virginia
N
0
0
N
N
259
625
940
909
1,852
N
0
0
N
N
West Virginia
—
0
1
—
—
—
99
129
118
250
N
0
0
N
N
E.S. Central
—
0
0
—
—
748
1,823
2,203
2,743
4,581
—
0
0
—
—
Alabama
—
0
0
—
—
—
557
874
447
1,422
N
0
0
N
N
Kentucky
N
0
0
N
N
278
327
570
863
734
N
0
0
N
N
Mississippi
N
0
0
N
N
268
326
729
825
997
N
0
0
N
N
Tennessee
—
0
0
—
—
202
577
841
608
1,428
N
0
0
N
N
W.S. Central
—
0
1
—
—
87
3,507
4,309
4,014
11,865
—
0
1
—
—
Arkansas
N
0
0
N
N
—
292
372
362
919
N
0
0
N
N
Louisiana
—
0
1
—
—
87
448
966
254
382
—
0
1
—
—
Oklahoma
N
0
0
N
N
—
277
599
184
3,153
N
0
0
N
N
Texas
N
0
0
N
N
—
2,506
3,002
3,214
7,411
N
0
0
N
N
Mountain
—
0
0
—
—
865
1,692
2,282
4,183
4,579
63
131
226
254
535
Arizona
N
0
0
N
N
—
518
939
1,540
1,256
63
128
223
253
532
Colorado
N
0
0
N
N
337
375
586
971
1,227
N
0
0
N
N
Idaho
N
0
0
N
N
91
103
233
241
165
N
0
0
N
N
Montana
—
0
0
—
—
46
75
104
176
199
—
0
1
—
—
Nevada
N
0
0
N
N
176
218
322
515
507
—
1
6
—
2
New Mexico
N
0
0
N
N
175
216
402
461
801
—
0
3
—
1
Utah
—
0
0
—
—
40
146
169
279
349
—
1
4
1
—
Wyoming
—
0
0
—
—
—
26
64
—
75
—
0
1
—
—
Pacific
—
0
2
—
1
1,907
4,255
5,096
7,272
13,480
7
62
90
32
196
Alaska
N
0
0
N
N
—
108
145
119
365
—
0
0
—
—
California
—
0
2
—
1
1,228
3,227
4,052
5,288
10,746
7
62
90
32
195
Hawaii
N
0
0
N
N
—
131
158
49
398
N
0
0
N
N
Oregon
—
0
0
—
—
299
283
475
822
611
—
0
1
—
1
Washington
—
0
0
—
—
380
462
582
994
1,360
N
0
0
N
N
Territories
American Samoa
N
—
—
N
N
—
—
—
—
—
N
—
—
N
N
C.N.M.I.
—
—
—
—
—
—
—
—
—
—
—
—
—
—
—
Guam
—
0
0
—
—
—
0
0
—
—
—
0
0
—
—
Puerto Rico
N
0
0
N
N
122
110
279
172
194
N
0
0
N
N
U.S. Virgin Islands
N
0
0
N
N
—
15
25
—
48
—
0
0
—
—
C.N.M.I.: Commonwealth of Northern Mariana Islands.
U: Unavailable. —: No reported cases. N: Not reportable. NN: Not Nationally Notifiable. Cum: Cumulative year-to-date counts. Med: Median. Max: Maximum.
TABLE II. (Continued) Provisional cases of selected notifiable diseases, United States, weeks ending January 18, 2014, and January 19, 2013 (3rd week)* (Export data)
Reporting area
Cryptosporidiosis
Dengue Virus Infection
Dengue Fever†
Dengue Hemorrhagic Fever§
Current week
Previous 52 weeks
Cum 2014
Cum 2013
Current week
Previous 52 weeks
Cum 2014
Cum 2013
Current week
Previous 52 weeks
Cum 2014
Cum 2013
Med
Max
Med
Max
Med
Max
United States
31
101
433
128
260
—
9
41
—
52
—
0
2
—
—
New England
—
4
14
8
8
—
0
3
—
4
—
0
0
—
—
Connecticut
—
0
5
1
3
—
0
2
—
2
—
0
0
—
—
Maine
—
0
4
—
—
—
0
0
—
—
—
0
0
—
—
Massachusetts
—
2
7
5
2
—
0
0
—
—
—
0
0
—
—
New Hampshire
—
1
2
—
1
—
0
0
—
1
—
0
0
—
—
Rhode Island
—
0
2
—
—
—
0
1
—
—
—
0
0
—
—
Vermont
—
0
2
2
2
—
0
1
—
1
—
0
0
—
—
Mid. Atlantic
2
12
42
12
29
—
2
11
—
15
—
0
1
—
—
New Jersey
—
1
5
—
4
—
0
0
—
—
—
0
0
—
—
New York (Upstate)
1
4
16
3
5
—
0
5
—
3
—
0
1
—
—
New York City
—
1
6
1
3
—
1
9
—
7
—
0
1
—
—
Pennsylvania
1
6
30
8
17
—
0
3
—
5
—
0
0
—
—
E.N. Central
6
25
63
24
64
—
1
4
—
3
—
0
0
—
—
Illinois
—
4
16
—
12
—
0
3
—
—
—
0
0
—
—
Indiana
—
2
7
—
9
—
0
1
—
1
—
0
0
—
—
Michigan
1
5
15
4
14
—
0
1
—
1
—
0
0
—
—
Ohio
3
7
17
11
12
—
0
2
—
1
—
0
0
—
—
Wisconsin
2
7
24
9
17
—
0
1
—
—
—
0
0
—
—
W.N. Central
2
16
171
12
33
—
1
3
—
3
—
0
1
—
—
Iowa
—
5
155
1
10
—
0
0
—
—
—
0
1
—
—
Kansas
—
2
6
1
1
—
0
1
—
1
—
0
0
—
—
Minnesota
—
0
0
—
—
—
0
2
—
2
—
0
0
—
—
Missouri
2
4
11
4
8
—
0
1
—
—
—
0
0
—
—
Nebraska
—
2
11
4
7
—
0
0
—
—
—
0
0
—
—
North Dakota
—
1
7
1
1
—
0
1
—
—
—
0
0
—
—
South Dakota
—
3
17
1
6
—
0
1
—
—
—
0
0
—
—
S. Atlantic
15
17
53
47
45
—
1
9
—
21
—
0
1
—
—
Delaware
—
0
2
—
—
—
0
1
—
—
—
0
0
—
—
District of Columbia
N
0
0
N
N
—
0
0
—
—
—
0
0
—
—
Florida
9
8
23
25
15
—
0
6
—
14
—
0
0
—
—
Georgia
3
4
16
11
12
—
0
2
—
—
—
0
0
—
—
Maryland
—
1
4
2
2
—
0
1
—
1
—
0
0
—
—
North Carolina
3
0
25
3
9
—
0
2
—
1
—
0
0
—
—
South Carolina
—
1
7
1
4
—
0
4
—
1
—
0
0
—
—
Virginia
—
0
6
5
—
—
0
3
—
4
—
0
1
—
—
West Virginia
—
0
2
—
3
—
0
1
—
—
—
0
0
—
—
E.S. Central
1
6
17
7
12
—
0
2
—
—
—
0
0
—
—
Alabama
1
2
8
5
8
—
0
2
—
—
—
0
0
—
—
Kentucky
—
1
5
1
1
—
0
0
—
—
—
0
0
—
—
Mississippi
—
1
5
—
2
—
0
1
—
—
—
0
0
—
—
Tennessee
—
1
6
1
1
—
0
2
—
—
—
0
0
—
—
W.S. Central
1
11
39
3
25
—
0
10
—
1
—
0
0
—
—
Arkansas
—
1
12
—
1
—
0
1
—
—
—
0
0
—
—
Louisiana
—
4
31
2
13
—
0
1
—
—
—
0
0
—
—
Oklahoma
—
1
4
—
3
—
0
2
—
—
—
0
0
—
—
Texas
1
5
21
1
8
—
0
10
—
1
—
0
0
—
—
Mountain
1
8
51
7
18
—
0
1
—
—
—
0
0
—
—
Arizona
—
1
6
1
2
—
0
0
—
—
—
0
0
—
—
Colorado
—
0
4
—
1
—
0
0
—
—
—
0
0
—
—
Idaho
1
2
16
3
2
—
0
1
—
—
—
0
0
—
—
Montana
—
1
19
1
—
—
0
1
—
—
—
0
0
—
—
Nevada
—
0
2
—
1
—
0
1
—
—
—
0
0
—
—
New Mexico
—
1
3
1
2
—
0
0
—
—
—
0
0
—
—
Utah
—
1
7
1
10
—
0
0
—
—
—
0
0
—
—
Wyoming
—
0
25
—
—
—
0
1
—
—
—
0
0
—
—
Pacific
3
9
75
8
26
—
2
8
—
5
—
0
0
—
—
Alaska
—
0
1
—
—
—
0
1
—
—
—
0
0
—
—
California
3
5
15
7
17
—
1
8
—
3
—
0
0
—
—
Hawaii
—
0
1
—
—
—
0
2
—
1
—
0
0
—
—
Oregon
—
3
58
1
9
—
0
0
—
—
—
0
0
—
—
Washington
—
1
12
—
—
—
0
2
—
1
—
0
0
—
—
Territories
American Samoa
N
—
—
N
N
—
—
—
—
—
—
—
—
—
—
C.N.M.I.
—
—
—
—
—
—
—
—
—
—
—
—
—
—
—
Guam
—
0
0
—
—
—
0
0
—
—
—
0
0
—
—
Puerto Rico
N
0
0
N
N
—
120
424
—
770
—
0
5
—
2
U.S. Virgin Islands
—
0
0
—
—
—
0
0
—
—
—
0
0
—
—
C.N.M.I.: Commonwealth of Northern Mariana Islands.
U: Unavailable. —: No reported cases. N: Not reportable. NN: Not Nationally Notifiable. Cum: Cumulative year-to-date counts. Med: Median. Max: Maximum.
† Dengue Fever includes cases that meet criteria for Dengue Fever with hemorrhage, other clinical and unknown case classifications.
§ DHF includes cases that meet criteria for dengue shock syndrome (DSS), a more severe form of DHF.
TABLE II. (Continued) Provisional cases of selected notifiable diseases, United States, weeks ending January 18, 2014, and January 19, 2013 (3rd week)* (Export data)
Reporting area
Ehrlichiosis/Anaplasmosis†
Ehrlichia chaffeensis
Anaplasma phagocytophilum
Undetermined
Current week
Previous 52 weeks
Cum 2014
Cum 2013
Current week
Previous 52 weeks
Cum 2014
Cum 2013
Current week
Previous 52 weeks
Cum 2014
Cum 2013
Med
Max
Med
Max
Med
Max
United States
—
13
90
1
5
—
25
86
2
6
—
2
22
—
—
New England
—
0
8
—
1
—
4
18
—
—
—
0
1
—
—
Connecticut
—
0
0
—
—
—
0
2
—
—
—
0
0
—
—
Maine
—
0
1
—
—
—
1
8
—
—
—
0
1
—
—
Massachusetts
—
0
0
—
—
—
0
0
—
—
—
0
0
—
—
New Hampshire
—
0
1
—
1
—
1
6
—
—
—
0
0
—
—
Rhode Island
—
0
8
—
—
—
0
14
—
—
—
0
0
—
—
Vermont
—
0
1
—
—
—
0
3
—
—
—
0
0
—
—
Mid. Atlantic
—
2
10
—
—
—
7
31
2
2
—
0
3
—
—
New Jersey
—
0
1
—
—
—
0
4
—
—
—
0
1
—
—
New York (Upstate)
—
1
9
—
—
—
7
28
2
1
—
0
3
—
—
New York City
—
0
5
—
—
—
0
4
—
1
—
0
1
—
—
Pennsylvania
—
0
1
—
—
—
0
0
—
—
—
0
0
—
—
E.N. Central
—
1
8
—
1
—
10
44
—
4
—
1
17
—
—
Illinois
—
0
7
—
—
—
0
2
—
1
—
0
0
—
—
Indiana
—
0
0
—
—
—
0
0
—
—
—
1
12
—
—
Michigan
—
0
0
—
—
—
0
0
—
—
—
0
3
—
—
Ohio
—
0
1
—
1
—
0
1
—
—
—
0
1
—
—
Wisconsin
—
0
6
—
—
—
10
43
—
3
—
0
5
—
—
W.N. Central
—
2
44
—
1
—
0
4
—
—
—
0
2
—
—
Iowa
N
0
0
N
N
N
0
0
N
N
N
0
0
N
N
Kansas
—
1
8
—
1
—
0
1
—
—
—
0
0
—
—
Minnesota
—
0
0
—
—
—
0
0
—
—
—
0
0
—
—
Missouri
—
1
39
—
—
—
0
2
—
—
—
0
2
—
—
Nebraska
—
0
1
—
—
—
0
1
—
—
—
0
0
—
—
North Dakota
—
0
0
—
—
—
0
2
—
—
—
0
1
—
—
South Dakota
—
0
1
—
—
—
0
0
—
—
—
0
0
—
—
S. Atlantic
—
1
22
1
1
—
0
3
—
—
—
0
2
—
—
Delaware
—
0
2
—
—
—
0
0
—
—
—
0
1
—
—
District of Columbia
N
0
0
N
N
N
0
0
N
N
N
0
0
N
N
Florida
—
0
3
—
—
—
0
1
—
—
—
0
0
—
—
Georgia
—
0
3
—
1
—
0
1
—
—
—
0
0
—
—
Maryland
—
0
5
1
—
—
0
1
—
—
—
0
1
—
—
North Carolina
—
0
12
—
—
—
0
3
—
—
—
0
0
—
—
South Carolina
—
0
1
—
—
—
0
0
—
—
—
0
0
—
—
Virginia
—
0
3
—
—
—
0
2
—
—
—
0
1
—
—
West Virginia
—
0
1
—
—
—
0
1
—
—
—
0
1
—
—
E.S. Central
—
1
14
—
1
—
0
1
—
—
—
0
3
—
—
Alabama
—
0
2
—
—
—
0
1
—
—
—
0
1
—
—
Kentucky
—
0
7
—
1
—
0
0
—
—
—
0
0
—
—
Mississippi
—
0
1
—
—
—
0
0
—
—
—
0
1
—
—
Tennessee
—
1
9
—
—
—
0
1
—
—
—
0
3
—
—
W.S. Central
—
2
37
—
—
—
0
1
—
—
—
0
0
—
—
Arkansas
—
2
17
—
—
—
0
1
—
—
—
0
0
—
—
Louisiana
—
0
1
—
—
—
0
1
—
—
—
0
0
—
—
Oklahoma
—
0
34
—
—
—
0
1
—
—
—
0
0
—
—
Texas
—
0
1
—
—
—
0
0
—
—
—
0
0
—
—
Mountain
—
0
1
—
—
—
0
1
—
—
—
0
1
—
—
Arizona
—
0
0
—
—
—
0
0
—
—
—
0
1
—
—
Colorado
N
0
0
N
N
N
0
0
N
N
N
0
0
N
N
Idaho
N
0
0
N
N
N
0
0
N
N
N
0
0
N
N
Montana
—
0
0
—
—
—
0
0
—
—
—
0
0
—
—
Nevada
—
0
0
—
—
—
0
1
—
—
—
0
0
—
—
New Mexico
N
0
0
N
N
N
0
0
N
N
N
0
0
N
N
Utah
—
0
1
—
—
—
0
0
—
—
—
0
0
—
—
Wyoming
—
0
0
—
—
—
0
0
—
—
—
0
0
—
—
Pacific
—
0
0
—
—
—
0
0
—
—
—
0
1
—
—
Alaska
N
0
0
N
N
N
0
0
N
N
N
0
0
N
N
California
—
0
0
—
—
—
0
0
—
—
—
0
1
—
—
Hawaii
N
0
0
N
N
N
0
0
N
N
N
0
0
N
N
Oregon
—
0
0
—
—
—
0
0
—
—
—
0
0
—
—
Washington
—
0
0
—
—
—
0
0
—
—
—
0
0
—
—
Territories
American Samoa
N
—
—
N
N
N
—
—
N
N
N
—
—
N
N
C.N.M.I.
—
—
—
—
—
—
—
—
—
—
—
—
—
—
—
Guam
N
0
0
N
N
N
0
0
N
N
N
0
0
N
N
Puerto Rico
N
0
0
N
N
N
0
0
N
N
N
0
0
N
N
U.S. Virgin Islands
—
0
0
—
—
—
0
0
—
—
—
0
0
—
—
C.N.M.I.: Commonwealth of Northern Mariana Islands.
U: Unavailable. —: No reported cases. N: Not reportable. NN: Not Nationally Notifiable. Cum: Cumulative year-to-date counts. Med: Median. Max: Maximum.
† Cumulative total E. ewingii cases reported for year 2013 = 22, and 0 cases reported for 2013.
TABLE II. (Continued) Provisional cases of selected notifiable diseases, United States, weeks ending January 18, 2014, and January 19, 2013 (3rd week)* (Export data)
Reporting area
Giardiasis
Gonorrhea
Haemophilus influenzae, invasive† All ages, all serotypes
Current week
Previous 52 weeks
Cum 2014
Cum 2013
Current week
Previous 52 weeks
Cum 2014
Cum 2013
Current week
Previous 52 weeks
Cum 2014
Cum 2013
Med
Max
Med
Max
Med
Max
United States
113
235
404
340
622
2,474
6,233
6,951
10,903
19,096
34
63
99
149
284
New England
14
23
58
34
63
106
127
192
226
330
3
4
9
11
20
Connecticut
—
5
11
—
7
1
52
104
2
124
—
1
4
—
2
Maine
5
4
12
7
9
—
4
13
—
25
—
0
2
—
4
Massachusetts
8
11
26
21
40
88
59
100
199
149
2
2
6
9
12
New Hampshire
—
1
7
1
2
8
2
6
13
12
—
0
3
1
1
Rhode Island
—
0
7
—
1
8
5
40
9
16
—
0
8
—
—
Vermont
1
2
14
5
4
1
1
8
3
4
1
0
1
1
1
Mid. Atlantic
32
48
89
77
97
519
771
914
1,698
2,130
6
11
22
27
48
New Jersey
—
5
12
—
10
50
134
167
232
436
—
2
5
5
15
New York (Upstate)
18
18
51
19
21
81
122
248
158
179
2
3
15
8
5
New York City
5
14
24
23
32
110
253
311
520
824
—
2
7
—
12
Pennsylvania
9
13
27
35
34
278
271
326
788
691
4
4
11
14
16
E.N. Central
12
37
62
37
94
338
978
1,235
1,192
3,305
2
11
17
19
47
Illinois
—
6
23
—
19
—
256
375
6
980
—
3
6
1
12
Indiana
—
3
11
—
10
38
145
208
163
388
—
3
6
2
10
Michigan
—
10
27
5
20
132
195
276
334
642
—
2
5
2
5
Ohio
9
9
25
21
23
115
313
379
508
1,007
2
3
8
14
11
Wisconsin
3
7
15
11
22
53
81
122
181
288
—
1
4
—
9
W.N. Central
4
16
41
22
47
53
327
416
346
960
2
5
9
15
22
Iowa
—
4
15
6
7
—
28
41
41
100
—
0
0
—
—
Kansas
—
2
6
2
5
—
39
66
20
86
—
0
3
—
3
Minnesota
—
0
0
—
—
—
67
87
—
232
—
1
5
—
5
Missouri
2
5
15
9
17
51
152
184
268
406
2
2
6
14
11
Nebraska
2
3
9
5
10
—
24
49
—
82
—
0
3
1
2
North Dakota
—
0
3
—
2
2
8
15
7
20
—
0
2
—
1
South Dakota
—
2
9
—
6
—
15
27
10
34
—
0
1
—
—
S. Atlantic
30
44
91
101
108
723
1,368
1,758
3,129
4,234
18
17
33
50
71
Delaware
—
0
2
—
1
26
25
65
59
74
—
0
2
—
1
District of Columbia
—
0
3
—
5
—
47
85
—
89
—
0
2
—
2
Florida
22
20
56
56
66
222
392
493
950
1,195
11
5
13
27
15
Georgia
2
10
44
21
12
274
249
328
638
809
—
2
8
6
19
Maryland
3
5
9
15
14
—
109
174
102
201
3
2
5
7
10
North Carolina
N
0
0
N
N
—
264
544
567
1,025
4
3
12
10
5
South Carolina
1
2
7
4
7
136
145
280
592
403
—
2
7
—
18
Virginia
2
1
10
5
—
65
124
237
184
394
—
0
4
—
—
West Virginia
—
1
4
—
3
—
20
34
37
44
—
0
3
—
1
E.S. Central
1
3
8
4
6
208
472
632
706
1,443
1
4
12
9
25
Alabama
1
3
8
4
6
—
152
257
120
458
1
1
4
4
13
Kentucky
N
0
0
N
N
98
85
143
236
197
—
1
4
—
3
Mississippi
N
0
0
N
N
70
98
185
224
354
—
0
2
2
2
Tennessee
N
0
0
N
N
40
143
210
126
434
—
2
6
3
7
W.S. Central
2
6
15
8
8
32
949
1,170
1,159
3,330
1
3
11
6
8
Arkansas
2
2
7
4
1
—
73
108
142
295
1
0
3
2
—
Louisiana
—
4
11
4
7
32
135
326
76
101
—
0
6
1
5
Oklahoma
—
0
0
—
—
—
82
177
60
833
—
2
9
3
3
Texas
N
0
0
N
N
—
655
824
881
2,101
—
0
1
—
—
Mountain
—
17
37
14
48
96
266
395
665
756
—
5
14
8
31
Arizona
—
2
7
—
4
—
106
179
271
299
—
2
7
2
14
Colorado
—
3
18
3
16
45
53
88
146
193
—
1
4
1
9
Idaho
—
2
9
3
2
—
3
14
5
9
—
0
2
1
2
Montana
—
2
6
2
1
—
4
10
8
10
—
0
1
1
—
Nevada
—
1
6
1
6
33
52
85
133
122
—
0
1
—
2
New Mexico
—
2
6
—
5
8
37
78
44
87
—
1
3
—
3
Utah
—
4
9
5
8
10
19
31
58
36
—
1
2
3
1
Wyoming
—
0
6
—
6
—
1
3
—
—
—
0
1
—
—
Pacific
18
48
118
43
151
399
891
1,086
1,782
2,608
1
3
9
4
12
Alaska
—
1
7
2
1
—
20
39
41
55
—
0
3
—
—
California
17
28
94
33
121
277
745
932
1,429
2,137
—
1
5
1
2
Hawaii
—
0
3
—
1
—
13
26
10
61
—
0
2
—
1
Oregon
1
6
17
8
26
50
33
55
115
116
1
1
5
3
9
Washington
—
10
20
—
2
72
80
113
187
239
—
0
2
—
—
Territories
American Samoa
—
—
—
—
—
—
—
—
—
—
—
—
—
—
—
C.N.M.I.
—
—
—
—
—
—
—
—
—
—
—
—
—
—
—
Guam
—
0
0
—
—
—
0
0
—
—
—
0
0
—
—
Puerto Rico
—
0
4
—
—
—
6
21
7
13
—
0
0
—
—
U.S. Virgin Islands
—
0
0
—
—
—
1
5
—
3
—
0
0
—
—
C.N.M.I.: Commonwealth of Northern Mariana Islands.
U: Unavailable. —: No reported cases. N: Not reportable. NN: Not Nationally Notifiable. Cum: Cumulative year-to-date counts. Med: Median. Max: Maximum.
† Data for H. influenzae (age <5 yrs for serotype b, nonserotype b, and unknown serotype) are available in Table I.
TABLE II. (Continued) Provisional cases of selected notifiable diseases, United States, weeks ending January 18, 2014, and January 19, 2013 (3rd week)* (Export data)
Reporting area
Hepatitis (viral, acute), by type
A
B
C
Current week
Previous 52 weeks
Cum 2014
Cum 2013
Current week
Previous 52 weeks
Cum 2014
Cum 2013
Current week
Previous 52 weeks
Cum 2014
Cum 2013
Med
Max
Med
Max
Med
Max
United States
8
30
56
25
58
21
54
73
64
126
4
33
53
18
74
New England
—
1
5
1
4
—
1
4
—
2
—
3
7
—
13
Connecticut
—
0
2
—
1
—
0
1
—
—
—
0
0
—
—
Maine
—
0
2
—
—
—
0
1
—
1
—
0
1
—
—
Massachusetts
—
0
3
—
2
—
1
3
—
1
—
3
7
—
13
New Hampshire
—
0
1
—
—
—
0
2
—
—
N
0
0
N
N
Rhode Island
—
0
1
—
—
U
0
0
U
U
U
0
0
U
U
Vermont
—
0
2
1
1
—
0
1
—
—
—
0
1
—
—
Mid. Atlantic
2
4
12
4
6
2
3
10
11
11
1
4
11
3
10
New Jersey
—
0
2
—
2
—
0
3
—
3
—
0
3
—
5
New York (Upstate)
—
1
5
1
1
1
1
3
1
1
—
2
7
—
1
New York City
1
1
7
2
3
—
1
4
3
5
—
0
1
—
1
Pennsylvania
1
1
4
1
—
1
1
4
7
2
1
1
6
3
3
E.N. Central
—
5
12
3
19
1
9
15
7
19
—
7
23
4
10
Illinois
—
1
5
—
4
—
1
4
—
4
—
0
4
—
1
Indiana
—
0
2
—
2
—
2
6
—
4
—
2
8
—
6
Michigan
—
1
7
—
5
—
1
5
—
2
—
1
11
1
3
Ohio
—
1
4
3
8
1
4
8
7
9
—
0
17
3
—
Wisconsin
—
1
3
—
—
—
0
2
—
—
—
1
3
—
—
W.N. Central
1
1
6
2
2
—
2
5
1
3
—
0
5
1
1
Iowa
—
0
3
—
1
—
0
2
—
1
—
0
0
—
—
Kansas
—
0
3
—
1
—
0
3
—
—
—
0
3
—
—
Minnesota
—
0
0
—
—
—
0
0
—
—
—
0
0
—
—
Missouri
1
0
2
1
—
—
1
4
1
2
—
0
4
1
1
Nebraska
—
0
2
1
—
—
0
2
—
—
—
0
1
—
—
North Dakota
—
0
2
—
—
—
0
0
—
—
—
0
1
—
—
South Dakota
—
0
1
—
—
—
0
1
—
—
—
0
1
—
—
S. Atlantic
4
5
15
6
4
12
16
26
30
37
2
6
21
3
14
Delaware
—
0
1
—
—
—
0
1
—
—
U
0
0
U
U
District of Columbia
—
0
0
—
—
—
0
0
—
—
—
0
0
—
—
Florida
1
2
7
2
1
9
6
13
17
15
1
2
7
2
3
Georgia
2
1
4
2
1
—
2
6
1
2
—
0
3
—
2
Maryland
—
0
4
1
1
1
1
4
1
2
—
1
3
—
4
North Carolina
—
1
4
—
1
—
0
16
2
3
—
0
15
—
2
South Carolina
—
0
1
—
—
1
1
5
1
3
—
0
0
—
—
Virginia
1
0
2
1
—
1
0
4
2
—
1
0
3
1
—
West Virginia
—
0
1
—
—
—
3
8
6
12
—
0
5
—
3
E.S. Central
—
1
4
2
5
5
12
17
12
34
—
6
14
4
17
Alabama
—
0
2
1
—
1
1
5
3
4
—
0
5
1
—
Kentucky
—
0
2
—
3
1
4
8
1
10
—
3
10
—
13
Mississippi
—
0
1
—
—
—
1
4
—
4
U
0
0
U
U
Tennessee
—
0
2
1
2
3
5
11
8
16
—
2
7
3
4
W.S. Central
—
2
6
2
2
1
5
10
2
7
—
2
7
—
2
Arkansas
—
0
2
—
—
—
1
3
1
1
—
0
3
—
—
Louisiana
—
0
2
—
2
—
1
8
—
3
—
0
2
—
2
Oklahoma
—
0
4
—
—
—
0
4
—
1
—
0
5
—
—
Texas
—
2
5
2
—
1
3
6
1
2
—
0
2
—
—
Mountain
—
2
16
2
7
—
1
4
—
4
—
1
5
1
1
Arizona
—
1
6
1
6
—
0
3
—
—
U
0
0
U
U
Colorado
—
0
8
—
1
—
0
1
—
1
—
0
1
1
—
Idaho
—
0
2
—
—
—
0
2
—
1
—
0
2
—
—
Montana
—
0
1
—
—
—
0
1
—
—
—
0
2
—
1
Nevada
—
0
3
—
—
—
0
3
—
2
—
0
2
—
—
New Mexico
—
0
2
—
—
—
0
1
—
—
—
0
1
—
—
Utah
—
0
2
1
—
—
0
1
—
—
—
0
1
—
—
Wyoming
—
0
0
—
—
—
0
0
—
—
—
0
0
—
—
Pacific
1
6
18
3
9
—
3
6
1
9
1
2
7
2
6
Alaska
—
0
1
—
—
—
0
1
—
—
—
0
0
—
—
California
—
4
17
2
7
—
2
5
1
8
1
1
5
2
6
Hawaii
—
0
4
—
1
—
0
1
—
—
—
0
0
—
—
Oregon
1
0
3
1
1
—
0
4
—
1
—
0
1
—
—
Washington
—
0
4
—
—
—
0
4
—
—
—
1
4
—
—
Territories
American Samoa
—
—
—
—
—
—
—
—
—
—
—
—
—
—
—
C.N.M.I.
—
—
—
—
—
—
—
—
—
—
—
—
—
—
—
Guam
—
0
0
—
—
—
0
0
—
—
—
0
0
—
—
Puerto Rico
—
0
1
—
—
—
0
6
—
2
N
0
0
N
N
U.S. Virgin Islands
—
0
0
—
—
—
0
0
—
—
—
0
0
—
—
C.N.M.I.: Commonwealth of Northern Mariana Islands.
U: Unavailable. —: No reported cases. N: Not reportable. NN: Not Nationally Notifiable. Cum: Cumulative year-to-date counts. Med: Median. Max: Maximum.
TABLE II. (Continued) Provisional cases of selected notifiable diseases, United States, weeks ending January 18, 2014, and January 19, 2013 (3rd week)* (Export data)
Reporting area
Invasive Pneumococcal disease†
Legionellosis
All ages
Age <5
Current week
Previous 52 weeks
Cum 2014
Cum 2013
Current week
Previous 52 weeks
Cum 2014
Cum 2013
Current week
Previous 52 weeks
Cum 2014
Cum 2013
Med
Max
Med
Max
Med
Max
United States
175
289
539
802
1,681
6
20
35
28
69
29
59
258
102
163
New England
2
11
33
13
75
—
0
3
—
2
2
5
25
11
11
Connecticut
—
4
14
2
47
—
0
2
—
—
—
1
10
3
1
Maine
—
2
6
9
11
—
0
1
—
—
—
0
3
1
1
Massachusetts
—
0
2
—
2
—
0
2
—
2
2
2
20
6
7
New Hampshire
—
1
5
—
4
—
0
1
—
—
—
0
3
—
—
Rhode Island
—
0
18
—
—
—
0
0
—
—
—
0
9
1
—
Vermont
2
1
6
2
11
—
0
0
—
—
—
0
2
—
2
Mid. Atlantic
23
38
82
87
238
—
2
6
2
11
4
16
122
24
24
New Jersey
—
8
21
—
74
—
0
2
—
6
—
2
20
—
6
New York (Upstate)
17
19
37
42
77
—
1
4
1
2
2
6
40
8
5
New York City
6
12
27
45
87
—
0
2
1
3
—
3
47
6
3
Pennsylvania
N
—
—
N
N
N
0
0
N
N
2
6
26
10
10
E.N. Central
37
53
107
147
362
3
3
8
4
7
6
16
103
25
29
Illinois
N
0
0
N
N
—
1
3
—
—
—
3
31
—
4
Indiana
—
12
28
3
67
—
0
3
—
—
—
3
11
—
9
Michigan
3
12
28
30
78
—
1
3
1
3
—
3
21
2
—
Ohio
27
21
47
87
157
3
1
4
3
3
6
6
66
23
15
Wisconsin
7
8
15
27
60
—
0
3
—
1
—
1
11
—
1
W.N. Central
1
14
50
20
132
—
1
4
1
10
—
2
13
3
8
Iowa
N
0
0
N
N
N
0
0
N
N
—
0
2
—
—
Kansas
—
2
11
5
23
N
0
0
N
N
—
0
3
—
1
Minnesota
—
4
24
—
69
—
0
3
—
3
—
0
2
—
3
Missouri
N
0
0
N
N
—
0
3
—
4
—
1
11
2
3
Nebraska
—
3
7
10
11
—
0
1
1
2
—
0
3
—
1
North Dakota
—
1
5
—
13
—
0
1
—
1
—
0
1
—
—
South Dakota
1
2
5
5
16
N
0
0
N
N
—
0
1
1
—
S. Atlantic
60
64
128
258
388
2
5
13
12
17
14
10
36
28
24
Delaware
—
0
3
1
2
—
0
1
—
—
—
0
4
—
—
District of Columbia
2
1
7
2
4
—
0
1
—
—
N
0
0
N
N
Florida
32
18
42
101
133
—
1
5
4
8
11
4
16
14
11
Georgia
2
16
44
60
117
—
1
5
4
5
—
1
5
1
3
Maryland
17
8
26
37
45
2
0
4
3
1
1
2
14
6
6
North Carolina
—
0
0
—
—
N
0
0
N
N
1
1
9
2
3
South Carolina
7
7
27
50
49
—
0
2
1
1
—
0
3
2
1
Virginia
—
0
1
—
—
—
0
1
—
—
1
0
8
3
—
West Virginia
—
5
16
7
38
—
0
2
—
2
—
0
4
—
—
E.S. Central
22
27
59
96
143
1
2
5
5
7
—
3
13
—
8
Alabama
1
3
9
15
22
—
0
2
—
2
—
0
10
—
1
Kentucky
6
4
12
17
27
—
0
1
1
—
—
1
4
—
—
Mississippi
10
4
13
25
21
1
0
2
3
2
—
0
2
—
2
Tennessee
5
14
37
39
73
—
1
5
1
3
—
1
7
—
5
W.S. Central
9
33
169
42
117
—
3
12
2
6
—
3
9
—
4
Arkansas
—
3
15
2
13
—
0
2
—
—
—
0
3
—
—
Louisiana
—
5
14
9
31
—
0
2
2
2
—
0
3
—
2
Oklahoma
—
0
1
—
1
—
0
1
—
1
—
0
3
—
—
Texas
9
23
152
31
72
—
2
12
—
3
—
2
9
—
2
Mountain
21
31
78
134
215
—
2
7
2
8
—
3
9
3
11
Arizona
18
14
41
84
98
—
0
4
2
4
—
1
4
1
5
Colorado
—
6
22
21
52
—
0
2
—
3
—
0
3
—
1
Idaho
N
0
0
N
N
—
0
1
—
—
—
0
2
—
1
Montana
—
0
3
2
2
—
0
1
—
—
—
0
2
—
1
Nevada
—
2
7
8
11
—
0
1
—
—
—
0
3
—
—
New Mexico
3
5
13
18
34
—
0
1
—
—
—
0
2
—
1
Utah
—
2
7
—
16
—
0
2
—
1
—
0
3
2
2
Wyoming
—
0
3
1
2
—
0
1
—
—
—
0
0
—
—
Pacific
—
3
7
5
11
—
0
2
—
1
3
5
12
8
44
Alaska
—
2
6
1
9
—
0
2
—
1
—
0
1
—
—
California
N
0
0
N
N
N
0
0
N
N
3
4
11
7
41
Hawaii
—
1
4
4
2
—
0
1
—
—
—
0
1
—
1
Oregon
N
0
0
N
N
N
0
0
N
N
—
0
3
1
2
Washington
N
0
0
N
N
N
0
0
N
N
—
0
6
—
—
Territories
American Samoa
N
—
—
N
N
—
—
—
—
—
N
—
—
N
N
C.N.M.I.
—
—
—
—
—
—
—
—
—
—
—
—
—
—
—
Guam
—
0
0
—
—
—
0
0
—
—
—
0
0
—
—
Puerto Rico
—
0
0
—
—
—
0
0
—
—
—
0
2
—
1
U.S. Virgin Islands
—
0
0
—
—
—
0
0
—
—
—
0
0
—
—
C.N.M.I.: Commonwealth of Northern Mariana Islands.
U: Unavailable. —: No reported cases. N: Not reportable. NN: Not Nationally Notifiable. Cum: Cumulative year-to-date counts. Med: Median. Max: Maximum.
† Includes drug resistant and susceptible cases of Invasive Pneumococcal Disease. This condition was previously named Streptococcus pneumoniae invasive disease and cases were reported to CDC using different event codes to specify whether the cases were drug resistant or in a defined age group, such as <5 years. Since 2010, case notifications for this condition were consolidated under one event code for Invasive pneumococcal disease
TABLE II. (Continued) Provisional cases of selected notifiable diseases, United States, weeks ending January 18, 2014, and January 19, 2013 (3rd week)* (Export data)
Reporting area
Lyme disease
Malaria
Meningococcal disease, invasive† All serogroups
Current week
Previous 52 weeks
Cum 2014
Cum 2013
Current week
Previous 52 weeks
Cum 2014
Cum 2013
Current week
Previous 52 weeks
Cum 2014
Cum 2013
Med
Max
Med
Max
Med
Max
United States
21
341
2,168
105
658
8
24
48
30
52
2
9
21
18
47
New England
—
118
878
3
206
—
2
8
1
6
—
0
3
—
3
Connecticut
—
29
246
1
83
—
0
0
—
—
—
0
1
—
1
Maine
—
15
99
—
11
—
0
2
1
—
—
0
1
—
—
Massachusetts
—
36
437
2
84
—
1
4
—
4
—
0
3
—
2
New Hampshire
—
6
91
—
20
—
0
2
—
2
—
0
1
—
—
Rhode Island
—
9
54
—
1
—
0
8
—
—
—
0
1
—
—
Vermont
—
8
92
—
7
—
0
3
—
—
—
0
1
—
—
Mid. Atlantic
17
171
1,004
80
310
3
8
21
9
9
—
1
7
—
4
New Jersey
—
46
224
3
138
—
1
5
—
1
—
0
2
—
2
New York (Upstate)
10
46
257
14
9
1
1
5
1
1
—
0
3
—
1
New York City
—
1
39
—
1
—
4
13
6
7
—
0
2
—
1
Pennsylvania
7
77
540
63
162
2
1
5
2
—
—
0
3
—
—
E.N. Central
—
16
219
2
17
1
2
8
4
8
—
0
4
—
3
Illinois
—
2
30
—
1
—
1
5
—
4
—
0
2
—
1
Indiana
—
1
13
—
—
—
0
2
—
—
—
0
1
—
2
Michigan
—
2
15
2
2
—
0
2
1
2
—
0
1
—
—
Ohio
—
1
7
—
1
1
0
3
3
1
—
0
2
—
—
Wisconsin
—
12
179
—
13
—
0
3
—
1
—
0
1
—
—
W.N. Central
1
3
31
1
—
—
0
3
3
3
—
0
3
1
6
Iowa
—
2
27
—
—
—
0
2
—
—
—
0
1
—
—
Kansas
—
0
4
—
—
—
0
1
—
—
—
0
1
—
—
Minnesota
—
0
0
—
—
—
0
0
—
—
—
0
2
—
3
Missouri
—
0
3
—
—
—
0
1
1
1
—
0
2
1
2
Nebraska
1
0
2
1
—
—
0
2
1
1
—
0
1
—
—
North Dakota
—
0
5
—
—
—
0
1
1
1
—
0
1
—
—
South Dakota
—
0
1
—
—
—
0
3
—
—
—
0
1
—
1
S. Atlantic
3
36
124
18
117
4
5
16
7
16
1
1
6
7
9
Delaware
1
7
23
8
17
—
0
1
—
—
—
0
1
—
—
District of Columbia
N
0
0
N
N
—
0
2
—
1
—
0
1
—
—
Florida
2
2
14
3
4
1
1
3
2
4
—
1
3
3
4
Georgia
—
0
4
—
—
—
1
5
—
3
—
0
2
—
1
Maryland
—
18
76
5
93
2
2
10
4
8
1
0
1
1
—
North Carolina
—
0
32
—
—
—
0
6
—
—
—
0
2
2
3
South Carolina
—
0
2
—
—
—
0
2
—
—
—
0
1
—
—
Virginia
—
2
90
—
1
1
0
4
1
—
—
0
1
1
—
West Virginia
—
2
19
2
2
—
0
1
—
—
—
0
1
—
1
E.S. Central
—
1
9
1
3
—
1
4
2
3
—
0
2
1
3
Alabama
—
0
3
—
1
—
0
1
—
—
—
0
1
—
—
Kentucky
—
0
9
1
1
—
0
1
—
2
—
0
1
—
1
Mississippi
—
0
0
—
—
—
0
1
—
—
—
0
1
—
2
Tennessee
—
0
3
—
1
—
0
3
2
1
—
0
1
1
—
W.S. Central
—
1
5
—
—
—
1
7
—
1
—
1
3
1
—
Arkansas
—
0
0
—
—
—
0
1
—
—
—
0
1
—
—
Louisiana
—
0
0
—
—
—
0
1
—
1
—
0
1
1
—
Oklahoma
—
0
1
—
—
—
0
3
—
—
—
0
2
—
—
Texas
—
1
5
—
—
—
1
5
—
—
—
0
3
—
—
Mountain
—
2
9
—
—
—
1
6
—
3
—
0
4
—
2
Arizona
—
0
3
—
—
—
0
3
—
2
—
0
3
—
—
Colorado
—
0
0
—
—
—
0
2
—
—
—
0
1
—
1
Idaho
—
0
3
—
—
—
0
1
—
—
—
0
1
—
—
Montana
—
0
3
—
—
—
0
0
—
—
—
0
1
—
—
Nevada
—
0
2
—
—
—
0
1
—
1
—
0
1
—
—
New Mexico
—
0
3
—
—
—
0
0
—
—
—
0
1
—
—
Utah
—
0
3
—
—
—
0
2
—
—
—
0
2
—
—
Wyoming
—
0
1
—
—
—
0
0
—
—
—
0
1
—
1
Pacific
—
3
8
—
5
—
2
8
4
3
1
2
8
8
17
Alaska
—
0
4
—
1
—
0
1
—
—
—
0
0
—
—
California
—
1
6
—
3
—
1
7
4
3
1
2
7
2
16
Hawaii
N
0
0
N
N
—
0
1
—
—
—
0
1
—
—
Oregon
—
1
3
—
1
—
0
1
—
—
—
0
3
6
1
Washington
—
0
2
—
—
—
0
3
—
—
—
0
5
—
—
Territories
American Samoa
N
—
—
N
N
—
—
—
—
—
—
—
—
—
—
C.N.M.I.
—
—
—
—
—
—
—
—
—
—
—
—
—
—
—
Guam
—
0
0
—
—
—
0
0
—
—
—
0
0
—
—
Puerto Rico
N
0
0
N
N
—
0
0
—
—
—
0
0
—
—
U.S. Virgin Islands
N
0
0
N
N
—
0
0
—
—
—
0
0
—
—
C.N.M.I.: Commonwealth of Northern Mariana Islands.
U: Unavailable. —: No reported cases. N: Not reportable. NN: Not Nationally Notifiable. Cum: Cumulative year-to-date counts. Med: Median. Max: Maximum.
† Data for meningococcal disease, invasive caused by serogroups A, C, Y, and W-135; serogroup B; other serogroup; and unknown serogroup are available in Table I.
TABLE II. (Continued) Provisional cases of selected notifiable diseases, United States, weeks ending January 18, 2014, and January 19, 2013 (3rd week)* (Export data)
Reporting area
Mumps
Pertussis
Rabies, animal
Current week
Previous 52 weeks
Cum 2014
Cum 2013
Current week
Previous 52 weeks
Cum 2014
Cum 2013
Current week
Previous 52 weeks
Cum 2014
Cum 2013
Med
Max
Med
Max
Med
Max
United States
2
6
45
3
12
138
485
635
558
1,242
16
62
130
49
150
New England
—
0
24
—
—
—
18
40
7
101
1
6
12
6
11
Connecticut
—
0
2
—
—
—
1
6
—
4
—
3
12
3
5
Maine
—
0
1
—
—
—
5
12
7
28
—
1
4
1
2
Massachusetts
—
0
24
—
—
—
6
24
—
14
—
0
0
—
—
New Hampshire
—
0
0
—
—
—
1
9
—
10
—
0
3
—
1
Rhode Island
—
0
1
—
—
—
1
16
—
14
—
0
4
—
—
Vermont
—
0
1
—
—
—
1
8
—
31
1
1
4
2
3
Mid. Atlantic
—
1
20
1
4
18
32
66
51
163
10
6
19
15
17
New Jersey
—
0
19
—
—
—
5
13
—
50
—
0
0
—
—
New York (Upstate)
—
0
2
—
—
10
13
35
17
47
10
6
19
15
17
New York City
—
0
4
1
2
—
2
10
1
8
—
0
0
—
—
Pennsylvania
—
0
5
—
2
8
12
23
33
58
—
0
0
—
—
E.N. Central
2
1
6
2
3
58
89
174
226
287
—
2
24
—
3
Illinois
—
0
4
—
2
—
13
32
5
53
—
1
6
—
2
Indiana
—
0
1
—
—
—
9
28
—
27
—
0
1
—
—
Michigan
—
0
1
—
1
9
18
33
34
30
—
0
5
—
1
Ohio
2
0
2
2
—
49
24
104
184
43
—
0
19
—
—
Wisconsin
—
0
1
—
—
—
20
52
3
134
N
0
0
N
N
W.N. Central
—
0
2
—
—
8
40
87
37
146
—
2
9
2
6
Iowa
—
0
1
—
—
—
4
12
—
34
—
0
0
—
—
Kansas
—
0
0
—
—
—
6
20
—
13
—
1
5
1
4
Minnesota
—
0
1
—
—
—
11
36
—
55
—
0
0
—
—
Missouri
—
0
2
—
—
5
10
33
18
26
—
1
3
1
2
Nebraska
—
0
0
—
—
3
4
13
17
14
—
0
0
—
—
North Dakota
—
0
1
—
—
—
1
7
1
2
—
0
0
—
—
South Dakota
—
0
0
—
—
—
1
8
1
2
—
0
4
—
—
S. Atlantic
—
0
26
—
—
37
42
92
115
73
1
17
44
14
100
Delaware
—
0
0
—
—
—
0
3
1
3
—
0
0
—
—
District of Columbia
—
0
1
—
—
—
0
4
—
1
—
0
0
—
—
Florida
—
0
1
—
—
26
13
63
53
11
1
0
27
8
64
Georgia
—
0
3
—
—
2
5
11
14
18
—
0
0
—
—
Maryland
—
0
26
—
—
1
3
10
6
13
—
7
17
5
12
North Carolina
—
0
1
—
—
8
11
29
36
6
—
0
0
—
—
South Carolina
—
0
1
—
—
—
4
11
2
19
—
0
0
—
—
Virginia
—
0
2
—
—
—
1
16
3
—
—
8
15
—
21
West Virginia
—
0
0
—
—
—
0
2
—
2
—
1
6
1
3
E.S. Central
—
0
3
—
2
2
15
35
29
57
—
1
7
2
2
Alabama
—
0
1
—
1
—
3
8
4
11
—
0
6
1
2
Kentucky
—
0
0
—
1
—
7
26
12
27
—
0
3
1
—
Mississippi
—
0
0
—
—
—
1
4
1
5
—
0
2
—
—
Tennessee
—
0
3
—
—
2
4
10
12
14
—
0
0
—
—
W.S. Central
—
0
3
—
1
—
82
196
2
15
4
17
75
10
9
Arkansas
—
0
1
—
—
—
8
16
1
3
—
0
34
—
—
Louisiana
—
0
1
—
1
—
3
11
—
3
—
0
0
—
—
Oklahoma
—
0
1
—
—
—
0
36
—
—
—
0
31
2
—
Texas
—
0
3
—
—
—
68
184
1
9
4
15
38
8
9
Mountain
—
0
2
—
1
11
95
174
75
271
—
0
9
—
—
Arizona
—
0
1
—
—
7
22
69
12
67
N
0
0
N
N
Colorado
—
0
1
—
—
—
20
45
45
73
—
0
0
—
—
Idaho
—
0
0
—
—
3
4
10
8
9
—
0
4
—
—
Montana
—
0
0
—
—
1
12
29
6
24
N
0
0
N
N
Nevada
—
0
2
—
—
—
2
12
1
5
—
0
3
—
—
New Mexico
—
0
1
—
—
—
10
22
—
50
—
0
1
—
—
Utah
—
0
1
—
1
—
21
41
3
43
—
0
4
—
—
Wyoming
—
0
0
—
—
—
1
12
—
—
—
0
0
—
—
Pacific
—
0
4
—
1
4
57
110
16
129
—
3
12
—
2
Alaska
—
0
1
—
—
—
5
18
3
43
—
0
2
—
1
California
—
0
4
—
1
4
30
53
12
57
—
3
11
—
1
Hawaii
—
0
1
—
—
—
1
4
—
1
—
0
0
—
—
Oregon
—
0
1
—
—
—
8
26
1
28
—
0
2
—
—
Washington
—
0
1
—
—
—
13
38
—
—
—
0
0
—
—
Territories
American Samoa
—
—
—
—
—
—
—
—
—
—
N
—
—
N
N
C.N.M.I.
—
—
—
—
—
—
—
—
—
—
—
—
—
—
—
Guam
—
0
0
—
—
—
0
0
—
—
—
0
0
—
—
Puerto Rico
—
0
1
—
—
—
0
6
—
—
—
0
0
—
—
U.S. Virgin Islands
—
0
0
—
—
—
0
0
—
—
—
0
0
—
—
C.N.M.I.: Commonwealth of Northern Mariana Islands.
U: Unavailable. —: No reported cases. N: Not reportable. NN: Not Nationally Notifiable. Cum: Cumulative year-to-date counts. Med: Median. Max: Maximum.
TABLE II. (Continued) Provisional cases of selected notifiable diseases, United States, weeks ending January 18, 2014, and January 19, 2013 (3rd week)* (Export data)
Reporting area
Salmonellosis
Shiga toxin-producing E. coli (STEC)†
Shigellosis
Current week
Previous 52 weeks
Cum 2014
Cum 2013
Current week
Previous 52 weeks
Cum 2014
Cum 2013
Current week
Previous 52 weeks
Cum 2014
Cum 2013
Med
Max
Med
Max
Med
Max
United States
222
877
1,508
863
1,398
15
110
240
64
177
94
216
365
495
392
New England
7
39
81
36
55
—
4
12
2
8
2
3
94
8
12
Connecticut
—
7
21
8
20
—
1
7
—
2
—
1
5
—
1
Maine
—
2
11
—
4
—
0
4
—
—
—
0
1
—
—
Massachusetts
6
21
54
23
25
—
2
8
1
5
2
2
11
8
10
New Hampshire
—
3
11
—
5
—
0
2
—
1
—
0
1
—
—
Rhode Island
—
2
13
—
—
—
0
2
—
—
—
0
86
—
—
Vermont
1
1
5
5
1
—
0
3
1
—
—
0
1
—
1
Mid. Atlantic
22
96
196
78
143
2
13
37
10
21
11
15
28
28
45
New Jersey
—
18
46
1
35
—
2
8
—
8
—
2
7
—
5
New York (Upstate)
12
24
50
23
23
2
4
10
2
3
8
4
14
11
16
New York City
2
20
52
28
35
—
1
8
2
5
—
6
14
11
16
Pennsylvania
8
29
65
26
50
—
5
19
6
5
3
2
9
6
8
E.N. Central
14
97
170
56
193
—
15
46
3
44
13
23
74
47
118
Illinois
—
31
61
3
63
—
4
32
—
8
—
5
15
—
6
Indiana
—
13
27
—
23
—
2
7
—
8
—
2
6
—
7
Michigan
3
17
42
13
34
—
2
14
1
7
1
3
8
2
14
Ohio
11
22
42
38
39
—
4
15
2
5
12
10
67
42
87
Wisconsin
—
13
29
2
34
—
1
12
—
16
—
0
3
3
4
W.N. Central
4
46
93
30
85
—
10
38
5
27
4
7
74
39
16
Iowa
—
10
36
10
22
—
2
14
—
2
1
2
43
12
6
Kansas
—
7
18
1
6
—
1
6
—
2
—
0
4
—
2
Minnesota
—
0
0
—
—
—
0
0
—
—
—
0
0
—
—
Missouri
4
17
38
11
45
—
4
18
4
18
3
2
9
15
—
Nebraska
—
5
20
7
6
—
1
7
—
3
—
1
4
1
7
North Dakota
—
2
7
—
2
—
0
3
1
—
—
0
2
—
1
South Dakota
—
3
10
1
4
—
0
5
—
2
—
0
29
11
—
S. Atlantic
145
230
434
481
398
9
9
18
21
20
33
48
156
247
55
Delaware
—
1
7
1
5
—
0
2
—
—
—
0
2
1
1
District of Columbia
—
0
4
—
1
—
0
1
—
—
—
0
2
—
—
Florida
89
105
226
237
178
4
3
7
8
2
14
18
46
61
19
Georgia
10
34
101
46
61
1
2
10
3
8
9
16
36
47
25
Maryland
4
17
37
30
50
1
1
7
4
6
—
2
6
3
2
North Carolina
37
32
136
110
63
3
1
8
4
3
9
2
119
130
6
South Carolina
1
20
52
30
34
—
0
2
1
—
1
3
6
2
2
Virginia
4
3
27
26
1
—
0
3
1
—
—
0
7
3
—
West Virginia
—
3
9
1
5
—
0
3
—
1
—
0
2
—
—
E.S. Central
7
57
138
60
118
1
5
18
6
13
15
19
66
68
26
Alabama
—
17
69
14
37
—
1
3
—
3
1
5
14
10
11
Kentucky
3
9
21
15
25
—
2
9
3
1
—
1
6
3
6
Mississippi
—
13
41
11
27
—
0
4
—
1
—
4
13
8
8
Tennessee
4
16
36
20
29
1
2
6
3
8
14
7
50
47
1
W.S. Central
6
118
246
23
84
3
13
33
10
7
9
47
147
22
34
Arkansas
4
13
35
4
7
1
1
6
1
—
5
5
20
9
2
Louisiana
—
19
43
5
33
—
0
2
—
1
—
5
21
1
5
Oklahoma
—
12
49
9
7
—
1
10
—
—
—
3
13
—
12
Texas
2
71
163
5
37
2
9
28
9
6
4
28
122
12
15
Mountain
2
51
248
36
90
—
9
33
2
17
—
10
38
15
28
Arizona
1
18
32
6
33
—
1
11
—
9
—
6
27
7
13
Colorado
—
6
27
9
18
—
0
11
—
3
—
1
5
3
3
Idaho
1
2
9
6
5
—
2
6
1
1
—
0
3
3
—
Montana
—
2
9
3
2
—
1
5
—
—
—
0
10
1
—
Nevada
—
4
205
—
13
—
1
3
—
3
—
0
7
—
6
New Mexico
—
6
14
—
10
—
0
3
1
—
—
1
5
—
5
Utah
—
6
14
12
8
—
1
9
—
1
—
0
2
1
1
Wyoming
—
1
4
—
1
—
0
7
—
—
—
0
2
—
—
Pacific
15
103
205
63
232
—
17
50
5
20
7
21
47
21
58
Alaska
—
1
5
2
—
—
0
0
—
—
—
0
1
1
—
California
14
79
158
40
216
—
8
26
3
17
6
17
47
17
54
Hawaii
—
6
13
12
10
—
0
5
1
1
—
0
6
—
—
Oregon
1
6
25
9
5
—
3
14
1
1
1
1
4
3
2
Washington
—
10
32
—
1
—
3
32
—
1
—
1
10
—
2
Territories
American Samoa
—
—
—
—
—
—
—
—
—
—
—
—
—
—
—
C.N.M.I.
—
—
—
—
—
—
—
—
—
—
—
—
—
—
—
Guam
—
0
0
—
—
—
0
0
—
—
—
0
0
—
—
Puerto Rico
—
7
43
—
15
—
0
6
—
—
—
0
1
—
—
U.S. Virgin Islands
—
0
0
—
—
—
0
0
—
—
—
0
0
—
—
C.N.M.I.: Commonwealth of Northern Mariana Islands.
U: Unavailable. —: No reported cases. N: Not reportable. NN: Not Nationally Notifiable. Cum: Cumulative year-to-date counts. Med: Median. Max: Maximum.
† Includes E. coli O157:H7; Shiga toxin-positive, serogroup non-O157; and Shiga toxin-positive, not serogrouped.
TABLE II. (Continued) Provisional cases of selected notifiable diseases, United States, weeks ending January 18, 2014, and January 19, 2013 (3rd week)* (Export data)
Reporting area
Spotted Fever Rickettsiosis (including RMSF)†
Syphilis, primary and secondary
Confirmed
Probable
Current week
Previous 52 weeks
Cum 2014
Cum 2013
Current week
Previous 52 weeks
Cum 2014
Cum 2013
Current week
Previous 52 weeks
Cum 2014
Cum 2013
Med
Max
Med
Max
Med
Max
United States
1
2
10
1
4
2
35
172
12
22
86
319
459
389
794
New England
—
0
1
—
—
—
0
2
—
—
—
9
19
7
27
Connecticut
—
0
0
—
—
—
0
0
—
—
—
1
6
1
7
Maine
—
0
0
—
—
—
0
1
—
—
—
0
1
—
—
Massachusetts
—
0
0
—
—
—
0
1
—
—
—
7
18
6
18
New Hampshire
—
0
1
—
—
—
0
1
—
—
—
0
3
—
2
Rhode Island
—
0
0
—
—
—
0
2
—
—
—
0
4
—
—
Vermont
—
0
0
—
—
—
0
0
—
—
—
0
2
—
—
Mid. Atlantic
1
0
1
1
1
—
1
6
—
4
10
40
58
53
99
New Jersey
—
0
1
—
—
—
0
4
—
2
—
4
9
—
13
New York (Upstate)
1
0
1
1
—
—
0
3
—
—
4
5
26
8
4
New York City
—
0
1
—
—
—
0
1
—
—
2
21
35
28
57
Pennsylvania
—
0
1
—
1
—
0
3
—
2
4
9
16
17
25
E.N. Central
—
0
2
—
—
1
2
14
2
5
—
36
56
13
93
Illinois
—
0
1
—
—
—
1
8
—
1
—
12
28
3
46
Indiana
—
0
1
—
—
—
1
4
—
3
—
4
10
1
6
Michigan
—
0
1
—
—
—
0
1
—
—
—
8
17
1
16
Ohio
—
0
1
—
—
1
0
2
2
1
—
8
14
7
19
Wisconsin
—
0
1
—
—
—
0
2
—
—
—
1
5
1
6
W.N. Central
—
0
1
—
—
—
3
26
—
—
—
12
25
9
32
Iowa
—
0
0
—
—
—
0
2
—
—
—
1
6
—
6
Kansas
—
0
0
—
—
—
0
0
—
—
—
1
4
—
2
Minnesota
—
0
0
—
—
—
0
0
—
—
—
3
8
—
9
Missouri
—
0
1
—
—
—
3
25
—
—
—
5
10
6
11
Nebraska
—
0
1
—
—
—
0
2
—
—
—
0
3
—
2
North Dakota
—
0
0
—
—
—
0
1
—
—
—
0
2
—
—
South Dakota
—
0
1
—
—
—
0
1
—
—
—
0
3
3
2
S. Atlantic
—
2
5
—
3
—
5
55
4
4
34
75
149
132
147
Delaware
—
0
0
—
—
—
0
2
2
—
2
0
9
3
2
District of Columbia
—
0
1
—
—
—
0
0
—
—
—
3
8
—
11
Florida
—
0
2
—
—
—
0
4
2
—
4
27
43
44
71
Georgia
—
1
5
—
3
—
0
0
—
—
22
15
47
46
34
Maryland
—
0
1
—
—
—
0
4
—
—
—
8
16
10
12
North Carolina
—
0
2
—
—
—
1
47
—
—
—
7
31
13
3
South Carolina
—
0
1
—
—
—
1
2
—
4
6
5
13
11
8
Virginia
—
0
1
—
—
—
1
12
—
—
—
5
17
5
6
West Virginia
—
0
1
—
—
—
0
2
—
—
—
0
1
—
—
E.S. Central
—
0
3
—
—
1
11
49
6
8
6
11
18
25
25
Alabama
—
0
1
—
—
—
3
17
3
—
—
4
8
3
5
Kentucky
—
0
1
—
—
—
1
6
2
2
5
2
8
7
1
Mississippi
—
0
1
—
—
—
0
4
—
—
—
1
11
12
7
Tennessee
—
0
2
—
—
1
7
30
1
6
1
3
8
3
12
W.S. Central
—
0
4
—
—
—
6
104
—
—
2
40
64
36
129
Arkansas
—
0
2
—
—
—
4
28
—
—
—
3
10
5
10
Louisiana
—
0
0
—
—
—
0
1
—
—
2
7
18
3
20
Oklahoma
—
0
4
—
—
—
0
88
—
—
—
2
8
3
4
Texas
—
0
1
—
—
—
1
4
—
—
—
29
40
25
95
Mountain
—
0
3
—
—
—
1
4
—
1
9
15
26
29
29
Arizona
—
0
3
—
—
—
0
4
—
1
—
5
12
1
5
Colorado
—
0
0
—
—
—
0
0
—
—
—
3
9
1
11
Idaho
—
0
1
—
—
—
0
0
—
—
—
0
2
—
—
Montana
—
0
0
—
—
—
0
1
—
—
—
0
1
—
—
Nevada
—
0
0
—
—
—
0
1
—
—
7
4
14
24
5
New Mexico
—
0
0
—
—
—
0
1
—
—
1
1
4
2
3
Utah
—
0
0
—
—
—
0
1
—
—
1
1
5
1
5
Wyoming
—
0
0
—
—
—
0
1
—
—
—
0
1
—
—
Pacific
—
0
1
—
—
—
0
1
—
—
25
77
110
85
213
Alaska
N
0
0
N
N
N
0
0
N
N
—
0
3
—
1
California
—
0
1
—
—
—
0
1
—
—
18
65
94
69
172
Hawaii
N
0
0
N
N
N
0
0
N
N
—
1
3
—
2
Oregon
—
0
1
—
—
—
0
1
—
—
1
5
11
4
21
Washington
—
0
0
—
—
—
0
0
—
—
6
5
14
12
17
Territories
American Samoa
N
—
—
N
N
N
—
—
N
N
—
—
—
—
—
C.N.M.I.
—
—
—
—
—
—
—
—
—
—
—
—
—
—
—
Guam
N
0
0
N
N
N
0
0
N
N
—
0
0
—
—
Puerto Rico
N
0
0
N
N
N
0
0
N
N
9
6
30
19
16
U.S. Virgin Islands
N
0
0
N
N
N
0
0
N
N
—
0
1
—
—
C.N.M.I.: Commonwealth of Northern Mariana Islands.
U: Unavailable. —: No reported cases. N: Not reportable. NN: Not Nationally Notifiable. Cum: Cumulative year-to-date counts. Med: Median. Max: Maximum.
† Illnesses with similar clinical presentation that result from Spotted fever group rickettsia infections are reported as Spotted fever rickettsioses. Rocky Mountain spotted fever (RMSF) caused by Rickettsia rickettsii, is the most common and well-known spotted fever.
TABLE II. (Continued) Provisional cases of selected notifiable diseases, United States, weeks ending January 18, 2014, and January 19, 2013 (3rd week)* (Export data)
Reporting area
Varicella (chickenpox)
West Nile virus disease†
Neuroinvasive
Nonneuroinvasive§
Current week
Previous 52 weeks
Cum 2014
Cum 2013
Current week
Previous 52 weeks
Cum 2014
Cum 2013
Current week
Previous 52 weeks
Cum 2014
Cum 2013
Med
Max
Med
Max
Med
Max
United States
88
206
285
222
496
—
1
155
—
—
—
1
164
—
1
New England
3
17
42
20
55
—
0
3
—
—
—
0
2
—
—
Connecticut
—
4
9
2
19
—
0
1
—
—
—
0
1
—
—
Maine
2
3
7
8
12
—
0
0
—
—
—
0
0
—
—
Massachusetts
—
7
15
6
20
—
0
2
—
—
—
0
1
—
—
New Hampshire
—
1
4
—
2
—
0
1
—
—
—
0
0
—
—
Rhode Island
—
0
4
2
—
—
0
1
—
—
—
0
0
—
—
Vermont
1
1
27
2
2
—
0
1
—
—
—
0
1
—
—
Mid. Atlantic
13
19
39
29
80
—
0
7
—
—
—
0
6
—
—
New Jersey
—
4
21
—
37
—
0
4
—
—
—
0
2
—
—
New York (Upstate)
N
0
0
N
N
—
0
2
—
—
—
0
4
—
—
New York City
—
0
0
—
—
—
0
1
—
—
—
0
1
—
—
Pennsylvania
13
15
26
29
43
—
0
1
—
—
—
0
1
—
—
E.N. Central
26
63
104
82
154
—
0
26
—
—
—
0
14
—
—
Illinois
—
13
32
12
37
—
0
21
—
—
—
0
8
—
—
Indiana
—
5
14
5
19
—
0
6
—
—
—
0
1
—
—
Michigan
8
20
44
19
40
—
0
5
—
—
—
0
4
—
—
Ohio
14
13
33
26
36
—
0
3
—
—
—
0
2
—
—
Wisconsin
4
7
23
20
22
—
0
3
—
—
—
0
1
—
—
W.N. Central
—
5
15
5
26
—
0
51
—
—
—
0
71
—
—
Iowa
N
0
0
N
N
—
0
10
—
—
—
0
5
—
—
Kansas
—
0
0
—
—
—
0
8
—
—
—
0
17
—
—
Minnesota
—
0
0
—
—
—
0
7
—
—
—
0
8
—
—
Missouri
—
3
12
2
21
—
0
6
—
—
—
0
1
—
—
Nebraska
—
0
2
—
—
—
0
14
—
—
—
0
30
—
—
North Dakota
—
0
4
—
5
—
0
11
—
—
—
0
9
—
—
South Dakota
—
1
4
3
—
—
0
10
—
—
—
0
12
—
—
S. Atlantic
14
26
49
31
60
—
0
8
—
—
—
0
3
—
1
Delaware
—
0
2
—
—
—
0
1
—
—
—
0
0
—
—
District of Columbia
—
0
2
—
2
—
0
0
—
—
—
0
1
—
—
Florida
13
13
25
23
39
—
0
1
—
—
—
0
1
—
—
Georgia
—
0
5
1
4
—
0
1
—
—
—
0
1
—
—
Maryland
N
0
0
N
N
—
0
4
—
—
—
0
3
—
—
North Carolina
—
0
0
—
—
—
0
2
—
—
—
0
0
—
—
South Carolina
1
2
13
3
3
—
0
1
—
—
—
0
1
—
1
Virginia
—
5
19
—
10
—
0
2
—
—
—
0
0
—
—
West Virginia
—
2
8
4
2
—
0
0
—
—
—
0
0
—
—
E.S. Central
—
3
9
1
7
—
0
6
—
—
—
0
7
—
—
Alabama
—
3
8
1
7
—
0
0
—
—
—
0
3
—
—
Kentucky
N
0
0
N
N
—
0
1
—
—
—
0
1
—
—
Mississippi
—
0
1
—
—
—
0
5
—
—
—
0
3
—
—
Tennessee
N
0
0
N
N
—
0
3
—
—
—
0
2
—
—
W.S. Central
8
37
104
12
53
—
0
29
—
—
—
0
17
—
—
Arkansas
—
3
12
—
6
—
0
3
—
—
—
0
1
—
—
Louisiana
—
1
7
—
5
—
0
7
—
—
—
0
3
—
—
Oklahoma
N
0
0
N
N
—
0
9
—
—
—
0
5
—
—
Texas
8
33
103
12
42
—
0
16
—
—
—
0
12
—
—
Mountain
24
19
39
41
56
—
0
29
—
—
—
0
53
—
—
Arizona
2
6
23
5
12
—
0
4
—
—
—
0
2
—
—
Colorado
20
3
16
25
19
—
0
17
—
—
—
0
34
—
—
Idaho
N
0
0
N
N
—
0
5
—
—
—
0
7
—
—
Montana
1
1
6
3
7
—
0
5
—
—
—
0
7
—
—
Nevada
N
0
0
N
N
—
0
4
—
—
—
0
1
—
—
New Mexico
—
1
4
3
4
—
0
4
—
—
—
0
3
—
—
Utah
1
4
13
5
13
—
0
1
—
—
—
0
1
—
—
Wyoming
—
0
2
—
1
—
0
4
—
—
—
0
6
—
—
Pacific
—
2
6
1
5
—
0
27
—
—
—
0
18
—
—
Alaska
—
1
6
—
3
—
0
0
—
—
—
0
0
—
—
California
—
0
2
1
1
—
0
27
—
—
—
0
18
—
—
Hawaii
—
0
4
—
1
—
0
0
—
—
—
0
0
—
—
Oregon
N
0
0
N
N
—
0
1
—
—
—
0
1
—
—
Washington
N
0
0
N
N
—
0
0
—
—
—
0
1
—
—
Territories
American Samoa
N
—
—
N
N
—
—
—
—
—
—
—
—
—
—
C.N.M.I.
—
—
—
—
—
—
—
—
—
—
—
—
—
—
—
Guam
—
0
0
—
—
—
0
0
—
—
—
0
0
—
—
Puerto Rico
—
4
14
—
12
—
0
0
—
—
—
0
0
—
—
U.S. Virgin Islands
—
0
0
—
—
—
0
0
—
—
—
0
0
—
—
C.N.M.I.: Commonwealth of Northern Mariana Islands.
U: Unavailable. —: No reported cases. N: Not reportable. NN: Not Nationally Notifiable. Cum: Cumulative year-to-date counts. Med: Median. Max: Maximum.
† Updated weekly from reports to the Division of Vector-Borne Infectious Diseases, National Center for Zoonotic, Vector-Borne, and Enteric Diseases (ArboNET Surveillance). Data for California serogroup, eastern equine, Powassan, St. Louis, and western equine diseases are available in Table I.
§ Not reportable in all states. Data from states where the condition is not reportable are excluded from this table, except starting in 2007 for the domestic arboviral diseases and influenza-associated pediatric mortality, and in 2003 for SARS-CoV. Reporting exceptions are available at http://wwwn.cdc.gov/nndss/document/SRCA_FINAL_REPORT_2006-2012_final.xlsx.
TABLE III. Deaths in 122 U.S. cities,* week ending January 18, 2014 (3rd week)
Reporting area
All causes, by age (years)
P&I† Total
Reporting area (Continued)
All causes, by age (years)
P&I† Total
All Ages
=65
45–64
25–44
1–24
<1
All Ages
=65
45–64
25–44
1–24
<1
New England
628
427
149
38
8
6
50
S. Atlantic
1,211
800
292
80
23
16
92
Boston, MA
168
111
38
13
3
3
14
Atlanta, GA
230
144
63
15
7
1
17
Bridgeport, CT
46
28
15
1
—
2
2
Baltimore, MD
160
89
49
16
2
4
12
Cambridge, MA
23
19
3
1
—
—
3
Charlotte, NC
161
110
32
12
5
2
15
Fall River, MA
23
17
4
1
1
—
5
Jacksonville, FL
220
163
44
11
2
—
15
Hartford, CT
59
41
12
5
—
1
4
Miami, FL
49
37
10
1
—
1
3
Lowell, MA
31
24
6
1
—
—
3
Norfolk, VA
50
33
11
6
—
—
6
Lynn, MA
11
9
1
1
—
—
1
Richmond, VA
56
31
20
4
1
—
3
New Bedford, MA
27
22
5
—
—
—
2
Savannah, GA
92
55
31
3
1
2
12
New Haven, CT
49
29
16
2
2
—
5
St. Petersburg, FL
57
41
9
3
1
3
4
Providence, RI
76
53
17
4
2
—
—
Tampa, FL
118
80
22
9
4
3
4
Somerville, MA
5
3
2
—
—
—
—
Washington, D.C.
U
U
U
U
U
U
U
Springfield, MA
26
14
6
6
—
—
2
Wilmington, DE
18
17
1
—
—
—
1
Waterbury, CT
30
20
10
—
—
—
3
E.S. Central
1,148
760
283
67
21
17
96
Worcester, MA
54
37
14
3
—
—
6
Birmingham, AL
170
99
48
15
3
5
17
Mid. Atlantic
2,238
1,580
488
114
36
20
129
Chattanooga, TN
143
102
31
5
3
2
13
Albany, NY
57
37
14
3
1
2
2
Knoxville, TN
139
94
32
11
1
1
4
Allentown, PA
26
19
6
1
—
—
3
Lexington, KY
86
53
30
2
1
—
6
Buffalo, NY
96
70
21
3
1
1
12
Memphis, TN
217
142
51
14
7
3
22
Camden, NJ
U
U
U
U
U
U
U
Mobile, AL
120
90
20
7
2
1
7
Elizabeth, NJ
28
15
8
3
1
1
3
Montgomery, AL
74
49
19
1
3
2
5
Erie, PA
53
36
12
5
—
—
1
Nashville, TN
199
131
52
12
1
3
22
Jersey City, NJ
26
18
6
1
1
—
4
W.S. Central
1,848
1,176
464
134
41
33
144
New York City, NY
1,485
1,028
343
79
23
12
64
Austin, TX
129
75
32
14
4
4
8
Newark, NJ
32
18
8
2
4
—
—
Baton Rouge, LA
114
71
30
7
2
4
10
Paterson, NJ
U
U
U
U
U
U
U
Corpus Christi, TX
100
60
28
6
2
4
20
Philadelphia, PA
U
U
U
U
U
U
U
Dallas, TX
247
139
66
23
8
11
28
Pittsburgh, PA§
50
40
8
1
1
—
4
El Paso, TX
170
120
33
10
5
2
—
Reading, PA
35
33
1
—
—
1
2
Fort Worth, TX
U
U
U
U
U
U
U
Rochester, NY
172
131
28
8
2
3
15
Houston, TX
471
292
136
33
8
2
20
Schenectady, NY
29
22
7
—
—
—
3
Little Rock, AR
U
U
U
U
U
U
U
Scranton, PA
31
24
6
1
—
—
3
New Orleans, LA
80
45
22
8
4
1
1
Syracuse, NY
75
57
13
3
2
—
10
San Antonio, TX
361
241
84
27
4
5
41
Trenton, NJ
U
U
U
U
U
U
U
Shreveport, LA
106
72
26
4
4
—
11
Utica, NY
20
14
3
3
—
—
—
Tulsa, OK
70
61
7
2
—
—
5
Yonkers, NY
23
18
4
1
—
—
3
Mountain
1,156
810
259
59
15
12
110
E.N. Central
2,559
1,743
623
114
39
40
221
Albuquerque, NM
198
133
51
13
—
1
20
Akron, OH
55
37
11
3
1
3
8
Boise, ID
54
42
6
1
2
3
6
Canton, OH
51
37
10
2
1
1
10
Colorado Springs, CO
96
73
15
8
—
—
12
Chicago, IL
321
197
92
24
5
3
33
Denver, CO
140
83
46
10
—
1
5
Cincinnati, OH
110
77
24
5
2
2
8
Las Vegas, NV
278
196
62
12
4
3
30
Cleveland, OH
378
273
85
13
6
1
24
Ogden, UT
34
26
4
2
1
1
4
Columbus, OH
327
198
94
20
5
10
26
Phoenix, AZ
U
U
U
U
U
U
U
Dayton, OH
159
108
38
6
2
5
8
Pueblo, CO
35
23
8
3
1
—
9
Detroit, MI
U
U
U
U
U
U
U
Salt Lake City, UT
128
86
30
5
5
2
11
Evansville, IN
57
40
14
1
2
—
3
Tucson, AZ
193
148
37
5
2
1
13
Fort Wayne, IN
98
69
20
6
—
3
7
Pacific
2,051
1,416
467
87
50
30
197
Gary, IN
17
9
7
1
—
—
1
Berkeley, CA
17
11
6
—
—
—
—
Grand Rapids, MI
75
50
20
1
2
2
7
Fresno, CA
171
117
36
9
5
4
18
Indianapolis, IN
302
196
85
10
9
2
40
Glendale, CA
38
31
6
1
—
—
8
Lansing, MI
67
52
12
2
1
—
4
Honolulu, HI
75
55
11
3
3
3
6
Milwaukee, WI
97
66
20
7
—
4
13
Long Beach, CA
75
48
23
2
2
—
6
Peoria, IL
62
49
11
—
1
1
5
Los Angeles, CA
278
185
71
12
8
2
33
Rockford, IL
65
52
11
1
—
1
7
Pasadena, CA
27
21
5
1
—
—
3
South Bend, IN
73
54
16
2
—
1
5
Portland, OR
146
93
42
6
4
1
7
Toledo, OH
166
115
42
6
2
1
10
Sacramento, CA
285
197
65
11
9
3
31
Youngstown, OH
79
64
11
4
—
—
2
San Diego, CA
178
123
35
11
6
3
14
W.N. Central
843
532
229
52
16
12
65
San Francisco, CA
121
86
32
—
2
1
19
Des Moines, IA
77
51
19
2
3
2
5
San Jose, CA
274
206
48
12
1
6
28
Duluth, MN
35
27
8
—
—
—
2
Santa Cruz, CA
42
26
14
1
1
—
2
Kansas City, KS
41
20
17
1
3
—
1
Seattle, WA
116
80
21
7
2
6
10
Kansas City, MO
125
82
30
10
1
—
13
Spokane, WA
75
47
23
3
1
1
6
Lincoln, NE
51
39
11
1
—
—
4
Tacoma, WA
133
90
29
8
6
—
6
Minneapolis, MN
84
38
34
7
4
1
11
Total¶
13,682
9,244
3,254
745
249
186
1,104
Omaha, NE
118
82
27
3
2
4
9
St. Louis, MO
134
68
48
14
2
2
13
St. Paul, MN
66
52
9
2
1
2
6
Wichita, KS
112
73
26
12
—
1
1
U: Unavailable. —: No reported cases.
* Mortality data in this table are voluntarily reported from 122 cities in the United States, most of which have populations of >100,000. A death is reported by the place of its occurrence and by the week that the death certificate was filed. Fetal deaths are not included.
† Pneumonia and influenza.
§ Because of changes in reporting methods in this Pennsylvania city, these numbers are partial counts for the current week. Complete counts will be available in 4 to 6 weeks.