Persons using assistive technology might not be able to fully access information in this file. For assistance, please send e-mail to: mmwrq@cdc.gov. Type 508 Accommodation and the title of the report in the subject line of e-mail.
Notifiable Diseases and Mortality Tables
Table I Summary of provisional cases of selected notifiable diseases, United States, cumulative, week ending March 2, 2013 (9th Week)
Figure I Selected notifiable disease reports, United States, comparison of provisional 4-week totals ending March 2, 2013, with historical data
Table II Provisional cases of selected notifiable diseases, United States, weeks ending March 2, 2013 and March 3, 2012 (9th Week)
Table III Deaths in 122 U.S. cities, week ending March 2, 2013 (9th Week)
TABLE I. Provisional cases of infrequently reported notifiable diseases (<1,000 cases reported during the preceding year) — United States, week ending March 2, 2013 (9th week)*
TABLE I. (Continued) Provisional cases of infrequently reported notifiable diseases (<1,000 cases reported during the preceding year) — United States, week ending March 2, 2013 (9th week)*
—: No reported cases. N: Not reportable. NN: Not Nationally Notifiable. Cum: Cumulative year-to-date counts.
† Calculated by summing the incidence counts for the current week, the 2 weeks preceding the current week, and the 2 weeks following the current week, for a total of 5 preceding years. The total sum of incident cases is then divided by 25 weeks. Additional information is available at http://wwwn.cdc.gov/nndss/document/5yearweeklyaverage.pdf.
§ Not reportable in all states. Data from states where the condition is not reportable are excluded from this table except starting in 2007 for the arboviral diseases, STD data, TB data, and influenza-associated pediatric mortality, and in 2003 for SARS-CoV. Reporting exceptions are available at http://wwwn.cdc.gov/nndss/document/SRCA_FINAL_REPORT_2006-2010.xlsx.
¶ Includes both neuroinvasive and nonneuroinvasive. Updated weekly from reports to the Division of Vector-Borne Infectious Diseases, National Center for Zoonotic, Vector-Borne, and Enteric Diseases (ArboNET Surveillance). Data for West Nile virus are available in Table II.
** Data for H. influenzae (all ages, all serotypes) are available in Table II.
†† Updated weekly from reports to the Influenza Division, National Center for Immunization and Respiratory Diseases. Since September 30, 2012, 87 influenza-associated pediatric deaths occurring during the 2012-13 influenza season have been reported.
§§ No measles cases were reported for the current week.
¶¶ Data for meningococcal disease (all serogroups) are available in Table II.
*** CDC discontinued reporting of individual confirmed and probable cases of 2009 pandemic influenza A (H1N1) virus infections on July 24, 2009. During 2009, four cases of human infection with novel influenza A viruses, different from the 2009 pandemic influenza A (H1N1) strain, were reported to CDC. The four cases of novel influenza A virus infection reported to CDC during 2010, the fourteen cases reported during 2011, and the 313 cases reported in 2012 are different from the 2009 pandemic influenza A (H1N1) virus. Total case counts are provided by the Influenza Division, National Center for Immunization and Respiratory Diseases (NCIRD).
††† No rubella cases were reported for the current week.
§§§ Updated weekly from reports to the Division of STD Prevention, National Center for HIV/AIDS, Viral Hepatitis, STD, and TB Prevention.
¶¶¶ There were no cases of viral hemorrhagic fever reported during the current week. See Table II for dengue hemorrhagic fever.
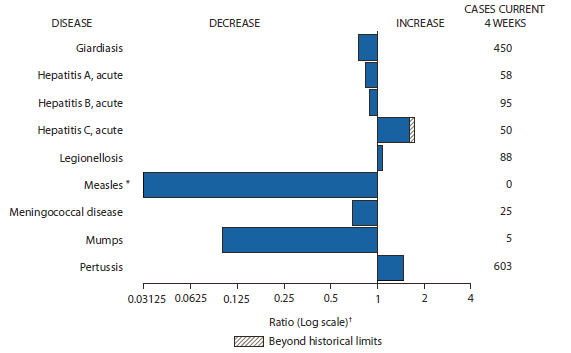
FIGURE I. Selected notifiable disease reports, United States, comparison of provisional 4-week totals March 2, 2013, with historical data
* No measles cases were reported for the current 4-week period yielding a ratio for week 9 of zero (0).
† Ratio of current 4-week total to mean of 15 4-week totals (from previous, comparable, and subsequent 4-week periods for the past 5 years). The point where the hatched area begins is based on the mean and two standard deviations of these 4-week totals.
Alternate Text: The figure above shows selected notifiable disease reports for the United States with comparison of provisional 4-week totals through March 2, 2013, with historical data. Reports of acute hepatitis C, legionellosis, and pertussis all increased, with acute hepatitis C increasing beyond historical limits. Reports of giardiasis, acute hepatitis A, acute hepatitis B, measles, meningococcal disease, and mumps all decreased.
TABLE II. Provisional cases of selected notifiable diseases, United States, weeks ending March 2, 2013, and March 3, 2012 (9th week)*
Reporting area
Chlamydia trachomatis infection
Coccidioidomycosis
Cryptosporidiosis
Current week
Previous 52 weeks
Cum 2013
Cum 2012
Current week
Previous 52 weeks
Cum 2013
Cum 2012
Current week
Previous 52 weeks
Cum 2013
Cum 2012
Med
Max
Med
Max
Med
Max
United States
12,629
26,841
30,313
193,823
242,602
23
247
546
270
3,453
44
128
282
643
935
New England
561
944
1,349
7,547
8,088
—
0
1
1
—
—
7
19
14
50
Connecticut
11
253
569
1,929
2,158
N
0
0
N
N
—
1
3
3
5
Maine
—
60
101
462
551
N
0
0
N
N
—
1
4
2
8
Massachusetts
494
470
706
3,903
3,612
—
0
0
—
—
—
2
8
6
23
New Hampshire
—
60
83
350
559
—
0
1
1
—
—
0
4
1
8
Rhode Island
—
79
161
538
1,007
—
0
1
—
—
—
0
3
—
—
Vermont
56
28
101
365
201
N
0
0
N
N
—
1
6
2
6
Mid. Atlantic
2,501
3,503
4,482
31,231
30,820
—
0
1
—
2
3
12
41
68
89
New Jersey
171
540
635
4,255
4,958
N
0
0
N
N
—
0
4
—
8
New York (Upstate)
815
722
1,668
5,659
5,443
N
0
0
N
N
1
2
16
15
14
New York City
572
1,130
1,265
9,462
10,709
N
0
0
N
N
—
2
8
7
16
Pennsylvania
943
1,074
1,990
11,855
9,710
—
0
1
—
2
2
7
21
46
51
E.N. Central
1,254
4,245
4,639
26,218
38,852
—
1
4
4
9
10
28
110
128
244
Illinois
31
1,239
1,542
4,615
11,985
N
0
0
N
N
—
3
8
3
23
Indiana
307
563
838
4,029
5,067
N
0
0
N
N
—
3
8
8
28
Michigan
379
916
1,304
6,800
8,331
—
0
2
2
5
—
5
40
28
54
Ohio
295
1,036
1,182
6,898
9,297
—
0
2
—
4
8
10
28
53
77
Wisconsin
242
471
551
3,876
4,172
—
0
1
2
—
2
9
43
36
62
W.N. Central
165
1,559
1,801
9,447
14,722
—
2
8
—
13
4
17
42
67
112
Iowa
7
210
255
1,474
2,207
N
0
0
N
N
1
5
22
13
44
Kansas
22
212
256
1,461
2,083
N
0
0
N
N
1
2
5
2
19
Minnesota
—
342
436
903
3,194
—
1
7
—
12
—
0
0
—
—
Missouri
104
545
657
3,894
4,884
—
0
1
—
1
1
4
12
33
20
Nebraska
—
129
187
850
1,227
—
0
1
—
—
—
2
10
9
8
North Dakota
4
49
73
255
485
—
0
0
—
—
—
0
3
3
4
South Dakota
28
76
106
610
642
N
0
0
N
N
1
2
6
7
17
S. Atlantic
3,656
5,227
6,445
40,260
48,800
—
0
1
—
1
7
19
59
178
186
Delaware
142
85
322
1,128
679
—
0
1
—
—
—
0
2
1
6
District of Columbia
—
134
280
1,289
1,232
—
0
0
—
—
N
0
0
N
N
Florida
895
1,510
1,766
12,707
13,306
N
0
0
N
N
4
9
24
49
75
Georgia
706
918
1,179
7,248
9,773
N
0
0
N
N
—
4
15
38
43
Maryland
—
455
1,231
2,209
3,092
—
0
1
—
1
2
1
5
11
22
North Carolina
1,176
866
1,771
5,564
8,212
N
0
0
N
N
—
0
29
41
—
South Carolina
—
525
908
3,261
4,981
N
0
0
N
N
—
1
4
16
17
Virginia
629
641
936
6,020
6,660
N
0
0
N
N
1
3
6
18
23
West Virginia
108
89
149
834
865
N
0
0
N
N
—
0
3
4
—
E.S. Central
580
1,949
2,559
13,963
18,906
—
0
0
—
—
3
5
14
30
46
Alabama
—
566
862
3,825
5,210
N
0
0
N
N
—
2
6
14
20
Kentucky
293
334
787
2,931
2,738
N
0
0
N
N
1
1
4
6
4
Mississippi
—
393
766
2,669
4,928
N
0
0
N
N
1
0
4
3
8
Tennessee
287
622
784
4,538
6,030
N
0
0
N
N
1
1
5
7
14
W.S. Central
1,187
3,299
4,627
21,789
28,120
—
0
1
1
—
3
9
29
55
67
Arkansas
363
329
394
2,894
2,960
N
0
0
N
N
—
0
5
1
3
Louisiana
528
469
1,317
2,596
1,060
—
0
1
1
—
—
3
7
30
13
Oklahoma
296
91
1,047
1,720
2,180
N
0
0
N
N
1
1
6
5
10
Texas
—
2,434
3,647
14,579
21,920
N
0
0
N
N
2
4
26
19
41
Mountain
792
1,766
2,071
11,202
15,943
5
179
441
63
2,375
8
12
45
40
74
Arizona
—
574
872
969
5,187
4
175
439
52
2,335
—
1
4
2
2
Colorado
405
420
556
3,579
3,863
N
0
0
N
N
—
1
7
3
10
Idaho
109
82
158
744
860
N
0
0
N
N
6
3
25
13
12
Montana
73
74
109
620
677
—
0
1
—
—
—
1
4
3
11
Nevada
29
215
325
1,541
1,465
1
1
7
8
19
—
0
2
1
2
New Mexico
166
225
463
2,721
2,108
—
0
3
—
8
—
1
5
3
20
Utah
10
149
179
898
1,455
—
1
4
2
11
2
2
21
14
13
Wyoming
—
33
63
130
328
—
0
1
1
2
—
0
4
1
4
Pacific
1,933
4,216
4,934
32,166
38,351
18
69
106
201
1,053
6
12
26
63
67
Alaska
40
105
150
961
1,033
N
0
0
N
N
—
0
1
—
—
California
1,219
3,238
4,074
25,277
29,625
18
69
106
201
1,052
4
6
14
40
33
Hawaii
—
119
148
503
1,071
N
0
0
N
N
—
0
1
—
2
Oregon
298
260
368
2,308
2,521
—
0
1
—
1
1
4
11
17
29
Washington
376
465
632
3,117
4,101
—
0
0
—
—
1
1
21
6
3
Territories
American Samoa
—
0
59
—
—
N
0
0
N
N
N
0
0
N
N
C.N.M.I.
—
—
—
—
—
—
—
—
—
—
—
—
—
—
—
Guam
—
—
—
—
—
—
—
—
—
—
—
—
—
—
—
Puerto Rico
108
111
307
1,014
1,217
N
0
0
N
N
N
0
0
N
N
U.S. Virgin Islands
—
14
29
—
126
—
0
0
—
—
—
0
0
—
—
C.N.M.I.: Commonwealth of Northern Mariana Islands.
U: Unavailable. —: No reported cases. N: Not reportable. NN: Not Nationally Notifiable. Cum: Cumulative year-to-date counts. Med: Median. Max: Maximum.
† Data for meningococcal disease, invasive caused by serogroups A, C, Y, and W-135; serogroup B; other serogroup; and unknown serogroup are available in Table I.
TABLE II. (Continued) Provisional cases of selected notifiable diseases, United States, weeks ending March 2, 2013, and March 3, 2012 (9th week)*
Reporting area
Rabies, animal
Salmonellosis
Shiga toxin-producing E. coli (STEC)†
Current week
Previous 52 weeks
Cum 2013
Cum 2012
Current week
Previous 52 weeks
Cum 2013
Cum 2012
Current week
Previous 52 weeks
Cum 2013
Cum 2012
Med
Max
Med
Max
Med
Max
United States
21
79
132
244
583
241
984
1,677
3,226
4,377
25
124
202
309
511
New England
2
6
16
33
63
—
37
72
117
165
—
4
12
10
16
Connecticut
—
3
8
12
29
—
8
19
29
47
—
1
4
2
7
Maine
2
1
4
7
17
—
3
11
8
11
—
0
7
—
—
Massachusetts
—
0
0
—
—
—
21
53
55
79
—
2
7
6
9
New Hampshire
—
0
3
4
7
—
2
8
8
9
—
0
4
2
—
Rhode Island
—
0
5
2
5
—
2
7
8
6
—
0
1
—
—
Vermont
—
1
7
8
5
—
1
7
9
13
—
0
2
—
—
Mid. Atlantic
5
19
41
42
110
19
90
193
333
493
6
11
24
41
56
New Jersey
—
0
0
—
—
—
17
48
24
126
—
1
6
3
16
New York (Upstate)
5
7
20
42
33
11
22
64
93
103
4
4
15
16
10
New York City
—
0
0
—
—
1
20
49
106
118
—
1
7
7
12
Pennsylvania
—
10
28
—
77
7
28
82
110
146
2
3
11
15
18
E.N. Central
—
2
13
3
5
18
104
240
330
491
—
18
77
56
102
Illinois
—
1
6
2
—
—
34
79
73
175
—
3
16
4
18
Indiana
—
0
2
—
—
—
13
40
24
41
—
2
23
9
12
Michigan
—
0
5
1
3
—
16
46
72
94
—
3
41
15
39
Ohio
—
0
7
—
2
18
24
53
114
103
—
3
20
18
11
Wisconsin
N
0
0
N
N
—
14
35
47
78
—
3
21
10
22
W.N. Central
—
3
18
11
26
13
47
110
205
216
—
16
31
43
51
Iowa
—
0
5
—
2
1
9
32
43
41
—
3
15
4
8
Kansas
—
1
4
6
7
—
9
18
28
52
—
2
7
6
4
Minnesota
—
0
0
—
—
—
0
0
—
—
—
0
0
—
—
Missouri
—
0
3
5
3
11
19
48
98
82
—
6
21
26
24
Nebraska
—
0
0
—
—
—
4
26
16
19
—
1
6
4
7
North Dakota
—
0
13
—
7
—
1
5
8
8
—
0
3
1
3
South Dakota
—
1
7
—
7
1
3
9
12
14
—
1
4
2
5
S. Atlantic
4
18
34
98
228
112
272
612
1,108
1,378
6
12
71
59
79
Delaware
—
0
0
—
—
—
2
10
10
11
—
0
3
—
2
District of Columbia
—
0
0
—
—
—
0
3
—
10
—
0
1
—
1
Florida
2
0
5
19
105
67
110
274
538
550
3
4
10
24
28
Georgia
—
0
0
—
—
8
46
125
164
205
—
2
9
12
9
Maryland
—
6
17
11
52
10
18
43
101
119
1
1
5
7
5
North Carolina
—
0
0
—
—
14
26
166
110
253
2
1
61
7
16
South Carolina
—
0
0
—
—
8
24
72
80
111
—
0
7
1
3
Virginia
—
11
23
60
61
4
22
49
96
118
—
1
6
5
14
West Virginia
2
1
6
8
10
1
4
15
9
1
—
0
2
3
1
E.S. Central
2
1
5
3
12
11
62
215
236
296
2
5
14
23
30
Alabama
—
1
5
1
10
5
19
59
74
71
1
1
5
5
10
Kentucky
2
0
3
2
2
—
9
50
49
64
—
1
9
8
5
Mississippi
—
0
1
—
—
2
16
67
52
75
—
0
2
1
5
Tennessee
—
0
0
—
—
4
18
69
61
86
1
2
12
9
10
W.S. Central
7
12
61
52
104
34
145
406
356
596
3
10
94
14
40
Arkansas
—
0
35
10
15
3
16
229
40
31
3
1
6
7
3
Louisiana
—
0
0
—
—
1
24
59
69
97
—
0
3
2
1
Oklahoma
—
0
23
—
7
8
13
34
49
48
—
1
8
2
6
Texas
7
10
39
42
82
22
90
297
198
420
—
7
88
3
30
Mountain
—
1
16
—
20
6
42
78
158
275
5
11
43
26
50
Arizona
N
0
0
N
N
4
12
24
50
82
—
2
7
5
16
Colorado
—
0
0
—
—
—
9
19
15
71
—
3
9
—
12
Idaho
—
0
15
—
—
1
2
7
9
24
4
2
26
10
5
Montana
N
0
0
N
N
—
2
8
10
12
1
0
5
2
1
Nevada
—
0
4
—
—
1
3
12
28
16
—
0
5
6
3
New Mexico
—
0
5
—
20
—
6
18
27
31
—
1
5
—
4
Utah
—
0
2
—
—
—
4
15
16
34
—
1
15
3
6
Wyoming
—
0
0
—
—
—
1
8
3
5
—
0
3
—
3
Pacific
1
3
12
2
15
28
106
177
383
467
3
15
42
37
87
Alaska
—
0
1
—
3
2
1
4
2
12
N
0
0
N
N
California
—
3
11
—
12
15
71
133
294
340
—
8
21
18
62
Hawaii
—
0
0
—
—
—
4
58
14
17
—
0
2
2
1
Oregon
1
0
2
2
—
2
7
16
26
46
—
3
11
7
15
Washington
—
0
0
—
—
9
12
94
47
52
3
3
32
10
9
Territories
American Samoa
—
0
0
—
—
—
1
2
—
1
—
0
0
—
—
C.N.M.I.
—
—
—
—
—
—
—
—
—
—
—
—
—
—
—
Guam
—
—
—
—
—
—
—
—
—
—
—
—
—
—
—
Puerto Rico
—
0
5
—
15
—
0
4
—
13
—
0
2
—
—
U.S. Virgin Islands
—
0
0
—
—
—
0
0
—
—
—
0
0
—
—
C.N.M.I.: Commonwealth of Northern Mariana Islands.
U: Unavailable. —: No reported cases. N: Not reportable. NN: Not Nationally Notifiable. Cum: Cumulative year-to-date counts. Med: Median. Max: Maximum.
† Illnesses with similar clinical presentation that result from Spotted fever group rickettsia infections are reported as Spotted fever rickettsioses. Rocky Mountain spotted fever (RMSF) caused by Rickettsia rickettsii, is the most common and well-known spotted fever.
TABLE II. (Continued) Provisional cases of selected notifiable diseases, United States, weeks ending March 2, 2013, and March 3, 2012 (9th week)*
Reporting area
Streptococcus pneumoniae,† invasive disease
Syphilis, primary and secondary
All ages
Age <5
Current week
Previous 52 weeks
Cum 2013
Cum 2012
Current week
Previous 52 weeks
Cum 2013
Cum 2012
Current week
Previous 52 weeks
Cum 2013
Cum 2012
Med
Max
Med
Max
Med
Max
United States
247
264
685
3,399
3,459
16
22
43
172
257
63
293
378
1,749
2,448
New England
1
11
31
119
153
—
1
4
2
11
3
8
18
56
93
Connecticut
—
5
21
60
76
—
0
2
—
5
—
0
4
3
20
Maine
—
2
8
27
23
—
0
1
1
1
—
0
5
—
2
Massachusetts
—
0
3
1
8
—
0
2
1
4
3
6
13
43
53
New Hampshire
—
1
5
13
19
—
0
1
—
1
—
1
4
3
5
Rhode Island
—
0
9
—
13
—
0
1
—
—
—
0
4
5
13
Vermont
1
1
6
18
14
—
0
0
—
—
—
0
2
2
—
Mid. Atlantic
22
36
63
395
494
2
2
5
21
24
11
35
51
252
298
New Jersey
—
4
20
2
157
—
0
3
—
8
—
4
8
10
33
New York (Upstate)
20
18
39
211
200
2
1
4
13
10
7
4
17
48
20
New York City
2
14
35
182
137
—
0
3
8
6
—
18
30
109
157
Pennsylvania
N
—
—
N
N
N
0
0
N
N
4
9
18
85
88
E.N. Central
49
57
128
714
702
—
4
12
18
44
—
33
57
108
277
Illinois
N
0
0
N
N
—
1
3
2
8
—
12
20
24
120
Indiana
—
13
42
108
170
—
1
2
—
5
—
4
10
20
34
Michigan
6
13
30
144
151
—
0
3
6
9
—
5
14
19
48
Ohio
35
21
63
339
274
—
1
6
7
14
—
8
15
33
65
Wisconsin
8
9
29
123
107
—
0
2
3
8
—
2
5
12
10
W.N. Central
1
14
34
159
169
—
1
5
16
24
—
7
16
54
56
Iowa
N
0
0
N
N
N
0
0
N
N
—
1
4
5
5
Kansas
N
0
0
N
N
N
0
0
N
N
—
0
3
2
2
Minnesota
—
9
24
101
103
—
0
3
7
6
—
3
5
16
16
Missouri
N
0
0
N
N
—
0
3
5
9
—
3
7
25
31
Nebraska
—
2
8
32
41
—
0
2
3
3
—
0
2
4
1
North Dakota
—
0
4
—
2
—
0
1
—
—
—
0
1
—
1
South Dakota
1
2
6
26
23
—
0
1
1
6
—
0
2
2
—
S. Atlantic
85
58
124
845
793
9
4
13
54
53
21
65
104
401
596
Delaware
—
0
3
6
10
—
0
1
—
—
—
0
6
3
7
District of Columbia
2
1
4
12
9
—
0
1
—
1
—
3
10
32
34
Florida
40
18
59
311
248
5
1
6
20
19
4
25
36
179
243
Georgia
10
15
44
229
220
1
1
6
16
11
7
11
31
65
112
Maryland
13
7
25
121
118
1
0
5
6
6
—
8
15
56
57
North Carolina
N
0
0
N
N
N
0
0
N
N
—
3
14
—
68
South Carolina
19
6
17
104
114
1
0
3
3
4
—
4
9
25
37
Virginia
N
0
0
N
N
—
0
5
6
6
10
4
40
41
37
West Virginia
1
6
33
62
74
1
0
2
3
6
—
0
2
—
1
E.S. Central
17
22
56
330
323
—
2
5
15
24
1
14
25
58
115
Alabama
1
2
10
48
26
—
0
3
5
—
—
4
10
10
32
Kentucky
4
4
12
66
49
—
0
1
—
1
1
2
9
11
18
Mississippi
1
3
12
52
49
—
0
2
3
8
—
2
12
14
24
Tennessee
11
12
37
164
199
—
0
3
7
15
—
5
14
23
41
W.S. Central
49
27
332
420
366
4
3
22
24
38
6
43
66
243
357
Arkansas
9
3
23
60
43
1
0
2
1
6
3
3
13
24
50
Louisiana
—
4
14
55
54
—
0
4
4
4
1
6
20
24
35
Oklahoma
N
0
0
N
N
—
0
4
2
6
2
2
5
16
17
Texas
40
20
309
305
269
3
2
22
17
22
—
33
48
179
255
Mountain
22
28
58
395
427
1
2
7
18
32
—
12
25
60
95
Arizona
14
9
40
212
184
—
1
3
9
16
—
3
8
2
36
Colorado
—
6
22
47
83
—
0
3
—
5
—
4
12
29
28
Idaho
N
0
0
N
N
—
0
1
1
—
—
0
4
1
5
Montana
2
0
4
8
14
—
0
1
2
—
—
0
1
1
—
Nevada
1
1
8
29
28
1
0
2
1
3
—
2
8
16
13
New Mexico
5
5
17
80
65
—
0
4
3
6
—
2
5
7
9
Utah
—
3
10
15
49
—
0
3
2
2
—
1
3
4
4
Wyoming
—
0
2
4
4
—
0
1
—
—
—
0
1
—
—
Pacific
1
4
10
22
32
—
0
2
4
7
21
70
101
517
561
Alaska
—
3
8
17
21
—
0
1
3
7
—
0
2
3
3
California
N
0
0
N
N
N
0
0
N
N
14
60
83
458
475
Hawaii
1
1
6
5
11
—
0
1
1
—
—
0
2
1
2
Oregon
N
0
0
N
N
N
0
0
N
N
6
4
11
40
22
Washington
N
0
0
N
N
N
0
0
N
N
1
5
13
15
59
Territories
American Samoa
N
0
0
N
N
—
0
0
—
—
—
0
0
—
—
C.N.M.I.
—
—
—
—
—
—
—
—
—
—
—
—
—
—
—
Guam
—
—
—
—
—
—
—
—
—
—
—
—
—
—
—
Puerto Rico
—
0
0
—
—
—
0
0
—
—
5
7
17
59
35
U.S. Virgin Islands
—
0
0
—
—
—
0
0
—
—
—
0
0
—
—
C.N.M.I.: Commonwealth of Northern Mariana Islands.
U: Unavailable. —: No reported cases. N: Not reportable. NN: Not Nationally Notifiable. Cum: Cumulative year-to-date counts. Med: Median. Max: Maximum.
† Includes drug resistant and susceptible cases of invasive Streptococcus pneumoniae disease among children <5 years and among all ages. Case definition: Isolation of S. pneumoniae from a normally sterile body site (e.g., blood or cerebrospinal fluid).
TABLE II. (Continued) Provisional cases of selected notifiable diseases, United States, weeks ending March 2, 2013, and March 3, 2012 (9th week)*
Reporting area
Varicella (chickenpox)
West Nile virus disease†
Neuroinvasive
Nonneuroinvasive§
Current week
Previous 52 weeks
Cum 2013
Cum 2012
Current week
Previous 52 weeks
Cum 2013
Cum 2012
Current week
Previous 52 weeks
Cum 2013
Cum 2012
Med
Max
Med
Max
Med
Max
United States
88
225
383
1,258
2,688
—
4
322
—
1
—
4
340
—
—
New England
6
22
55
100
261
—
0
8
—
—
—
0
5
—
—
Connecticut
1
5
10
37
41
—
0
2
—
—
—
0
3
—
—
Maine
5
4
15
25
62
—
0
1
—
—
—
0
0
—
—
Massachusetts
—
8
21
23
102
—
0
7
—
—
—
0
3
—
—
New Hampshire
—
2
8
9
26
—
0
1
—
—
—
0
0
—
—
Rhode Island
—
0
9
1
4
—
0
1
—
—
—
0
1
—
—
Vermont
—
2
13
5
26
—
0
1
—
—
—
0
1
—
—
Mid. Atlantic
12
19
47
108
291
—
0
19
—
—
—
0
18
—
—
New Jersey
—
5
25
—
112
—
0
5
—
—
—
0
4
—
—
New York (Upstate)
N
0
0
N
N
—
0
6
—
—
—
0
8
—
—
New York City
—
0
0
—
—
—
0
5
—
—
—
0
2
—
—
Pennsylvania
12
15
33
108
179
—
0
5
—
—
—
0
4
—
—
E.N. Central
26
65
145
423
679
—
0
92
—
—
—
0
39
—
—
Illinois
2
16
36
97
169
—
0
31
—
—
—
0
18
—
—
Indiana
3
8
26
48
72
—
0
8
—
—
—
0
6
—
—
Michigan
4
16
62
84
172
—
0
33
—
—
—
0
12
—
—
Ohio
15
15
33
145
182
—
0
19
—
—
—
0
12
—
—
Wisconsin
2
7
24
49
84
—
0
11
—
—
—
0
3
—
—
W.N. Central
—
7
39
20
183
—
0
36
—
—
—
0
59
—
—
Iowa
N
0
0
N
N
—
0
3
—
—
—
0
5
—
—
Kansas
—
0
5
—
85
—
0
3
—
—
—
0
6
—
—
Minnesota
—
0
0
—
—
—
0
6
—
—
—
0
7
—
—
Missouri
—
6
36
10
83
—
0
4
—
—
—
0
1
—
—
Nebraska
—
0
5
—
6
—
0
8
—
—
—
0
22
—
—
North Dakota
—
1
5
8
3
—
0
8
—
—
—
0
11
—
—
South Dakota
—
0
3
2
6
—
0
17
—
—
—
0
28
—
—
S. Atlantic
18
25
76
199
346
—
0
21
—
—
—
0
20
—
—
Delaware
—
0
1
—
2
—
0
1
—
—
—
0
2
—
—
District of Columbia
—
0
4
—
3
—
0
3
—
—
—
0
1
—
—
Florida
14
13
49
128
181
—
0
5
—
—
—
0
5
—
—
Georgia
—
1
9
11
3
—
0
6
—
—
—
0
10
—
—
Maryland
N
0
0
N
N
—
0
5
—
—
—
0
4
—
—
North Carolina
N
0
0
N
N
—
0
3
—
—
—
0
0
—
—
South Carolina
3
0
5
13
—
—
0
5
—
—
—
0
2
—
—
Virginia
1
9
21
35
86
—
0
4
—
—
—
0
3
—
—
West Virginia
—
2
12
12
71
—
0
1
—
—
—
0
3
—
—
E.S. Central
5
3
13
28
42
—
0
20
—
—
—
0
22
—
—
Alabama
5
3
12
28
38
—
0
7
—
—
—
0
4
—
—
Kentucky
N
0
0
N
N
—
0
4
—
—
—
0
2
—
—
Mississippi
—
0
1
—
4
—
0
12
—
—
—
0
17
—
—
Tennessee
N
0
0
N
N
—
0
4
—
—
—
0
2
—
—
W.S. Central
20
40
164
254
517
—
1
144
—
1
—
1
165
—
—
Arkansas
—
4
19
18
35
—
0
9
—
—
—
0
3
—
—
Louisiana
—
1
12
8
30
—
0
18
—
—
—
0
26
—
—
Oklahoma
N
0
0
N
N
—
0
24
—
—
—
0
22
—
—
Texas
20
36
162
228
452
—
1
104
—
1
—
1
130
—
—
Mountain
—
24
62
116
346
—
0
37
—
—
—
0
22
—
—
Arizona
—
8
21
5
107
—
0
10
—
—
—
0
6
—
—
Colorado
—
8
25
46
115
—
0
17
—
—
—
0
13
—
—
Idaho
N
0
0
N
N
—
0
1
—
—
—
0
3
—
—
Montana
—
2
8
16
24
—
0
1
—
—
—
0
2
—
—
Nevada
N
0
0
N
N
—
0
1
—
—
—
0
2
—
—
New Mexico
—
1
8
11
29
—
0
9
—
—
—
0
5
—
—
Utah
—
5
15
38
66
—
0
1
—
—
—
0
1
—
—
Wyoming
—
0
3
—
5
—
0
1
—
—
—
0
2
—
—
Pacific
1
2
8
10
23
—
0
33
—
—
—
0
27
—
—
Alaska
1
1
4
8
9
—
0
0
—
—
—
0
0
—
—
California
—
0
4
1
6
—
0
33
—
—
—
0
26
—
—
Hawaii
—
1
2
1
8
—
0
0
—
—
—
0
0
—
—
Oregon
N
0
0
N
N
—
0
0
—
—
—
0
2
—
—
Washington
N
0
0
N
N
—
0
4
—
—
—
0
0
—
—
Territories
American Samoa
N
0
0
N
N
—
0
0
—
—
—
0
0
—
—
C.N.M.I.
—
—
—
—
—
—
—
—
—
—
—
—
—
—
—
Guam
—
—
—
—
—
—
—
—
—
—
—
—
—
—
—
Puerto Rico
—
0
5
—
38
—
0
0
—
—
—
0
0
—
—
U.S. Virgin Islands
—
0
0
—
—
—
0
0
—
—
—
0
0
—
—
C.N.M.I.: Commonwealth of Northern Mariana Islands.
U: Unavailable. —: No reported cases. N: Not reportable. NN: Not Nationally Notifiable. Cum: Cumulative year-to-date counts. Med: Median. Max: Maximum.
† Updated weekly from reports to the Division of Vector-Borne Infectious Diseases, National Center for Zoonotic, Vector-Borne, and Enteric Diseases (ArboNET Surveillance). Data for California serogroup, eastern equine, Powassan, St. Louis, and western equine diseases are available in Table I.
§ Not reportable in all states. Data from states where the condition is not reportable are excluded from this table, except starting in 2007 for the domestic arboviral diseases and influenza-associated pediatric mortality, and in 2003 for SARS-CoV. Reporting exceptions are available at http://wwwn.cdc.gov/nndss/document/SRCA_FINAL_REPORT_2006-2010.xlsx.
TABLE III. Deaths in 122 U.S. cities,* week ending March 2, 2013 (9th week)
Reporting area
All causes, by age (years)
P&I† Total
Reporting area (Continued)
All causes, by age (years)
P&I† Total
All Ages
=65
45–64
25–44
1–24
<1
All Ages
=65
45–64
25–44
1–24
<1
New England
590
427
118
24
13
8
65
S. Atlantic
1,050
686
265
41
28
30
70
Boston, MA
153
101
40
7
2
3
17
Atlanta, GA
177
111
41
11
9
5
7
Bridgeport, CT
30
23
4
1
1
1
4
Baltimore, MD
176
99
57
8
7
5
14
Cambridge, MA
21
16
4
1
—
—
5
Charlotte, NC
146
104
29
5
2
6
15
Fall River, MA
24
20
4
—
—
—
2
Jacksonville, FL
142
100
37
3
—
2
8
Hartford, CT
61
45
9
4
2
1
7
Miami, FL
58
47
10
—
1
—
2
Lowell, MA
28
24
2
2
—
—
4
Norfolk, VA
55
41
9
2
1
2
—
Lynn, MA
8
5
2
—
1
—
1
Richmond, VA
66
39
23
2
2
—
3
New Bedford, MA
27
21
4
1
1
—
3
Savannah, GA
69
44
15
5
3
2
4
New Haven, CT
39
26
10
2
1
—
1
St. Petersburg, FL
52
35
14
1
1
1
4
Providence, RI
63
54
7
1
—
1
8
Tampa, FL
8
6
2
—
—
—
1
Somerville, MA
3
2
1
—
—
—
—
Washington, D.C.
91
52
26
4
2
7
11
Springfield, MA
35
20
9
2
3
1
2
Wilmington, DE
10
8
2
—
—
—
1
Waterbury, CT
25
18
4
2
1
—
5
E.S. Central
969
646
244
51
11
17
70
Worcester, MA
73
52
18
1
1
1
6
Birmingham, AL
144
98
34
7
2
3
17
Mid. Atlantic
1,934
1,394
394
90
35
21
113
Chattanooga, TN
86
56
22
7
—
1
4
Albany, NY
52
44
4
2
1
1
1
Knoxville, TN
110
75
30
2
3
—
13
Allentown, PA
31
21
9
1
—
—
1
Lexington, KY
96
70
17
2
1
6
4
Buffalo, NY
92
61
22
5
3
1
7
Memphis, TN
205
133
61
8
1
2
21
Camden, NJ
18
9
3
4
1
1
2
Mobile, AL
80
54
21
5
—
—
2
Elizabeth, NJ
16
11
4
1
—
—
—
Montgomery, AL
53
34
12
5
2
—
3
Erie, PA
60
56
3
—
—
1
5
Nashville, TN
195
126
47
15
2
5
6
Jersey City, NJ
17
13
3
1
—
—
2
W.S. Central
1,648
1,078
380
120
36
32
95
New York City, NY
1,239
881
262
62
22
12
64
Austin, TX
84
65
12
2
3
2
6
Newark, NJ
28
13
10
2
2
1
1
Baton Rouge, LA
96
66
17
10
1
2
5
Paterson, NJ
18
10
5
1
2
—
—
Corpus Christi, TX
60
38
14
4
4
—
7
Philadelphia, PA
U
U
U
U
U
U
U
Dallas, TX
226
141
55
15
5
8
8
Pittsburgh, PA§
46
44
2
—
—
—
5
El Paso, TX
123
85
25
10
2
1
6
Reading, PA
35
27
5
2
—
1
4
Fort Worth, TX
U
U
U
U
U
U
U
Rochester, NY
103
73
26
4
—
—
8
Houston, TX
435
256
131
38
5
5
16
Schenectady, NY
25
16
6
1
2
—
3
Little Rock, AR
127
82
32
10
3
—
9
Scranton, PA
29
21
6
1
1
—
2
New Orleans, LA
34
15
10
8
—
1
—
Syracuse, NY
76
56
16
1
1
2
6
San Antonio, TX
319
224
58
21
8
8
25
Trenton, NJ
10
6
2
1
—
1
—
Shreveport, LA
57
35
13
1
3
5
4
Utica, NY
11
9
2
—
—
—
—
Tulsa, OK
87
71
13
1
2
—
9
Yonkers, NY
28
23
4
1
—
—
2
Mountain
1,257
858
298
68
18
14
94
E.N. Central
1,959
1,321
462
105
33
38
151
Albuquerque, NM
120
85
27
6
1
1
11
Akron, OH
49
32
12
2
—
3
3
Boise, ID
58
37
19
2
—
—
3
Canton, OH
42
27
14
1
—
—
6
Colorado Springs, CO
117
79
25
7
5
1
5
Chicago, IL
U
U
U
U
U
U
U
Denver, CO
93
64
20
4
2
3
9
Cincinnati, OH
88
46
27
8
2
5
3
Las Vegas, NV
311
220
75
12
3
1
28
Cleveland, OH
313
225
70
11
2
5
21
Ogden, UT
22
16
3
3
—
—
5
Columbus, OH
319
213
81
15
5
5
26
Phoenix, AZ
174
108
50
12
2
1
15
Dayton, OH
142
110
23
6
2
1
19
Pueblo, CO
30
19
8
3
—
—
—
Detroit, MI
167
100
45
14
4
4
10
Salt Lake City, UT
152
99
31
11
4
7
12
Evansville, IN
53
40
11
2
—
—
11
Tucson, AZ
180
131
40
8
1
—
6
Fort Wayne, IN
75
52
14
6
1
2
1
Pacific
2,071
1,475
430
102
38
25
227
Gary, IN
17
8
5
2
1
1
—
Berkeley, CA
25
19
5
1
—
—
1
Grand Rapids, MI
57
46
11
—
—
—
8
Fresno, CA
147
120
16
9
1
1
16
Indianapolis, IN
226
137
62
14
6
7
24
Glendale, CA
45
37
6
1
1
—
10
Lansing, MI
37
20
10
4
2
1
—
Honolulu, HI
100
77
15
4
3
1
13
Milwaukee, WI
66
44
17
4
1
—
2
Long Beach, CA
82
58
18
3
1
2
16
Peoria, IL
42
27
9
4
1
1
4
Los Angeles, CA
307
203
80
15
6
3
29
Rockford, IL
52
34
15
1
1
1
3
Pasadena, CA
36
30
5
—
—
1
7
South Bend, IN
53
42
6
2
3
—
4
Portland, OR
146
102
37
4
2
1
5
Toledo, OH
94
61
22
7
2
2
2
Sacramento, CA
232
151
61
13
3
3
20
Youngstown, OH
67
57
8
2
—
—
4
San Diego, CA
216
155
41
12
3
5
25
W.N. Central
679
424
193
29
10
22
55
San Francisco, CA
128
96
26
5
1
—
21
Des Moines, IA
84
56
19
3
—
6
10
San Jose, CA
236
182
41
6
4
3
29
Duluth, MN
25
16
7
1
—
1
3
Santa Cruz, CA
46
37
6
2
1
—
4
Kansas City, KS
24
11
11
1
1
—
1
Seattle, WA
133
81
41
6
3
2
7
Kansas City, MO
80
51
22
1
4
1
6
Spokane, WA
66
46
16
2
—
2
10
Lincoln, NE
53
39
13
1
—
—
—
Tacoma, WA
126
81
16
19
9
1
14
Minneapolis, MN
86
49
25
3
1
8
10
Total¶
12,157
8,309
2,784
630
222
207
940
Omaha, NE
93
68
22
3
—
—
15
St. Louis, MO
100
47
41
5
3
4
3
St. Paul, MN
53
33
13
5
—
2
2
Wichita, KS
81
54
20
6
1
—
5
U: Unavailable. —: No reported cases.
* Mortality data in this table are voluntarily reported from 122 cities in the United States, most of which have populations of >100,000. A death is reported by the place of its occurrence and by the week that the death certificate was filed. Fetal deaths are not included.
† Pneumonia and influenza.
§ Because of changes in reporting methods in this Pennsylvania city, these numbers are partial counts for the current week. Complete counts will be available in 4 to 6 weeks.