|
Persons using assistive technology might not be able to fully access information in this file. For assistance, please send e-mail to: mmwrq@cdc.gov. Type 508 Accommodation and the title of the report in the subject line of e-mail. QuickStats: Percentage of Adults Aged =18 Years Who Often Felt Worried, Nervous, or Anxious,* by Sex and Age Group — National Health Interview Survey, United States, 2010–2011†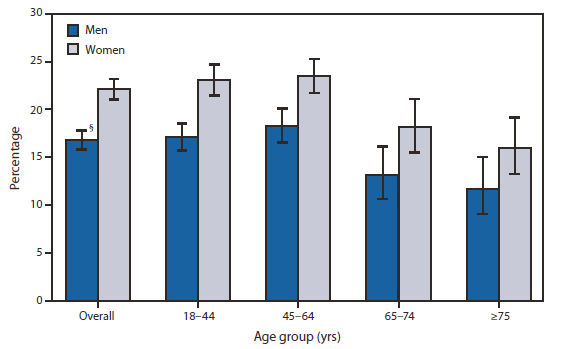
* Based on a survey question that asked respondents, "How often do you feel worried, nervous, or anxious? Would you say daily, weekly, monthly, a few times a year, or never?" Persons reporting daily or weekly feelings of worry, nervousness, or anxiety were categorized as often worried, nervous, or anxious. Unknowns were not included in the denominators when calculating percentages. † Estimates are based on household interviews of a sample of the U.S. civilian, noninstitutionalized population. § 95% confidence interval. During 2010–2011, women (22.1%) were more likely than men (16.8%) to often feel worried, nervous, or anxious. Among men, those aged 45–64 years were about as likely (18.2%) as men aged 18–44 years (17.1%) but more likely than men aged 65–74 years (13.2%) and =75 years (11.7%) to often have feelings of worry, nervousness, or anxiety. Women aged 18–44 years were about as likely (23.0%) as women aged 45–64 years (23.5%) but more likely than women aged 65–74 years (18.1%) and women aged =75 years (16.0%) to often feel worried, nervous, or anxious. Source: National Health Interview Survey, 2010 Quality of Life and 2011 Functioning and Disability supplements. Data were colleccted from a subset of the adults randomly selected for the sample adult component of the NHIS questionnaire. Available at http://www.cdc.gov/nchs/nhis.htm. Reported by: Debra Blackwell, PhD, debra.blackwell@cdc.hhs.gov, 301-458-4103; Tainya C. Clarke MS, MPH. Alternate Text: The figure above shows the percentage of adults aged =18 years who often felt worried, nervous, or anxious, by sex and age group in the United States during 2010-2011, according to the National Health Interview Survey. During 2010-2011, women (22.1%) were more likely than men (16.8%) to often feel worried, nervous, or anxious. Among men, those aged 45-64 years were about as likely (18.2%) as men aged 18-44 years (17.1%), but more likely than men aged 65-74 years (13.2%) and =75 years (11.7%) to often have feelings of worry, nervousness, or anxiety. Women aged 18-44 years were about as likely (23.0%) as women aged 45-64 years (23.5%), but more likely than women aged 65-74 years (18.1%) and women aged =75 years (16.0%) to often feel worried, nervous, or anxious. Syndicated Content Details:
Source URL: http://www.cdc.gov/mmwr/preview/mmwrhtml/mm6210a7.htm Source Agency: Centers for Disease Control and Prevention (CDC) Captured Date: 2016-05-23 22:19:43.0
|