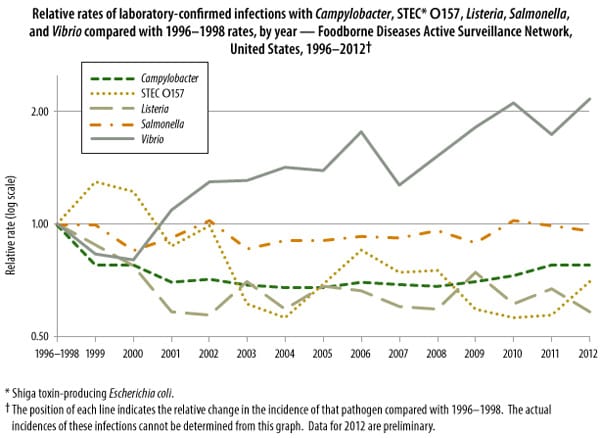
Trends in Foodborne Illness in the United States, 2012

<< Back to Feature

Figure 2. Relative rates of laboratory-confirmed infections with Campylobacter, STEC* O157, Listeria, Salmonella, and Vibrio compared with 1996–1998 rates, by year — Foodborne Diseases Active Surveillance Network, United States, 1996–2012

Figure 2. Relative rates of laboratory-confirmed infections with Campylobacter, STEC* O157, Listeria, Salmonella, and Vibrio compared with 1996–1998 rates, by year — Foodborne Diseases Active Surveillance Network, United States, 1996–2012

  Campylobacter STEC O157 Listeria Salmonella Vibrio
1996-1998 1.00 1.00 1.00 1.00 1.00
1999 0.78 1.3 0.88 1 0.83
2000 0.78 1.22 0.77 0.85 0.8
2001 0.7 0.87 0.58 0.92 1.09
2002 0.71 0.99 0.57 1.02 1.3
2003 0.69 0.61 0.7 0.86 1.31
2004 0.68 0.56 0.59 0.91 1.42
2005 0.68 0.69 0.68 0.91 1.39
2006 0.7 0.85 0.66 0.93 1.77
2007 0.69 0.74 0.6 0.92 1.27
2008 0.68 0.75 0.59 0.96 1.52
2009 0.7 0.59 0.74 0.89 1.82
2010 0.73 0.56 0.61 1.02 2.11
2011 0.78 0.57 0.67 0.99 1.74
2012 0.78 0.7 0.58 0.96 2.16
Syndicated Content Details:
Source URL: http://www.cdc.gov/Features/dsfoodnet2012/figure2.html
Source Agency: Centers for Disease Control and Prevention (CDC)
Captured Date: 2014-02-01 02:20:20.0


Terms of Use | Privacy Policy
©2017 ARCHES Technology. All Rights Reserved.