Persons using assistive technology might not be able to fully access information in this file. For assistance, please send e-mail to: mmwrq@cdc.gov. Type 508 Accommodation and the title of the report in the subject line of e-mail.
Notifiable Diseases and Mortality Tables
Table I Summary of provisional cases of selected notifiable diseases, United States, cumulative, week ending April 20, 2013 (16th Week)
Figure I Selected notifiable disease reports, United States, comparison of provisional 4-week totals ending April 20, 2013, with historical data
Table II Provisional cases of selected notifiable diseases, United States, weeks ending April 20, 2013 and April 21, 2012 (16th Week)
Table III Deaths in 122 U.S. cities, week ending April 20, 2013 (16th Week)
TABLE I. Provisional cases of infrequently reported notifiable diseases (<1,000 cases reported during the preceding year) — United States, week ending April 20, 2013 (16th week)*
NY (1), NYC (1), PA (1), DE (1), VA (1), FL (2), LA (1), ID (1)
Novel influenza A virus infections***
—
—
123
313
14
4
43,774
2
Plague
—
—
0
3
3
2
8
3
Poliomyelitis, paralytic
—
—
—
—
—
—
1
—
Polio virus Infection, nonparalytic§
—
—
—
—
—
—
—
—
Psittacosis§
—
—
0
2
2
4
9
8
Q fever, total§
1
16
3
134
134
131
113
120
acute
1
11
2
112
110
106
93
106
CA (1)
chronic
—
5
0
22
24
25
20
14
Rabies, human
—
—
0
1
6
2
4
2
Rubella†††
—
3
0
9
4
5
3
16
Rubella, congenital syndrome
—
—
—
2
—
—
2
—
SARS-CoV§
—
—
—
—
—
—
—
—
Smallpox§
—
—
—
—
—
—
—
—
Streptococcal toxic-shock syndrome§
2
38
4
127
168
142
161
157
NY (1), MI (1)
Syphilis, congenital (age <1 yr)§§§
—
28
6
289
360
377
423
431
Tetanus
—
6
1
36
36
26
18
19
Toxic-shock syndrome (staphylococcal)§
2
19
1
66
78
82
74
71
PA (1), MI (1)
Trichinellosis
1
11
0
19
15
7
13
39
NY (1)
Tularemia
—
6
2
164
166
124
93
123
Typhoid fever
1
63
7
324
390
467
397
449
VA (1)
Vancomycin-intermediate Staphylococcus aureus§
2
21
2
123
82
91
78
63
OH (1), MI (1)
Vancomycin-resistant Staphylococcus aureus§
—
—
—
1
—
2
1
—
Vibriosis (noncholera Vibrio species infections)§
4
75
9
974
832
846
789
588
MD (1), FL (3)
Viral hemorrhagic fever¶¶¶
—
—
—
—
—
1
NN
NN
Yellow fever
—
—
—
—
—
—
—
—
See Table 1 footnotes on next page.
TABLE I. (Continued) Provisional cases of infrequently reported notifiable diseases (<1,000 cases reported during the preceding year) — United States, week ending April 20, 2013 (16th week)*
—: No reported cases. N: Not reportable. NN: Not Nationally Notifiable. Cum: Cumulative year-to-date counts.
† Calculated by summing the incidence counts for the current week, the 2 weeks preceding the current week, and the 2 weeks following the current week, for a total of 5 preceding years. The total sum of incident cases is then divided by 25 weeks. Additional information is available at http://wwwn.cdc.gov/nndss/document/5yearweeklyaverage.pdf.
§ Not reportable in all states. Data from states where the condition is not reportable are excluded from this table except starting in 2007 for the arboviral diseases, STD data, TB data, and influenza-associated pediatric mortality, and in 2003 for SARS-CoV. Reporting exceptions are available at http://wwwn.cdc.gov/nndss/document/SRCA_FINAL_REPORT_2006-2010.xlsx.
¶ Includes both neuroinvasive and nonneuroinvasive. Updated weekly from reports to the Division of Vector-Borne Infectious Diseases, National Center for Zoonotic, Vector-Borne, and Enteric Diseases (ArboNET Surveillance). Data for West Nile virus are available in Table II.
** Data for H. influenzae (all ages, all serotypes) are available in Table II.
†† Updated weekly from reports to the Influenza Division, National Center for Immunization and Respiratory Diseases. Since September 30, 2012, 131 influenza-associated pediatric deaths occurring during the 2012-13 influenza season have been reported.
§§ No measles cases were reported for the current week.
¶¶ Data for meningococcal disease (all serogroups) are available in Table II.
*** CDC discontinued reporting of individual confirmed and probable cases of 2009 pandemic influenza A (H1N1) virus infections on July 24, 2009. During 2009, four cases of human infection with novel influenza A viruses, different from the 2009 pandemic influenza A (H1N1) strain, were reported to CDC. The four cases of novel influenza A virus infection reported to CDC during 2010, the fourteen cases reported during 2011, and the 313 cases reported in 2012 are different from the 2009 pandemic influenza A (H1N1) virus. Total case counts are provided by the Influenza Division, National Center for Immunization and Respiratory Diseases (NCIRD).
††† No rubella cases were reported for the current week.
§§§ Updated weekly from reports to the Division of STD Prevention, National Center for HIV/AIDS, Viral Hepatitis, STD, and TB Prevention.
¶¶¶ There were no cases of viral hemorrhagic fever reported during the current week. See Table II for dengue hemorrhagic fever.
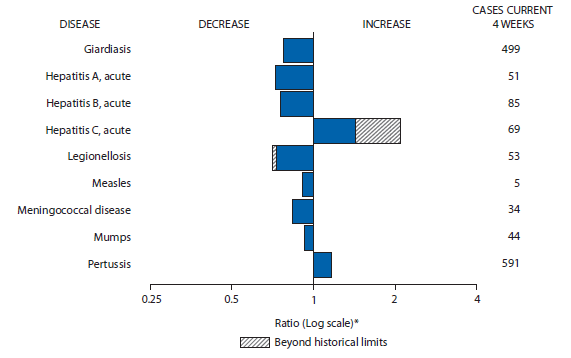
FIGURE I. Selected notifiable disease reports, United States, comparison of provisional 4-week totals April 20, 2013, with historical data
* Ratio of current 4-week total to mean of 15 4-week totals (from previous, comparable, and subsequent 4-week periods for the past 5 years). The point where the hatched area begins is based on the mean and two standard deviations of these 4-week totals.
Alternate Text: The figure above shows selected notifiable disease reports for the United States, with comparison of provisional 4-week totals through April 20, 2013, with historical data. Reports of acute hepatitis C and pertussis increased, with acute hepatitis C increasing beyond historical limits. Reports of giardiasis, acute hepatitis A, acute hepatitis B, legionellosis, measles, meningococcal disease, and mumps all decreased, with legionellosis decreasing beyond historical limits.
TABLE II. Provisional cases of selected notifiable diseases, United States, weeks ending April 20, 2013, and April 21, 2012 (16th week)*
Reporting area
Chlamydia trachomatis infection
Coccidioidomycosis
Cryptosporidiosis
Current week
Previous 52 weeks
Cum 2013
Cum 2012
Current week
Previous 52 weeks
Cum 2013
Cum 2012
Current week
Previous 52 weeks
Cum 2013
Cum 2012
Med
Max
Med
Max
Med
Max
United States
11,370
26,716
30,789
374,586
436,637
70
228
439
1,841
6,234
46
112
288
1,277
1,831
New England
121
953
1,340
13,199
14,701
—
0
1
1
1
—
7
19
46
84
Connecticut
—
247
560
2,983
3,782
N
0
0
N
N
—
1
3
4
10
Maine
—
64
102
809
1,044
N
0
0
N
N
—
1
4
6
14
Massachusetts
—
470
706
6,673
6,889
—
0
0
—
—
—
2
8
25
39
New Hampshire
5
58
83
787
1,012
—
0
1
1
—
—
1
4
4
11
Rhode Island
99
82
160
1,364
1,555
—
0
0
—
1
—
0
3
1
2
Vermont
17
34
110
583
419
N
0
0
N
N
—
1
6
6
8
Mid. Atlantic
1,818
3,479
4,502
51,642
56,286
—
0
1
—
3
9
12
40
126
181
New Jersey
187
539
647
8,193
8,729
N
0
0
N
N
—
0
4
6
10
New York (Upstate)
748
725
1,917
10,823
10,794
N
0
0
N
N
4
3
16
32
28
New York City
—
1,143
1,278
13,494
19,340
N
0
0
N
N
—
1
8
11
31
Pennsylvania
883
1,059
1,992
19,132
17,423
—
0
1
—
3
5
6
20
77
112
E.N. Central
1,459
4,327
4,774
53,949
69,028
—
1
4
7
15
13
27
110
280
487
Illinois
22
1,296
1,507
11,703
21,516
N
0
0
N
N
—
3
8
18
51
Indiana
208
572
838
8,016
8,912
N
0
0
N
N
—
2
8
25
60
Michigan
587
910
1,303
12,787
14,634
—
0
2
3
8
2
5
40
53
86
Ohio
350
1,046
1,207
14,360
16,476
—
0
2
2
6
7
9
28
99
163
Wisconsin
292
467
553
7,083
7,490
—
0
1
2
1
4
8
43
85
127
W.N. Central
271
1,551
1,799
19,752
25,758
—
1
8
3
36
—
16
42
152
222
Iowa
19
210
255
2,833
3,689
N
0
0
N
N
—
4
22
37
75
Kansas
32
212
256
2,960
3,608
N
0
0
N
N
—
2
6
21
38
Minnesota
7
342
436
3,244
5,426
—
1
7
2
32
—
0
0
—
—
Missouri
194
542
657
7,764
8,729
—
0
1
1
3
—
4
12
44
44
Nebraska
—
119
186
1,115
2,204
—
0
0
—
1
—
2
10
14
19
North Dakota
1
50
73
678
867
—
0
0
—
—
—
0
3
6
10
South Dakota
18
76
109
1,158
1,235
N
0
0
N
N
—
2
6
30
36
S. Atlantic
2,829
5,266
6,539
75,838
88,821
—
0
1
1
2
7
19
54
285
372
Delaware
69
92
322
1,754
1,144
—
0
1
—
—
—
0
2
2
6
District of Columbia
—
132
283
2,168
2,128
—
0
0
—
—
N
0
0
N
N
Florida
966
1,524
1,775
23,558
24,383
N
0
0
N
N
4
8
24
87
135
Georgia
760
959
1,246
13,850
17,845
N
0
0
N
N
—
5
14
75
92
Maryland
—
458
1,211
5,141
6,394
—
0
1
1
2
3
1
5
17
33
North Carolina
—
804
1,771
8,654
15,038
N
0
0
N
N
—
0
28
44
35
South Carolina
483
527
905
8,523
8,899
N
0
0
N
N
—
1
4
23
24
Virginia
437
655
1,018
10,671
11,495
N
0
0
N
N
—
2
7
33
43
West Virginia
114
90
149
1,519
1,495
N
0
0
N
N
—
0
3
4
4
E.S. Central
1,252
1,931
2,559
27,288
32,821
—
0
0
—
—
1
4
14
63
79
Alabama
411
566
862
8,598
9,319
N
0
0
N
N
—
2
6
30
31
Kentucky
268
331
787
5,200
5,044
N
0
0
N
N
1
1
4
11
12
Mississippi
360
375
765
6,041
7,899
N
0
0
N
N
—
0
4
10
12
Tennessee
213
608
735
7,449
10,559
N
0
0
N
N
—
1
5
12
24
W.S. Central
1,108
3,492
5,739
51,815
51,877
—
0
1
2
—
4
10
42
118
111
Arkansas
249
329
394
5,116
5,305
N
0
0
N
N
—
1
5
5
10
Louisiana
546
494
2,017
4,682
4,117
—
0
1
2
—
—
3
7
46
24
Oklahoma
313
109
2,373
5,784
3,646
N
0
0
N
N
2
1
13
18
22
Texas
—
2,473
3,709
36,233
38,809
N
0
0
N
N
2
5
27
49
55
Mountain
805
1,660
1,981
19,732
28,517
57
166
360
1,266
4,544
3
12
48
85
145
Arizona
—
529
769
969
9,738
57
161
356
1,240
4,463
—
1
4
8
7
Colorado
355
413
582
6,356
6,896
N
0
0
N
N
—
1
7
5
20
Idaho
90
86
198
1,592
1,450
N
0
0
N
N
2
3
25
24
25
Montana
36
1
92
1,087
1
—
0
1
—
1
1
1
4
10
24
Nevada
169
217
325
3,316
3,490
—
1
6
12
39
—
0
2
4
4
New Mexico
138
219
459
4,101
3,844
—
0
3
7
20
—
1
4
7
35
Utah
17
146
182
1,945
2,516
—
1
4
6
19
—
2
22
26
21
Wyoming
—
37
67
366
582
—
0
1
1
2
—
0
4
1
9
Pacific
1,707
4,170
5,183
61,371
68,828
13
65
89
561
1,633
9
11
27
122
150
Alaska
47
104
149
1,709
1,789
N
0
0
N
N
—
0
1
—
—
California
1,027
3,206
4,192
46,619
53,054
13
65
89
560
1,632
3
6
14
63
70
Hawaii
—
123
152
1,345
1,888
N
0
0
N
N
—
0
1
—
1
Oregon
283
259
377
4,295
4,560
—
0
1
1
1
3
3
11
40
68
Washington
350
472
632
7,403
7,537
—
0
0
—
—
3
1
22
19
11
Territories
American Samoa
—
12
59
—
—
N
0
0
N
N
N
0
0
N
N
C.N.M.I.
—
—
—
—
—
—
—
—
—
—
—
—
—
—
—
Guam
—
—
—
—
—
—
—
—
—
—
—
—
—
—
—
Puerto Rico
172
111
307
1,891
2,041
N
0
0
N
N
N
0
0
N
N
U.S. Virgin Islands
—
16
25
—
230
—
0
0
—
—
—
0
0
—
—
C.N.M.I.: Commonwealth of Northern Mariana Islands.
U: Unavailable. —: No reported cases. N: Not reportable. NN: Not Nationally Notifiable. Cum: Cumulative year-to-date counts. Med: Median. Max: Maximum.
† Data for meningococcal disease, invasive caused by serogroups A, C, Y, and W-135; serogroup B; other serogroup; and unknown serogroup are available in Table I.
TABLE II. (Continued) Provisional cases of selected notifiable diseases, United States, weeks ending April 20, 2013, and April 21, 2012 (16th week)*
Reporting area
Rabies, animal
Salmonellosis
Shiga toxin-producing E. coli (STEC)†
Current week
Previous 52 weeks
Cum 2013
Cum 2012
Current week
Previous 52 weeks
Cum 2013
Cum 2012
Current week
Previous 52 weeks
Cum 2013
Cum 2012
Med
Max
Med
Max
Med
Max
United States
61
80
141
666
1,126
336
994
1,697
6,954
8,812
31
121
198
698
1,021
New England
3
6
16
78
117
5
37
73
302
390
—
4
9
40
25
Connecticut
—
3
8
34
60
—
7
19
66
94
—
1
4
9
8
Maine
3
1
4
16
35
1
3
11
22
20
—
0
4
6
—
Massachusetts
—
0
0
—
—
—
20
54
159
213
—
2
6
14
16
New Hampshire
—
1
3
10
4
1
3
9
23
20
—
0
4
7
—
Rhode Island
—
0
5
3
7
3
1
7
16
22
—
0
1
—
—
Vermont
—
1
7
15
11
—
1
7
16
21
—
0
3
4
1
Mid. Atlantic
5
18
38
82
240
39
88
188
748
1,072
5
11
24
83
115
New Jersey
—
0
0
—
—
—
16
48
123
262
—
1
6
9
31
New York (Upstate)
5
7
20
82
78
19
22
64
190
248
1
4
15
29
28
New York City
—
0
0
—
—
5
19
49
208
242
—
1
7
17
23
Pennsylvania
—
10
29
—
162
15
29
63
227
320
4
3
12
28
33
E.N. Central
—
1
13
5
21
24
99
237
807
1,128
9
18
77
125
195
Illinois
—
1
6
3
6
—
34
79
249
377
—
4
16
23
35
Indiana
—
0
2
—
—
—
12
40
85
135
—
2
23
16
36
Michigan
—
0
5
1
11
2
16
46
176
196
—
4
41
28
61
Ohio
—
0
7
1
4
22
24
50
230
227
9
4
20
46
27
Wisconsin
N
0
0
N
N
—
13
36
67
193
—
4
21
12
36
W.N. Central
5
3
18
36
56
5
43
108
419
467
—
15
31
80
139
Iowa
—
0
5
—
2
2
10
32
97
91
—
3
15
14
15
Kansas
3
1
5
20
20
3
9
18
73
95
—
1
7
12
17
Minnesota
—
0
0
—
—
—
0
0
—
—
—
0
0
—
—
Missouri
—
0
3
12
8
—
18
48
156
183
—
5
15
37
76
Nebraska
—
0
0
—
—
—
3
26
39
49
—
1
6
7
12
North Dakota
—
0
13
—
7
—
1
5
18
16
—
0
3
4
8
South Dakota
2
1
7
4
19
—
3
9
36
33
—
1
4
6
11
S. Atlantic
12
19
34
271
345
120
280
625
2,077
2,677
12
10
72
136
113
Delaware
—
0
0
—
—
1
2
10
14
27
—
0
3
2
2
District of Columbia
—
0
0
—
—
—
0
3
1
16
—
0
1
—
3
Florida
—
0
13
32
103
68
110
272
973
1,021
8
2
10
55
27
Georgia
—
0
0
—
—
10
43
112
284
420
2
2
7
27
25
Maryland
—
6
17
78
89
10
16
41
171
225
1
1
5
13
10
North Carolina
—
0
0
—
—
7
26
166
274
498
—
1
61
21
19
South Carolina
—
0
0
—
—
11
24
73
150
200
—
0
7
1
5
Virginia
12
11
23
149
131
13
23
48
194
237
1
1
6
11
20
West Virginia
—
1
6
12
22
—
3
15
16
33
—
0
2
6
2
E.S. Central
—
1
5
9
25
10
62
209
407
571
—
5
13
48
58
Alabama
—
1
5
6
20
3
19
59
126
172
—
1
5
11
16
Kentucky
—
0
3
3
4
—
9
50
66
106
—
1
9
11
11
Mississippi
—
0
1
—
1
—
15
65
99
136
—
0
3
6
6
Tennessee
—
0
0
—
—
7
18
63
116
157
—
2
11
20
25
W.S. Central
36
12
61
180
246
73
148
416
824
1,139
1
11
113
29
90
Arkansas
—
0
35
17
58
6
16
229
71
92
—
1
10
10
11
Louisiana
—
0
0
—
—
—
23
59
134
232
—
0
3
2
5
Oklahoma
14
0
23
19
10
15
15
34
129
115
1
2
8
11
12
Texas
22
11
39
144
178
52
91
322
490
700
—
7
96
6
62
Mountain
—
1
16
3
36
7
43
78
406
481
2
11
46
50
107
Arizona
N
0
0
N
N
2
13
24
148
143
—
2
7
8
33
Colorado
—
0
0
—
—
1
9
19
40
128
—
3
9
1
25
Idaho
—
0
15
—
—
1
2
7
28
34
1
1
30
13
15
Montana
N
0
0
N
N
—
2
7
14
19
1
0
5
8
5
Nevada
—
0
4
2
1
1
3
12
44
35
—
0
5
9
6
New Mexico
—
0
3
1
31
2
6
20
74
50
—
1
5
—
12
Utah
—
0
2
—
—
—
4
15
51
63
—
1
15
11
7
Wyoming
—
0
6
—
4
—
1
8
7
9
—
0
3
—
4
Pacific
—
4
14
2
40
53
106
193
964
887
2
15
42
107
179
Alaska
—
0
1
—
5
—
1
5
17
17
N
0
0
N
N
California
—
4
12
—
35
26
71
134
664
618
—
7
21
40
109
Hawaii
—
0
0
—
—
7
4
58
59
33
—
0
5
13
2
Oregon
—
0
2
2
—
8
8
17
102
95
—
3
11
30
44
Washington
—
0
0
—
—
12
13
95
122
124
2
3
34
24
24
Territories
American Samoa
—
0
0
—
—
—
1
2
—
1
—
0
0
—
—
C.N.M.I.
—
—
—
—
—
—
—
—
—
—
—
—
—
—
—
Guam
—
—
—
—
—
—
—
—
—
—
—
—
—
—
—
Puerto Rico
—
0
3
—
25
—
0
4
—
17
—
0
2
—
—
U.S. Virgin Islands
—
0
0
—
—
—
0
0
—
—
—
0
0
—
—
C.N.M.I.: Commonwealth of Northern Mariana Islands.
U: Unavailable. —: No reported cases. N: Not reportable. NN: Not Nationally Notifiable. Cum: Cumulative year-to-date counts. Med: Median. Max: Maximum.
† Illnesses with similar clinical presentation that result from Spotted fever group rickettsia infections are reported as Spotted fever rickettsioses. Rocky Mountain spotted fever (RMSF) caused by Rickettsia rickettsii, is the most common and well-known spotted fever.
TABLE II. (Continued) Provisional cases of selected notifiable diseases, United States, weeks ending April 20, 2013, and April 21, 2012 (16th week)*
Reporting area
Streptococcus pneumoniae,† invasive disease
Syphilis, primary and secondary
All ages
Age <5
Current week
Previous 52 weeks
Cum 2013
Cum 2012
Current week
Previous 52 weeks
Cum 2013
Cum 2012
Current week
Previous 52 weeks
Cum 2013
Cum 2012
Med
Max
Med
Max
Med
Max
United States
226
262
790
5,959
5,946
10
23
47
369
434
79
293
383
3,732
4,421
New England
7
11
55
233
269
—
1
4
12
27
2
7
16
116
147
Connecticut
—
6
21
122
133
—
0
2
5
8
—
0
4
5
22
Maine
6
2
8
48
36
—
0
1
3
1
—
0
5
2
6
Massachusetts
—
0
4
5
19
—
0
3
3
13
—
6
13
88
86
New Hampshire
—
1
5
30
36
—
0
1
1
4
1
0
4
9
12
Rhode Island
—
0
29
1
22
—
0
0
—
1
1
0
4
10
20
Vermont
1
1
6
27
23
—
0
0
—
—
—
0
2
2
1
Mid. Atlantic
43
34
63
653
884
1
2
5
31
34
6
35
55
491
556
New Jersey
—
0
16
8
252
—
0
3
—
11
—
3
8
33
65
New York (Upstate)
38
16
39
333
363
1
1
4
21
17
2
4
32
85
56
New York City
5
14
36
312
269
—
0
3
10
6
—
19
31
232
283
Pennsylvania
N
—
—
N
N
N
0
0
N
N
4
9
19
141
152
E.N. Central
39
57
131
1,237
1,222
—
4
12
49
86
3
30
60
329
536
Illinois
N
0
0
N
N
—
1
3
12
18
—
12
23
105
246
Indiana
—
13
49
212
270
—
0
2
3
11
2
4
10
53
69
Michigan
4
13
30
274
256
—
0
3
16
19
—
5
14
67
90
Ohio
32
21
63
550
509
—
1
6
13
26
—
8
15
86
109
Wisconsin
3
10
29
201
187
—
0
2
5
12
1
2
5
18
22
W.N. Central
1
12
34
229
270
—
2
5
37
35
2
8
17
125
100
Iowa
N
0
0
N
N
N
0
0
N
N
—
1
4
12
14
Kansas
N
0
0
N
N
N
0
0
N
N
—
0
3
6
5
Minnesota
—
7
24
129
165
—
0
3
11
9
1
3
5
38
29
Missouri
N
0
0
N
N
—
1
3
14
14
1
3
9
58
49
Nebraska
—
1
7
51
64
—
0
1
5
4
—
0
2
7
2
North Dakota
—
0
4
2
6
—
0
1
2
—
—
0
1
1
1
South Dakota
1
2
6
47
35
—
0
1
5
8
—
0
2
3
—
S. Atlantic
60
61
138
1,537
1,312
2
5
14
108
84
23
61
104
794
1,017
Delaware
1
0
3
16
17
—
0
1
—
—
1
0
5
7
19
District of Columbia
—
1
7
24
21
—
0
1
—
1
—
3
8
59
69
Florida
25
18
59
513
414
1
1
6
37
29
2
25
37
344
430
Georgia
9
18
58
468
358
—
2
6
33
19
12
10
51
114
127
Maryland
8
7
26
208
197
1
0
4
15
13
—
8
14
91
126
North Carolina
N
0
0
N
N
N
0
0
N
N
—
1
14
—
110
South Carolina
17
7
20
210
168
—
0
3
5
9
7
4
10
86
68
Virginia
N
0
0
N
N
—
1
5
13
10
1
4
40
91
65
West Virginia
—
5
23
98
137
—
0
2
5
3
—
0
2
2
3
E.S. Central
20
23
56
590
533
3
2
5
36
35
7
13
25
135
225
Alabama
4
2
10
81
44
1
0
3
11
1
—
3
10
36
64
Kentucky
8
4
12
121
93
—
0
1
3
3
6
2
9
37
29
Mississippi
2
3
12
94
80
1
0
2
8
10
1
1
11
24
54
Tennessee
6
12
37
294
316
1
0
3
14
21
—
5
9
38
78
W.S. Central
34
28
352
755
670
3
3
24
50
63
10
42
66
581
637
Arkansas
—
3
24
89
74
—
0
2
1
6
10
2
13
55
75
Louisiana
1
4
14
97
94
—
0
4
7
7
—
6
20
63
89
Oklahoma
N
0
0
N
N
1
0
2
8
10
—
2
5
28
20
Texas
33
20
328
569
502
2
2
23
34
40
—
33
47
435
453
Mountain
20
28
63
671
721
1
2
7
39
61
6
12
25
130
170
Arizona
18
10
40
383
283
1
1
4
20
24
—
3
7
2
65
Colorado
—
6
22
69
165
—
0
3
3
11
—
4
12
48
44
Idaho
N
0
0
N
N
—
0
1
3
—
—
0
4
2
9
Montana
—
0
4
10
20
—
0
1
2
1
—
0
1
3
—
Nevada
—
2
7
48
46
—
0
1
2
7
5
3
8
45
27
New Mexico
2
5
17
134
118
—
0
4
7
8
1
2
5
17
17
Utah
—
2
10
17
80
—
0
3
2
10
—
1
3
12
8
Wyoming
—
0
3
10
9
—
0
1
—
—
—
0
1
1
—
Pacific
2
4
10
54
65
—
0
2
7
9
20
73
104
1,031
1,033
Alaska
2
2
8
32
46
—
0
2
6
9
—
0
2
6
3
California
N
0
0
N
N
N
0
0
N
N
16
61
86
879
864
Hawaii
—
1
6
22
19
—
0
2
1
—
—
0
3
2
4
Oregon
N
0
0
N
N
N
0
0
N
N
—
4
15
80
64
Washington
N
0
0
N
N
N
0
0
N
N
4
5
13
64
98
Territories
American Samoa
N
0
0
N
N
—
0
0
—
—
—
0
0
—
—
C.N.M.I.
—
—
—
—
—
—
—
—
—
—
—
—
—
—
—
Guam
—
—
—
—
—
—
—
—
—
—
—
—
—
—
—
Puerto Rico
—
0
0
—
—
—
0
0
—
—
1
7
17
112
68
U.S. Virgin Islands
—
0
0
—
—
—
0
0
—
—
—
0
0
—
—
C.N.M.I.: Commonwealth of Northern Mariana Islands.
U: Unavailable. —: No reported cases. N: Not reportable. NN: Not Nationally Notifiable. Cum: Cumulative year-to-date counts. Med: Median. Max: Maximum.
† Includes drug resistant and susceptible cases of invasive Streptococcus pneumoniae disease among children <5 years and among all ages. Case definition: Isolation of S. pneumoniae from a normally sterile body site (e.g., blood or cerebrospinal fluid).
TABLE II. (Continued) Provisional cases of selected notifiable diseases, United States, weeks ending April 20, 2013, and April 21, 2012 (16th week)*
Reporting area
Varicella (chickenpox)
West Nile virus disease†
Neuroinvasive
Nonneuroinvasive§
Current week
Previous 52 weeks
Cum 2013
Cum 2012
Current week
Previous 52 weeks
Cum 2013
Cum 2012
Current week
Previous 52 weeks
Cum 2013
Cum 2012
Med
Max
Med
Max
Med
Max
United States
101
184
371
2,519
5,027
—
4
323
—
2
—
4
342
1
2
New England
3
20
54
228
528
—
0
8
—
—
—
0
5
—
—
Connecticut
—
5
11
60
74
—
0
2
—
—
—
0
3
—
—
Maine
2
3
10
47
122
—
0
1
—
—
—
0
0
—
—
Massachusetts
—
7
21
85
211
—
0
7
—
—
—
0
3
—
—
New Hampshire
—
2
8
9
52
—
0
1
—
—
—
0
0
—
—
Rhode Island
—
0
10
4
21
—
0
1
—
—
—
0
1
—
—
Vermont
1
2
13
23
48
—
0
1
—
—
—
0
1
—
—
Mid. Atlantic
7
17
42
223
543
—
0
19
—
—
—
0
18
—
—
New Jersey
—
4
19
2
214
—
0
5
—
—
—
0
5
—
—
New York (Upstate)
N
0
0
N
N
—
0
6
—
—
—
0
8
—
—
New York City
—
0
0
—
—
—
0
5
—
—
—
0
2
—
—
Pennsylvania
7
14
33
221
329
—
0
5
—
—
—
0
4
—
—
E.N. Central
42
56
145
830
1,303
—
0
91
—
—
—
0
39
—
1
Illinois
1
16
29
234
357
—
0
31
—
—
—
0
18
—
1
Indiana
6
7
26
91
116
—
0
8
—
—
—
0
6
—
—
Michigan
10
15
62
174
342
—
0
33
—
—
—
0
12
—
—
Ohio
22
14
33
249
319
—
0
19
—
—
—
0
12
—
—
Wisconsin
3
7
24
82
169
—
0
11
—
—
—
0
3
—
—
W.N. Central
—
6
39
32
281
—
0
36
—
1
—
0
60
—
—
Iowa
N
0
0
N
N
—
0
3
—
—
—
0
5
—
—
Kansas
—
0
0
—
85
—
0
3
—
1
—
0
6
—
—
Minnesota
—
0
0
—
—
—
0
6
—
—
—
0
7
—
—
Missouri
—
5
36
10
161
—
0
4
—
—
—
0
1
—
—
Nebraska
—
0
3
—
16
—
0
8
—
—
—
0
22
—
—
North Dakota
—
0
5
10
10
—
0
8
—
—
—
0
11
—
—
South Dakota
—
0
4
12
9
—
0
17
—
—
—
0
28
—
—
S. Atlantic
25
25
48
429
719
—
0
21
—
—
—
0
21
—
—
Delaware
—
0
2
3
2
—
0
1
—
—
—
0
2
—
—
District of Columbia
—
0
2
—
8
—
0
3
—
—
—
0
1
—
—
Florida
19
12
31
239
406
—
0
5
—
—
—
0
5
—
—
Georgia
—
1
6
23
15
—
0
6
—
—
—
0
10
—
—
Maryland
N
0
0
N
N
—
0
5
—
—
—
0
4
—
—
North Carolina
N
0
0
N
N
—
0
3
—
—
—
0
0
—
—
South Carolina
6
0
13
52
—
—
0
5
—
—
—
0
2
—
—
Virginia
—
8
20
86
178
—
0
4
—
—
—
0
3
—
—
West Virginia
—
2
12
26
110
—
0
1
—
—
—
0
3
—
—
E.S. Central
—
3
9
56
85
—
0
20
—
—
—
0
22
1
1
Alabama
—
3
9
55
80
—
0
7
—
—
—
0
4
—
1
Kentucky
N
0
0
N
N
—
0
4
—
—
—
0
2
—
—
Mississippi
—
0
1
1
5
—
0
12
—
—
—
0
17
1
—
Tennessee
N
0
0
N
N
—
0
4
—
—
—
0
2
—
—
W.S. Central
20
37
213
495
852
—
2
145
—
—
—
1
166
—
—
Arkansas
3
3
19
28
70
—
0
9
—
—
—
0
3
—
—
Louisiana
—
0
6
15
27
—
0
18
—
—
—
0
26
—
—
Oklahoma
N
0
0
N
N
—
0
24
—
—
—
0
22
—
—
Texas
17
34
211
452
755
—
2
105
—
—
—
1
131
—
—
Mountain
4
19
43
205
678
—
0
37
—
1
—
0
22
—
—
Arizona
—
5
21
7
224
—
0
10
—
1
—
0
7
—
—
Colorado
—
7
17
69
210
—
0
17
—
—
—
0
13
—
—
Idaho
N
0
0
N
N
—
0
1
—
—
—
0
3
—
—
Montana
2
2
8
28
47
—
0
1
—
—
—
0
2
—
—
Nevada
N
0
0
N
N
—
0
1
—
—
—
0
2
—
—
New Mexico
2
1
5
23
50
—
0
9
—
—
—
0
5
—
—
Utah
—
4
13
76
139
—
0
1
—
—
—
0
1
—
—
Wyoming
—
0
3
2
8
—
0
1
—
—
—
0
2
—
—
Pacific
—
2
8
21
38
—
0
33
—
—
—
0
26
—
—
Alaska
—
1
4
14
21
—
0
0
—
—
—
0
0
—
—
California
—
0
4
3
6
—
0
33
—
—
—
0
25
—
—
Hawaii
—
1
2
4
11
—
0
0
—
—
—
0
0
—
—
Oregon
N
0
0
N
N
—
0
0
—
—
—
0
2
—
—
Washington
N
0
0
N
N
—
0
4
—
—
—
0
0
—
—
Territories
American Samoa
N
0
0
N
N
—
0
0
—
—
—
0
0
—
—
C.N.M.I.
—
—
—
—
—
—
—
—
—
—
—
—
—
—
—
Guam
—
—
—
—
—
—
—
—
—
—
—
—
—
—
—
Puerto Rico
—
0
4
—
48
—
0
1
—
—
—
0
0
—
—
U.S. Virgin Islands
—
0
0
—
—
—
0
0
—
—
—
0
0
—
—
C.N.M.I.: Commonwealth of Northern Mariana Islands.
U: Unavailable. —: No reported cases. N: Not reportable. NN: Not Nationally Notifiable. Cum: Cumulative year-to-date counts. Med: Median. Max: Maximum.
† Updated weekly from reports to the Division of Vector-Borne Infectious Diseases, National Center for Zoonotic, Vector-Borne, and Enteric Diseases (ArboNET Surveillance). Data for California serogroup, eastern equine, Powassan, St. Louis, and western equine diseases are available in Table I.
§ Not reportable in all states. Data from states where the condition is not reportable are excluded from this table, except starting in 2007 for the domestic arboviral diseases and influenza-associated pediatric mortality, and in 2003 for SARS-CoV. Reporting exceptions are available at http://wwwn.cdc.gov/nndss/document/SRCA_FINAL_REPORT_2006-2010.xlsx.
TABLE III. Deaths in 122 U.S. cities,* week ending April 20, 2013 (16th week)
Reporting area
All causes, by age (years)
P&I† Total
Reporting area (Continued)
All causes, by age (years)
P&I† Total
All Ages
=65
45–64
25–44
1–24
<1
All Ages
=65
45–64
25–44
1–24
<1
New England
439
316
83
23
5
12
43
S. Atlantic
1,106
711
285
62
28
20
71
Boston, MA
126
90
22
8
1
5
14
Atlanta, GA
160
99
39
15
5
2
13
Bridgeport, CT
29
20
4
3
2
—
5
Baltimore, MD
161
94
56
8
2
1
7
Cambridge, MA
12
9
2
1
—
—
2
Charlotte, NC
151
95
40
9
3
4
6
Fall River, MA
34
27
7
—
—
—
2
Jacksonville, FL
154
106
34
7
3
4
15
Hartford, CT
63
39
17
4
1
2
2
Miami, FL
70
46
18
3
3
—
1
Lowell, MA
22
21
—
—
1
—
2
Norfolk, VA
52
35
10
3
—
4
7
Lynn, MA
6
4
2
—
—
—
2
Richmond, VA
80
54
17
2
5
2
1
New Bedford, MA
23
19
3
1
—
—
1
Savannah, GA
72
41
18
9
3
1
5
New Haven, CT
U
U
U
U
U
U
U
St. Petersburg, FL
74
54
15
3
2
—
5
Providence, RI
U
U
U
U
U
U
U
Tampa, FL
16
8
6
1
1
—
—
Somerville, MA
U
U
U
U
U
U
U
Washington, D.C.
103
67
31
2
1
2
8
Springfield, MA
40
25
10
1
—
4
2
Wilmington, DE
13
12
1
—
—
—
3
Waterbury, CT
26
22
1
3
—
—
3
E.S. Central
1,045
676
274
58
17
20
82
Worcester, MA
58
40
15
2
—
1
8
Birmingham, AL
201
130
54
9
3
5
16
Mid. Atlantic
1,952
1,399
418
85
29
21
109
Chattanooga, TN
102
80
17
3
—
2
9
Albany, NY
58
36
13
3
2
4
5
Knoxville, TN
105
60
33
5
4
3
8
Allentown, PA
28
23
5
—
—
—
5
Lexington, KY
106
78
20
5
1
2
4
Buffalo, NY
110
80
22
4
1
3
5
Memphis, TN
205
125
56
17
5
2
24
Camden, NJ
31
17
8
5
1
—
2
Mobile, AL
106
67
29
7
3
—
8
Elizabeth, NJ
19
13
6
—
—
—
2
Montgomery, AL
63
39
22
2
—
—
5
Erie, PA
46
30
14
2
—
—
2
Nashville, TN
157
97
43
10
1
6
8
Jersey City, NJ
15
9
5
1
—
—
1
W.S. Central
1,441
921
364
91
33
31
78
New York City, NY
1,257
913
263
53
20
8
54
Austin, TX
96
61
21
8
3
3
5
Newark, NJ
21
9
6
6
—
—
1
Baton Rouge, LA
100
64
28
5
2
1
3
Paterson, NJ
18
8
7
1
—
2
4
Corpus Christi, TX
79
52
20
4
2
1
7
Philadelphia, PA
U
U
U
U
U
U
U
Dallas, TX
222
139
61
14
2
5
12
Pittsburgh, PA§
57
46
8
—
3
—
4
El Paso, TX
79
59
14
5
—
1
3
Reading, PA
33
26
5
1
1
—
5
Fort Worth, TX
U
U
U
U
U
U
U
Rochester, NY
86
60
19
4
—
3
4
Houston, TX
316
189
81
29
9
8
9
Schenectady, NY
26
21
5
—
—
—
4
Little Rock, AR
85
59
19
4
1
2
6
Scranton, PA
30
25
5
—
—
—
2
New Orleans, LA
73
35
22
7
6
3
—
Syracuse, NY
58
38
18
1
1
—
5
San Antonio, TX
248
168
63
7
6
4
25
Trenton, NJ
24
16
4
3
—
1
1
Shreveport, LA
92
53
29
6
1
3
5
Utica, NY
15
14
1
—
—
—
2
Tulsa, OK
51
42
6
2
1
—
3
Yonkers, NY
20
15
4
1
—
—
1
Mountain
1,195
791
274
74
29
25
56
E.N. Central
2,170
1,451
513
126
41
39
169
Albuquerque, NM
114
67
33
12
1
1
11
Akron, OH
53
36
9
5
3
—
6
Boise, ID
58
37
13
2
3
3
1
Canton, OH
27
19
6
2
—
—
3
Colorado Springs, CO
73
50
16
5
2
—
—
Chicago, IL
264
171
68
16
6
3
17
Denver, CO
95
62
20
7
1
5
—
Cincinnati, OH
80
46
15
7
5
7
6
Las Vegas, NV
304
204
79
11
6
4
17
Cleveland, OH
279
203
59
12
3
2
12
Ogden, UT
30
22
8
—
—
—
2
Columbus, OH
275
174
73
18
5
5
21
Phoenix, AZ
198
125
39
19
7
7
11
Dayton, OH
131
95
23
9
3
1
14
Pueblo, CO
23
16
4
2
1
—
2
Detroit, MI
166
83
63
14
5
1
6
Salt Lake City, UT
129
89
23
7
5
5
5
Evansville, IN
59
41
14
4
—
—
4
Tucson, AZ
171
119
39
9
3
—
7
Fort Wayne, IN
81
57
17
5
1
1
2
Pacific
1,831
1,298
379
91
31
30
140
Gary, IN
6
4
2
—
—
—
—
Berkeley, CA
12
9
—
1
—
2
2
Grand Rapids, MI
46
31
10
2
—
3
4
Fresno, CA
129
84
32
4
5
4
8
Indianapolis, IN
192
122
46
11
2
11
22
Glendale, CA
32
27
4
1
—
—
9
Lansing, MI
63
40
19
1
—
3
8
Honolulu, HI
80
67
9
2
2
—
10
Milwaukee, WI
97
59
28
7
2
1
5
Long Beach, CA
53
33
14
5
1
—
5
Peoria, IL
62
49
9
3
1
—
7
Los Angeles, CA
254
173
48
20
7
6
24
Rockford, IL
78
58
16
3
1
—
6
Pasadena, CA
30
23
5
—
—
1
1
South Bend, IN
40
35
5
—
—
—
5
Portland, OR
169
121
39
7
1
1
5
Toledo, OH
99
74
20
3
2
—
11
Sacramento, CA
237
170
49
12
2
4
15
Youngstown, OH
72
54
11
4
2
1
10
San Diego, CA
171
122
33
8
1
6
10
W.N. Central
738
479
179
50
13
14
48
San Francisco, CA
112
70
31
9
—
2
2
Des Moines, IA
89
60
22
4
1
2
8
San Jose, CA
221
163
44
6
7
1
22
Duluth, MN
27
24
3
—
—
—
2
Santa Cruz, CA
29
15
11
2
—
1
1
Kansas City, KS
26
12
13
—
1
—
2
Seattle, WA
109
76
23
9
—
1
8
Kansas City, MO
126
79
29
12
4
1
8
Spokane, WA
63
53
7
1
1
1
6
Lincoln, NE
54
44
7
1
1
1
1
Tacoma, WA
130
92
30
4
4
—
12
Minneapolis, MN
64
36
19
3
—
5
1
Total¶
11,917
8,042
2,769
660
226
212
796
Omaha, NE
89
63
15
6
2
3
5
St. Louis, MO
109
52
41
12
2
2
9
St. Paul, MN
57
41
11
3
1
—
6
Wichita, KS
97
68
19
9
1
—
6
U: Unavailable. —: No reported cases.
* Mortality data in this table are voluntarily reported from 122 cities in the United States, most of which have populations of >100,000. A death is reported by the place of its occurrence and by the week that the death certificate was filed. Fetal deaths are not included.
† Pneumonia and influenza.
§ Because of changes in reporting methods in this Pennsylvania city, these numbers are partial counts for the current week. Complete counts will be available in 4 to 6 weeks.