Persons using assistive technology might not be able to fully access information in this file. For assistance, please send e-mail to: mmwrq@cdc.gov. Type 508 Accommodation and the title of the report in the subject line of e-mail.
Notifiable Diseases and Mortality Tables
Table I Summary of provisional cases of selected notifiable diseases, United States, cumulative, week ending April 27, 2013 (17th Week)
Figure I Selected notifiable disease reports, United States, comparison of provisional 4-week totals ending April 27, 2013, with historical data
Table II Provisional cases of selected notifiable diseases, United States, weeks ending April 27, 2013 and April 28, 2012 (17th Week)
Table III Deaths in 122 U.S. cities, week ending April 27, 2013 (17th Week)
TABLE I. Provisional cases of infrequently reported notifiable diseases (<1,000 cases reported during the preceding year) — United States, week ending April 27, 2013 (17th week)*
TABLE I. (Continued) Provisional cases of infrequently reported notifiable diseases (<1,000 cases reported during the preceding year) — United States, week ending April 27, 2013 (17th week)*
—: No reported cases. N: Not reportable. NN: Not Nationally Notifiable. Cum: Cumulative year-to-date counts.
† Calculated by summing the incidence counts for the current week, the 2 weeks preceding the current week, and the 2 weeks following the current week, for a total of 5 preceding years. The total sum of incident cases is then divided by 25 weeks. Additional information is available at http://wwwn.cdc.gov/nndss/document/5yearweeklyaverage.pdf.
§ Not reportable in all states. Data from states where the condition is not reportable are excluded from this table except starting in 2007 for the arboviral diseases, STD data, TB data, and influenza-associated pediatric mortality, and in 2003 for SARS-CoV. Reporting exceptions are available at http://wwwn.cdc.gov/nndss/document/SRCA_FINAL_REPORT_2006-2012_final.xlsx.
¶ Includes both neuroinvasive and nonneuroinvasive. Updated weekly from reports to the Division of Vector-Borne Infectious Diseases, National Center for Zoonotic, Vector-Borne, and Enteric Diseases (ArboNET Surveillance). Data for West Nile virus are available in Table II.
** Data for H. influenzae (all ages, all serotypes) are available in Table II.
†† Updated weekly from reports to the Influenza Division, National Center for Immunization and Respiratory Diseases. Since September 30, 2012, 137 influenza-associated pediatric deaths occurring during the 2012-13 influenza season have been reported. One influenza-associated pediatric death occurring during the 2010–11 influenza season has been reported from Kansas.
§§ The one measles case reported for the current week was imported.
¶¶ Data for meningococcal disease (all serogroups) are available in Table II.
*** CDC discontinued reporting of individual confirmed and probable cases of 2009 pandemic influenza A (H1N1) virus infections on July 24, 2009. During 2009, four cases of human infection with novel influenza A viruses, different from the 2009 pandemic influenza A (H1N1) strain, were reported to CDC. The four cases of novel influenza A virus infection reported to CDC during 2010, the fourteen cases reported during 2011, and the 313 cases reported in 2012 are different from the 2009 pandemic influenza A (H1N1) virus. Total case counts are provided by the Influenza Division, National Center for Immunization and Respiratory Diseases (NCIRD).
††† No rubella cases were reported for the current week.
§§§ Updated weekly from reports to the Division of STD Prevention, National Center for HIV/AIDS, Viral Hepatitis, STD, and TB Prevention.
¶¶¶ There were no cases of viral hemorrhagic fever reported during the current week. See Table II for dengue hemorrhagic fever.
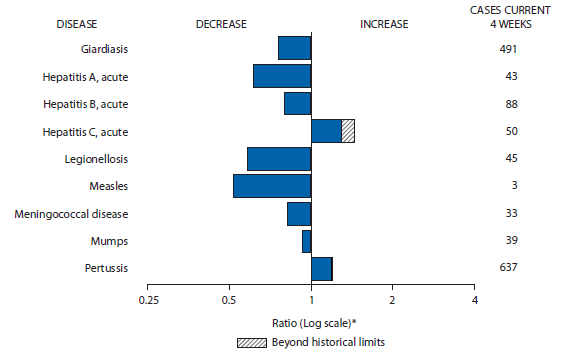
FIGURE I. Selected notifiable disease reports, United States, comparison of provisional 4-week totals April 27, 2013, with historical data
* Ratio of current 4-week total to mean of 15 4-week totals (from previous, comparable, and subsequent 4-week periods for the past 5 years). The point where the hatched area begins is based on the mean and two standard deviations of these 4-week totals.
Alternate Text: The figure above shows selected notifiable disease reports for the United States, with comparison of provisional 4-week totals through April 27, 2013, with historical data. Reports of acute hepatitis C, and pertussis increased, with acute hepatitis C increasing beyond historical limits. Reports of giardiasis, acute hepatitis A, acute hepatitis B, legionellosis, measles, meningococcal disease, and mumps all decreased.
TABLE II. Provisional cases of selected notifiable diseases, United States, weeks ending April 27, 2013, and April 28, 2012 (17th week)*
Reporting area
Chlamydia trachomatis infection
Coccidioidomycosis
Cryptosporidiosis
Current week
Previous 52 weeks
Cum 2013
Cum 2012
Current week
Previous 52 weeks
Cum 2013
Cum 2012
Current week
Previous 52 weeks
Cum 2013
Cum 2012
Med
Max
Med
Max
Med
Max
United States
12,066
26,653
30,880
404,463
465,105
17
244
473
1,876
7,119
43
111
288
1,381
1,926
New England
733
945
1,340
14,637
15,736
—
0
1
1
1
—
7
19
48
90
Connecticut
85
245
560
3,401
3,986
N
0
0
N
N
—
1
3
5
11
Maine
—
64
102
809
1,098
N
0
0
N
N
—
1
4
6
13
Massachusetts
571
470
706
7,524
7,498
—
0
0
—
—
—
2
8
25
44
New Hampshire
3
58
83
870
1,074
—
0
1
1
—
—
1
4
5
12
Rhode Island
67
82
160
1,431
1,635
—
0
0
—
1
—
0
3
1
2
Vermont
7
32
110
602
445
N
0
0
N
N
—
1
6
6
8
Mid. Atlantic
2,478
3,520
4,499
58,700
60,301
—
0
1
—
3
11
12
40
139
188
New Jersey
177
538
647
8,739
9,243
N
0
0
N
N
—
0
4
8
10
New York (Upstate)
800
729
1,917
11,615
11,427
N
0
0
N
N
5
3
16
37
29
New York City
546
1,174
1,299
18,163
21,397
N
0
0
N
N
—
1
8
13
31
Pennsylvania
955
1,055
1,992
20,183
18,234
—
0
1
—
3
6
6
20
81
118
E.N. Central
1,237
4,281
4,777
57,915
73,300
—
1
4
7
17
1
27
110
304
514
Illinois
40
1,292
1,509
12,802
22,894
N
0
0
N
N
—
3
8
35
52
Indiana
216
568
838
8,483
9,224
N
0
0
N
N
—
2
8
26
65
Michigan
417
908
1,303
13,626
15,607
—
0
2
3
10
—
5
40
55
94
Ohio
281
1,042
1,207
15,456
17,609
—
0
2
2
6
1
8
28
99
167
Wisconsin
283
462
555
7,548
7,966
—
0
1
2
1
—
8
43
89
136
W.N. Central
105
1,548
1,806
20,606
27,404
—
1
8
8
41
5
14
42
165
241
Iowa
8
211
255
3,019
3,911
N
0
0
N
N
—
4
22
43
79
Kansas
41
211
256
3,190
3,824
N
0
0
N
N
—
2
6
23
41
Minnesota
7
342
436
3,527
5,768
—
1
7
6
36
—
0
0
—
—
Missouri
—
542
657
7,764
9,325
—
0
1
2
4
1
4
12
45
53
Nebraska
19
115
186
1,141
2,340
—
0
0
—
1
3
2
10
24
21
North Dakota
1
55
74
745
929
—
0
0
—
—
—
0
4
6
10
South Dakota
29
75
109
1,220
1,307
N
0
0
N
N
1
2
6
24
37
S. Atlantic
3,200
5,265
6,539
80,199
92,936
—
0
1
1
3
15
18
54
303
383
Delaware
69
92
322
1,823
1,192
—
0
1
—
—
—
0
2
2
6
District of Columbia
50
134
284
2,393
2,267
—
0
0
—
—
N
0
0
N
N
Florida
967
1,524
1,776
25,311
25,990
N
0
0
N
N
8
8
24
95
141
Georgia
707
956
1,246
14,755
18,605
N
0
0
N
N
1
5
14
79
94
Maryland
—
458
1,211
5,141
6,890
—
0
1
1
3
1
1
5
18
34
North Carolina
—
782
1,771
8,654
15,111
N
0
0
N
N
5
0
28
49
35
South Carolina
548
525
904
9,071
9,336
N
0
0
N
N
—
1
4
23
24
Virginia
739
642
1,018
11,409
11,970
N
0
0
N
N
—
2
7
33
45
West Virginia
120
90
149
1,642
1,575
N
0
0
N
N
—
0
3
4
4
E.S. Central
950
1,931
2,559
28,689
34,806
—
0
0
—
—
1
4
14
70
82
Alabama
—
584
862
9,057
10,017
N
0
0
N
N
1
2
6
32
33
Kentucky
336
327
787
5,536
5,448
N
0
0
N
N
—
1
4
14
12
Mississippi
366
371
765
6,399
8,136
N
0
0
N
N
—
0
4
12
12
Tennessee
248
608
735
7,697
11,205
N
0
0
N
N
—
1
5
12
25
W.S. Central
1,159
3,517
5,739
57,662
55,826
—
0
1
2
—
5
10
42
130
115
Arkansas
372
327
394
5,488
5,645
N
0
0
N
N
—
0
5
5
10
Louisiana
427
494
2,058
5,119
5,035
—
0
1
2
—
—
3
7
50
24
Oklahoma
360
117
2,467
6,409
3,804
N
0
0
N
N
—
1
13
18
24
Texas
—
2,480
3,707
40,646
41,342
N
0
0
N
N
5
5
27
57
57
Mountain
636
1,720
2,045
20,686
31,604
—
178
398
1,266
5,350
4
12
48
93
157
Arizona
—
517
769
969
10,243
—
176
394
1,240
5,265
—
1
4
8
9
Colorado
419
409
584
6,822
7,288
N
0
0
N
N
—
1
7
5
21
Idaho
—
87
198
1,592
1,555
N
0
0
N
N
3
3
25
27
30
Montana
69
71
108
1,175
1,310
—
0
1
—
2
1
1
5
13
26
Nevada
—
217
325
3,316
3,688
—
1
6
12
42
—
0
2
5
5
New Mexico
105
217
459
4,271
4,298
—
0
3
7
19
—
1
4
8
38
Utah
37
145
179
2,127
2,582
—
1
4
6
20
—
2
22
26
19
Wyoming
6
37
67
414
640
—
0
1
1
2
—
0
4
1
9
Pacific
1,568
4,151
5,197
65,369
73,192
17
65
89
591
1,704
1
11
27
129
156
Alaska
37
105
149
1,806
1,886
N
0
0
N
N
—
0
1
—
—
California
885
3,195
4,205
49,562
56,454
17
65
89
590
1,704
—
6
14
64
74
Hawaii
13
123
153
1,665
2,008
N
0
0
N
N
—
0
1
—
1
Oregon
261
259
378
4,561
4,823
—
0
1
1
—
—
4
10
45
68
Washington
372
472
632
7,775
8,021
—
0
0
—
—
1
1
22
20
13
Territories
American Samoa
—
12
59
—
—
N
0
0
N
N
N
0
0
N
N
C.N.M.I.
—
—
—
—
—
—
—
—
—
—
—
—
—
—
—
Guam
—
—
—
—
—
—
—
—
—
—
—
—
—
—
—
Puerto Rico
77
111
307
1,968
2,330
N
0
0
N
N
N
0
0
N
N
U.S. Virgin Islands
—
15
25
159
238
—
0
0
—
—
—
0
0
—
—
C.N.M.I.: Commonwealth of Northern Mariana Islands.
U: Unavailable. —: No reported cases. N: Not reportable. NN: Not Nationally Notifiable. Cum: Cumulative year-to-date counts. Med: Median. Max: Maximum.
† Data for meningococcal disease, invasive caused by serogroups A, C, Y, and W-135; serogroup B; other serogroup; and unknown serogroup are available in Table I.
TABLE II. (Continued) Provisional cases of selected notifiable diseases, United States, weeks ending April 27, 2013, and April 28, 2012 (17th week)*
Reporting area
Rabies, animal
Salmonellosis
Shiga toxin-producing E. coli (STEC)†
Current week
Previous 52 weeks
Cum 2013
Cum 2012
Current week
Previous 52 weeks
Cum 2013
Cum 2012
Current week
Previous 52 weeks
Cum 2013
Cum 2012
Med
Max
Med
Max
Med
Max
United States
61
77
141
744
1,224
358
997
1,709
7,641
9,630
34
118
199
760
1,114
New England
2
6
16
89
127
6
36
73
321
436
—
4
9
40
28
Connecticut
—
3
8
39
62
—
8
19
74
100
—
1
4
9
8
Maine
1
1
4
17
39
1
3
12
25
25
—
0
4
6
—
Massachusetts
—
0
0
—
—
—
20
54
159
240
—
2
6
14
17
New Hampshire
—
1
3
10
5
—
3
9
25
25
—
0
4
7
2
Rhode Island
—
0
5
7
7
5
1
7
22
25
—
0
1
—
—
Vermont
1
1
7
16
14
—
1
7
16
21
—
0
3
4
1
Mid. Atlantic
7
16
38
89
266
54
85
188
860
1,155
6
11
24
94
129
New Jersey
—
0
0
—
—
—
16
48
147
279
—
1
6
16
36
New York (Upstate)
7
7
20
89
85
24
22
64
217
266
2
4
15
31
33
New York City
—
0
0
—
—
4
19
49
230
261
—
1
7
18
25
Pennsylvania
—
10
29
—
181
26
29
62
266
349
4
3
12
29
35
E.N. Central
1
1
13
6
22
24
96
238
865
1,226
4
18
77
132
214
Illinois
—
0
6
3
6
—
33
79
268
398
—
4
16
24
40
Indiana
—
0
2
—
—
—
11
40
89
151
—
2
23
17
38
Michigan
—
0
5
1
12
5
16
46
190
221
—
4
41
28
64
Ohio
1
0
7
2
4
19
24
50
249
249
4
4
20
50
29
Wisconsin
N
0
0
N
N
—
13
36
69
207
—
4
21
13
43
W.N. Central
3
3
18
41
62
13
42
108
473
508
2
15
31
89
152
Iowa
—
0
5
—
3
2
9
32
106
96
—
3
15
15
15
Kansas
3
1
5
25
21
3
9
18
85
104
1
1
7
15
17
Minnesota
—
0
0
—
—
—
0
0
—
—
—
0
0
—
—
Missouri
—
0
3
12
11
5
18
48
161
198
—
5
15
37
86
Nebraska
—
0
0
—
—
3
4
26
62
58
1
1
6
12
17
North Dakota
—
0
13
—
7
—
1
5
21
19
—
0
3
4
6
South Dakota
—
1
4
4
20
—
3
9
38
33
—
1
4
6
11
S. Atlantic
2
19
34
274
369
132
280
625
2,229
2,870
9
10
72
148
116
Delaware
—
0
0
—
—
—
2
10
14
30
—
0
3
2
2
District of Columbia
—
0
0
—
—
—
0
3
1
16
—
0
1
—
3
Florida
—
0
14
33
103
77
110
272
1,050
1,097
7
2
10
63
27
Georgia
—
0
0
—
—
8
43
111
299
456
1
2
7
28
27
Maryland
—
6
17
78
92
9
15
41
182
241
1
1
5
14
10
North Carolina
—
0
0
—
—
12
26
166
286
504
—
1
61
21
19
South Carolina
—
0
0
—
—
9
24
73
163
224
—
0
7
1
5
Virginia
—
11
23
149
149
14
23
47
212
260
—
1
6
13
21
West Virginia
2
1
6
14
25
3
3
15
22
42
—
0
2
6
2
E.S. Central
—
1
5
9
27
13
62
209
474
633
1
5
13
52
69
Alabama
—
1
5
6
22
2
18
59
133
193
1
1
5
14
18
Kentucky
—
0
3
3
4
1
9
50
103
116
—
1
9
12
13
Mississippi
—
0
1
—
1
—
15
65
107
147
—
0
3
6
7
Tennessee
—
0
0
—
—
10
18
63
131
177
—
2
11
20
31
W.S. Central
46
12
61
226
268
61
148
416
937
1,273
1
11
113
29
113
Arkansas
34
0
35
51
63
8
16
229
79
103
1
1
10
11
12
Louisiana
—
0
0
—
—
2
21
59
168
249
—
0
3
2
6
Oklahoma
—
0
23
19
10
17
15
34
146
124
—
2
8
10
15
Texas
12
11
39
156
195
34
91
324
544
797
—
7
96
6
80
Mountain
—
1
16
3
36
5
45
82
423
572
1
11
45
53
106
Arizona
N
0
0
N
N
—
15
31
148
191
—
2
8
8
30
Colorado
—
0
0
—
—
3
9
19
43
147
—
3
9
1
28
Idaho
—
0
15
—
—
1
2
7
29
36
—
1
30
13
15
Montana
N
0
0
N
N
1
2
7
15
21
1
1
5
9
5
Nevada
—
0
4
2
1
—
3
12
44
42
—
0
5
9
6
New Mexico
—
0
3
1
31
—
6
20
79
59
—
1
5
2
12
Utah
—
0
2
—
—
—
4
15
58
65
—
1
15
11
6
Wyoming
—
0
6
—
4
—
1
8
7
11
—
0
3
—
4
Pacific
—
4
14
7
47
50
106
191
1,059
957
10
14
42
123
187
Alaska
—
0
2
5
5
1
1
5
18
19
N
0
0
N
N
California
—
4
12
—
42
15
71
134
717
670
6
7
21
52
116
Hawaii
—
0
0
—
—
6
5
58
68
38
—
0
5
13
3
Oregon
—
0
2
2
—
1
9
17
119
94
—
3
11
32
43
Washington
—
0
0
—
—
27
12
95
137
136
4
2
34
26
25
Territories
American Samoa
—
0
0
—
—
—
1
2
—
1
—
0
0
—
—
C.N.M.I.
—
—
—
—
—
—
—
—
—
—
—
—
—
—
—
Guam
—
—
—
—
—
—
—
—
—
—
—
—
—
—
—
Puerto Rico
—
0
2
—
25
—
0
4
—
19
—
0
2
—
—
U.S. Virgin Islands
—
0
0
—
—
—
0
0
—
—
—
0
0
—
—
C.N.M.I.: Commonwealth of Northern Mariana Islands.
U: Unavailable. —: No reported cases. N: Not reportable. NN: Not Nationally Notifiable. Cum: Cumulative year-to-date counts. Med: Median. Max: Maximum.
† Illnesses with similar clinical presentation that result from Spotted fever group rickettsia infections are reported as Spotted fever rickettsioses. Rocky Mountain spotted fever (RMSF) caused by Rickettsia rickettsii, is the most common and well-known spotted fever.
TABLE II. (Continued) Provisional cases of selected notifiable diseases, United States, weeks ending April 27, 2013, and April 28, 2012 (17th week)*
Reporting area
Streptococcus pneumoniae,† invasive disease
Syphilis, primary and secondary
All ages
Age <5
Current week
Previous 52 weeks
Cum 2013
Cum 2012
Current week
Previous 52 weeks
Cum 2013
Cum 2012
Current week
Previous 52 weeks
Cum 2013
Cum 2012
Med
Max
Med
Max
Med
Max
United States
166
278
790
6,294
6,326
12
23
47
388
469
80
295
383
4,066
4,665
New England
7
11
55
243
288
—
1
4
12
27
4
7
16
131
154
Connecticut
—
5
21
122
139
—
0
2
5
8
—
0
4
7
22
Maine
6
2
8
54
43
—
0
1
3
1
—
0
5
2
7
Massachusetts
—
0
4
5
19
—
0
3
3
13
3
6
13
100
92
New Hampshire
—
1
5
33
39
—
0
1
1
4
—
0
4
9
12
Rhode Island
—
0
29
1
25
—
0
0
—
1
1
0
4
11
20
Vermont
1
1
6
28
23
—
0
0
—
—
—
0
2
2
1
Mid. Atlantic
33
34
63
706
933
1
2
5
32
37
16
36
55
579
588
New Jersey
—
0
16
8
263
—
0
3
—
11
—
3
8
40
67
New York (Upstate)
28
16
39
367
385
1
1
4
22
18
8
4
32
93
62
New York City
5
14
36
331
285
—
0
3
10
8
3
20
32
300
304
Pennsylvania
N
—
—
N
N
N
0
0
N
N
5
9
19
146
155
E.N. Central
30
57
131
1,305
1,299
1
4
12
54
98
3
30
60
355
562
Illinois
N
0
0
N
N
—
1
3
14
19
—
11
23
109
259
Indiana
—
13
49
232
284
—
0
2
5
12
3
4
10
60
71
Michigan
8
13
30
297
272
—
0
3
16
21
—
5
14
68
94
Ohio
19
21
63
569
545
—
1
6
13
32
—
8
15
99
117
Wisconsin
3
9
29
207
198
1
0
2
6
14
—
2
5
19
21
W.N. Central
1
12
35
261
284
—
2
5
37
40
—
7
17
125
104
Iowa
N
0
0
N
N
N
0
0
N
N
—
1
4
12
16
Kansas
N
0
0
N
N
N
0
0
N
N
—
0
3
6
5
Minnesota
—
8
24
149
176
—
0
3
11
11
—
3
5
38
29
Missouri
N
0
0
N
N
—
1
3
14
16
—
3
9
58
51
Nebraska
—
1
7
61
69
—
0
1
5
5
—
0
2
7
2
North Dakota
—
0
1
2
—
—
0
1
2
—
—
0
1
1
—
South Dakota
1
2
6
49
39
—
0
1
5
8
—
0
2
3
1
S. Atlantic
44
61
138
1,614
1,379
4
5
14
113
92
24
61
104
848
1,073
Delaware
—
0
3
16
17
—
0
1
—
—
—
0
5
7
19
District of Columbia
—
1
7
28
25
—
0
1
—
1
4
3
8
64
72
Florida
22
18
59
536
428
1
1
6
38
30
3
25
38
372
452
Georgia
9
19
58
490
377
—
2
6
33
23
9
10
51
124
143
Maryland
7
7
26
221
210
—
0
4
15
14
—
8
14
91
130
North Carolina
N
0
0
N
N
N
0
0
N
N
—
0
14
—
110
South Carolina
4
7
21
216
175
—
0
3
6
9
6
4
10
92
74
Virginia
N
0
0
N
N
2
1
5
15
12
2
4
40
93
70
West Virginia
2
5
23
107
147
1
0
2
6
3
—
0
2
5
3
E.S. Central
18
23
56
619
565
3
2
5
39
37
8
13
25
147
247
Alabama
1
2
10
84
47
—
0
3
11
2
—
4
10
40
68
Kentucky
4
4
12
127
94
1
0
1
4
3
4
2
9
41
34
Mississippi
2
3
12
102
83
1
0
2
9
10
4
1
11
28
62
Tennessee
11
12
37
306
341
1
0
3
15
22
—
5
9
38
83
W.S. Central
28
28
353
813
691
3
3
24
55
66
3
42
66
632
681
Arkansas
1
3
24
94
75
—
0
2
2
7
2
2
13
57
78
Louisiana
1
4
14
118
97
1
0
4
8
7
1
6
20
66
94
Oklahoma
N
0
0
N
N
1
0
2
9
11
—
2
5
31
20
Texas
26
20
329
601
519
1
2
23
36
41
—
33
47
478
489
Mountain
1
29
63
674
819
—
2
7
39
63
—
12
25
135
179
Arizona
—
12
40
383
350
—
1
4
20
24
—
2
7
2
66
Colorado
—
6
22
69
192
—
0
3
3
11
—
4
12
50
47
Idaho
N
0
0
N
N
—
0
1
3
1
—
0
4
2
10
Montana
—
0
2
10
20
—
0
1
2
1
—
0
1
3
—
Nevada
—
2
7
48
46
—
0
1
2
7
—
3
8
45
30
New Mexico
1
5
17
137
123
—
0
4
7
8
—
2
5
18
20
Utah
—
2
11
17
78
—
0
3
2
10
—
1
3
14
6
Wyoming
—
0
3
10
10
—
0
1
—
1
—
0
1
1
—
Pacific
4
4
10
59
68
—
0
2
7
9
22
73
104
1,114
1,077
Alaska
3
2
6
35
47
—
0
2
6
9
—
0
2
6
3
California
N
0
0
N
N
N
0
0
N
N
20
61
86
956
902
Hawaii
1
1
6
24
21
—
0
2
1
—
—
0
3
5
4
Oregon
N
0
0
N
N
N
0
0
N
N
2
3
15
83
66
Washington
N
0
0
N
N
N
0
0
N
N
—
5
13
64
102
Territories
American Samoa
N
0
0
N
N
—
0
0
—
—
—
0
0
—
—
C.N.M.I.
—
—
—
—
—
—
—
—
—
—
—
—
—
—
—
Guam
—
—
—
—
—
—
—
—
—
—
—
—
—
—
—
Puerto Rico
—
0
0
—
—
—
0
0
—
—
12
7
17
124
71
U.S. Virgin Islands
—
0
0
—
—
—
0
0
—
—
—
0
0
—
—
C.N.M.I.: Commonwealth of Northern Mariana Islands.
U: Unavailable. —: No reported cases. N: Not reportable. NN: Not Nationally Notifiable. Cum: Cumulative year-to-date counts. Med: Median. Max: Maximum.
† Includes drug resistant and susceptible cases of invasive Streptococcus pneumoniae disease among children <5 years and among all ages. Case definition: Isolation of S. pneumoniae from a normally sterile body site (e.g., blood or cerebrospinal fluid).
TABLE II. (Continued) Provisional cases of selected notifiable diseases, United States, weeks ending April 27, 2013, and April 28, 2012 (17th week)*
Reporting area
Varicella (chickenpox)
West Nile virus disease†
Neuroinvasive
Nonneuroinvasive§
Current week
Previous 52 weeks
Cum 2013
Cum 2012
Current week
Previous 52 weeks
Cum 2013
Cum 2012
Current week
Previous 52 weeks
Cum 2013
Cum 2012
Med
Max
Med
Max
Med
Max
United States
140
184
372
2,787
5,373
—
4
323
—
2
—
4
342
1
2
New England
2
19
54
235
566
—
0
8
—
—
—
0
5
—
—
Connecticut
1
5
11
66
82
—
0
2
—
—
—
0
3
—
—
Maine
—
3
10
47
126
—
0
1
—
—
—
0
0
—
—
Massachusetts
—
7
21
85
228
—
0
7
—
—
—
0
3
—
—
New Hampshire
—
2
8
9
54
—
0
1
—
—
—
0
0
—
—
Rhode Island
—
0
10
4
25
—
0
1
—
—
—
0
1
—
—
Vermont
1
2
13
24
51
—
0
1
—
—
—
0
1
—
—
Mid. Atlantic
13
18
42
277
559
—
0
19
—
—
—
0
18
—
—
New Jersey
—
4
19
38
222
—
0
5
—
—
—
0
5
—
—
New York (Upstate)
N
0
0
N
N
—
0
6
—
—
—
0
8
—
—
New York City
—
0
0
—
—
—
0
5
—
—
—
0
2
—
—
Pennsylvania
13
14
33
239
337
—
0
5
—
—
—
0
4
—
—
E.N. Central
41
55
145
894
1,396
—
0
91
—
—
—
0
39
—
1
Illinois
1
15
29
243
373
—
0
31
—
—
—
0
18
—
1
Indiana
10
7
26
105
128
—
0
8
—
—
—
0
6
—
—
Michigan
9
15
62
191
370
—
0
33
—
—
—
0
12
—
—
Ohio
20
14
33
268
345
—
0
19
—
—
—
0
12
—
—
Wisconsin
1
6
24
87
180
—
0
11
—
—
—
0
3
—
—
W.N. Central
1
6
40
33
294
—
0
36
—
1
—
0
60
—
—
Iowa
N
0
0
N
N
—
0
3
—
—
—
0
5
—
—
Kansas
—
0
0
—
85
—
0
3
—
1
—
0
6
—
—
Minnesota
—
0
0
—
—
—
0
6
—
—
—
0
7
—
—
Missouri
—
4
36
10
170
—
0
4
—
—
—
0
1
—
—
Nebraska
—
0
3
—
16
—
0
8
—
—
—
0
22
—
—
North Dakota
1
0
5
11
12
—
0
8
—
—
—
0
11
—
—
South Dakota
—
0
4
12
11
—
0
17
—
—
—
0
28
—
—
S. Atlantic
20
25
48
451
767
—
0
21
—
—
—
0
21
—
—
Delaware
—
0
2
3
2
—
0
1
—
—
—
0
2
—
—
District of Columbia
—
0
2
—
9
—
0
3
—
—
—
0
1
—
—
Florida
18
12
24
254
430
—
0
5
—
—
—
0
5
—
—
Georgia
—
1
6
24
17
—
0
6
—
—
—
0
10
—
—
Maryland
N
0
0
N
N
—
0
5
—
—
—
0
4
—
—
North Carolina
N
0
0
N
N
—
0
3
—
—
—
0
0
—
—
South Carolina
—
0
13
52
1
—
0
5
—
—
—
0
2
—
—
Virginia
2
8
21
90
193
—
0
4
—
—
—
0
3
—
—
West Virginia
—
2
12
28
115
—
0
1
—
—
—
0
3
—
—
E.S. Central
3
3
9
62
88
—
0
20
—
—
—
0
22
1
1
Alabama
3
3
9
61
83
—
0
7
—
—
—
0
4
—
1
Kentucky
N
0
0
N
N
—
0
4
—
—
—
0
2
—
—
Mississippi
—
0
1
1
5
—
0
12
—
—
—
0
17
1
—
Tennessee
N
0
0
N
N
—
0
4
—
—
—
0
2
—
—
W.S. Central
56
37
210
588
924
—
2
145
—
—
—
1
166
—
—
Arkansas
—
4
19
62
76
—
0
9
—
—
—
0
3
—
—
Louisiana
—
0
6
17
27
—
0
18
—
—
—
0
26
—
—
Oklahoma
N
0
0
N
N
—
0
24
—
—
—
0
22
—
—
Texas
56
33
208
509
821
—
2
105
—
—
—
1
131
—
—
Mountain
3
19
44
225
738
—
0
37
—
1
—
0
22
—
—
Arizona
—
5
21
7
246
—
0
10
—
1
—
0
7
—
—
Colorado
—
7
17
69
227
—
0
17
—
—
—
0
13
—
—
Idaho
N
0
0
N
N
—
0
1
—
—
—
0
3
—
—
Montana
1
2
8
29
48
—
0
1
—
—
—
0
2
—
—
Nevada
N
0
0
N
N
—
0
1
—
—
—
0
2
—
—
New Mexico
—
1
5
24
54
—
0
9
—
—
—
0
5
—
—
Utah
—
5
13
92
155
—
0
1
—
—
—
0
1
—
—
Wyoming
2
0
3
4
8
—
0
1
—
—
—
0
2
—
—
Pacific
1
2
8
22
41
—
0
33
—
—
—
0
26
—
—
Alaska
—
1
4
14
23
—
0
0
—
—
—
0
0
—
—
California
1
0
4
4
7
—
0
33
—
—
—
0
25
—
—
Hawaii
—
1
2
4
11
—
0
0
—
—
—
0
0
—
—
Oregon
N
0
0
N
N
—
0
0
—
—
—
0
2
—
—
Washington
N
0
0
N
N
—
0
4
—
—
—
0
0
—
—
Territories
American Samoa
N
0
0
N
N
—
0
0
—
—
—
0
0
—
—
C.N.M.I.
—
—
—
—
—
—
—
—
—
—
—
—
—
—
—
Guam
—
—
—
—
—
—
—
—
—
—
—
—
—
—
—
Puerto Rico
—
0
4
—
49
—
0
1
—
—
—
0
0
—
—
U.S. Virgin Islands
—
0
0
—
—
—
0
0
—
—
—
0
0
—
—
C.N.M.I.: Commonwealth of Northern Mariana Islands.
U: Unavailable. —: No reported cases. N: Not reportable. NN: Not Nationally Notifiable. Cum: Cumulative year-to-date counts. Med: Median. Max: Maximum.
† Updated weekly from reports to the Division of Vector-Borne Infectious Diseases, National Center for Zoonotic, Vector-Borne, and Enteric Diseases (ArboNET Surveillance). Data for California serogroup, eastern equine, Powassan, St. Louis, and western equine diseases are available in Table I.
§ Not reportable in all states. Data from states where the condition is not reportable are excluded from this table, except starting in 2007 for the domestic arboviral diseases and influenza-associated pediatric mortality, and in 2003 for SARS-CoV. Reporting exceptions are available at http://wwwn.cdc.gov/nndss/document/SRCA_FINAL_REPORT_2006-2012_final.xlsx.
TABLE III. Deaths in 122 U.S. cities,* week ending April 27, 2013 (17th week)
Reporting area
All causes, by age (years)
P&I† Total
Reporting area (Continued)
All causes, by age (years)
P&I† Total
All Ages
=65
45–64
25–44
1–24
<1
All Ages
=65
45–64
25–44
1–24
<1
New England
580
409
126
28
9
8
42
S. Atlantic
861
539
236
54
15
17
67
Boston, MA
151
92
35
11
5
8
15
Atlanta, GA
122
70
36
12
1
3
11
Bridgeport, CT
34
28
5
1
—
—
1
Baltimore, MD
173
101
52
11
3
6
15
Cambridge, MA
18
16
2
—
—
—
2
Charlotte, NC
138
96
35
5
—
2
13
Fall River, MA
29
23
3
3
—
—
1
Jacksonville, FL
U
U
U
U
U
U
U
Hartford, CT
68
49
16
2
1
—
7
Miami, FL
66
46
12
5
3
—
3
Lowell, MA
24
16
7
1
—
—
1
Norfolk, VA
57
35
13
6
2
1
1
Lynn, MA
9
6
3
—
—
—
—
Richmond, VA
57
31
21
4
1
—
2
New Bedford, MA
31
23
6
2
—
—
2
Savannah, GA
74
49
20
4
1
—
5
New Haven, CT
32
20
8
3
1
—
2
St. Petersburg, FL
57
40
14
1
1
1
3
Providence, RI
63
48
14
1
—
—
6
Tampa, FL
16
8
7
—
—
1
2
Somerville, MA
U
U
U
U
U
U
U
Washington, D.C.
89
55
23
5
3
3
9
Springfield, MA
31
20
10
—
1
—
3
Wilmington, DE
12
8
3
1
—
—
3
Waterbury, CT
37
29
6
2
—
—
2
E.S. Central
970
633
253
45
20
18
63
Worcester, MA
53
39
11
2
1
—
—
Birmingham, AL
179
120
39
9
6
4
21
Mid. Atlantic
1,706
1,211
377
85
20
13
85
Chattanooga, TN
105
73
27
3
2
—
9
Albany, NY
42
25
11
1
1
4
3
Knoxville, TN
108
76
23
6
3
—
1
Allentown, PA
21
16
5
—
—
—
2
Lexington, KY
71
42
22
3
—
4
—
Buffalo, NY
90
64
21
2
—
3
6
Memphis, TN
182
110
55
9
4
4
7
Camden, NJ
20
12
4
4
—
—
2
Mobile, AL
104
75
22
4
2
1
5
Elizabeth, NJ
12
8
4
—
—
—
2
Montgomery, AL
56
34
21
1
—
—
8
Erie, PA
55
41
12
2
—
—
6
Nashville, TN
165
103
44
10
3
5
12
Jersey City, NJ
19
14
5
—
—
—
1
W.S. Central
1,616
1,059
409
93
26
29
87
New York City, NY
1,073
753
243
59
14
4
44
Austin, TX
93
53
26
9
—
5
5
Newark, NJ
26
11
10
5
—
—
1
Baton Rouge, LA
89
66
17
3
2
1
4
Paterson, NJ
17
9
4
2
—
2
4
Corpus Christi, TX
55
39
13
3
—
—
5
Philadelphia, PA
U
U
U
U
U
U
U
Dallas, TX
217
125
60
21
4
7
18
Pittsburgh, PA§
46
36
8
2
—
—
—
El Paso, TX
128
92
28
7
1
—
7
Reading, PA
36
28
6
2
—
—
—
Fort Worth, TX
U
U
U
U
U
U
U
Rochester, NY
67
47
16
1
3
—
5
Houston, TX
514
336
129
23
15
11
18
Schenectady, NY
14
9
5
—
—
—
—
Little Rock, AR
83
52
24
4
2
1
2
Scranton, PA
28
21
6
1
—
—
—
New Orleans, LA
39
25
9
5
—
—
—
Syracuse, NY
89
76
10
3
—
—
7
San Antonio, TX
267
180
67
16
1
3
19
Trenton, NJ
12
7
4
—
1
—
—
Shreveport, LA
71
43
25
1
1
1
5
Utica, NY
15
12
1
1
1
—
—
Tulsa, OK
60
48
11
1
—
—
4
Yonkers, NY
24
22
2
—
—
—
2
Mountain
1,300
881
297
82
21
15
87
E.N. Central
2,018
1,374
448
125
38
33
135
Albuquerque, NM
123
98
19
2
3
1
12
Akron, OH
65
44
12
2
4
3
2
Boise, ID
71
54
11
3
1
2
5
Canton, OH
39
31
5
2
—
1
4
Colorado Springs, CO
79
62
8
3
4
2
1
Chicago, IL
208
137
44
20
4
3
13
Denver, CO
116
73
25
12
2
4
4
Cincinnati, OH
95
55
30
4
2
4
5
Las Vegas, NV
319
207
85
23
2
2
18
Cleveland, OH
282
210
48
16
5
3
17
Ogden, UT
26
21
5
—
—
—
3
Columbus, OH
227
145
58
15
6
3
18
Phoenix, AZ
196
108
68
16
2
2
22
Dayton, OH
138
100
29
7
—
2
17
Pueblo, CO
46
35
9
2
—
—
4
Detroit, MI
136
63
56
10
3
4
4
Salt Lake City, UT
144
98
29
10
6
1
10
Evansville, IN
56
43
10
2
—
1
8
Tucson, AZ
180
125
38
11
1
1
8
Fort Wayne, IN
69
51
13
4
—
1
4
Pacific
1,777
1,244
390
89
31
23
152
Gary, IN
11
7
2
2
—
—
—
Berkeley, CA
12
9
3
—
—
—
—
Grand Rapids, MI
60
44
12
3
1
—
6
Fresno, CA
127
98
22
5
—
2
14
Indianapolis, IN
179
107
46
17
5
4
13
Glendale, CA
31
26
4
1
—
—
5
Lansing, MI
55
39
13
2
—
1
2
Honolulu, HI
83
60
16
—
4
3
5
Milwaukee, WI
92
62
20
6
3
1
6
Long Beach, CA
53
27
19
4
1
2
3
Peoria, IL
59
42
7
7
2
1
2
Los Angeles, CA
288
177
75
19
11
6
32
Rockford, IL
39
28
10
1
—
—
4
Pasadena, CA
20
13
7
—
—
—
2
South Bend, IN
47
42
5
—
—
—
4
Portland, OR
112
80
24
7
1
—
3
Toledo, OH
96
72
18
3
2
1
2
Sacramento, CA
205
144
50
7
3
1
16
Youngstown, OH
65
52
10
2
1
—
4
San Diego, CA
157
113
27
10
3
4
17
W.N. Central
662
445
150
41
10
15
39
San Francisco, CA
121
83
27
9
1
1
10
Des Moines, IA
80
60
15
2
1
2
9
San Jose, CA
220
171
32
12
2
3
17
Duluth, MN
43
27
10
4
2
—
2
Santa Cruz, CA
22
15
4
2
1
—
2
Kansas City, KS
23
16
6
1
—
—
—
Seattle, WA
127
93
31
2
—
1
9
Kansas City, MO
107
71
29
1
1
4
2
Spokane, WA
71
46
22
1
2
—
7
Lincoln, NE
45
35
7
2
1
—
2
Tacoma, WA
128
89
27
10
2
—
10
Minneapolis, MN
63
39
11
7
3
3
7
Total¶
11,490
7,795
2,686
642
190
171
757
Omaha, NE
90
67
16
5
—
2
8
St. Louis, MO
67
34
19
10
2
2
1
St. Paul, MN
46
31
10
3
—
2
3
Wichita, KS
98
65
27
6
—
—
5
U: Unavailable. —: No reported cases.
* Mortality data in this table are voluntarily reported from 122 cities in the United States, most of which have populations of >100,000. A death is reported by the place of its occurrence and by the week that the death certificate was filed. Fetal deaths are not included.
† Pneumonia and influenza.
§ Because of changes in reporting methods in this Pennsylvania city, these numbers are partial counts for the current week. Complete counts will be available in 4 to 6 weeks.