Persons using assistive technology might not be able to fully access information in this file. For assistance, please send e-mail to: mmwrq@cdc.gov. Type 508 Accommodation and the title of the report in the subject line of e-mail.
Notifiable Diseases and Mortality Tables
Table I Summary of provisional cases of selected notifiable diseases, United States, cumulative, week ending May 25, 2013 (21st Week)
Figure I Selected notifiable disease reports, United States, comparison of provisional 4-week totals ending May 25, 2013, with historical data
Table II Provisional cases of selected notifiable diseases, United States, weeks ending May 25, 2013 and May 26, 2012 (21st Week)
Table III Deaths in 122 U.S. cities, week ending May 25, 2013 (21st Week)
TABLE I. Provisional cases of infrequently reported notifiable diseases (<1,000 cases reported during the preceding year) — United States, week ending May 25, 2013 (21st week)*
TABLE I. (Continued) Provisional cases of infrequently reported notifiable diseases (<1,000 cases reported during the preceding year) — United States, week ending May 25, 2013 (21st week)*
—: No reported cases. N: Not reportable. NN: Not Nationally Notifiable. Cum: Cumulative year-to-date counts.
† Calculated by summing the incidence counts for the current week, the 2 weeks preceding the current week, and the 2 weeks following the current week, for a total of 5 preceding years. The total sum of incident cases is then divided by 25 weeks. Additional information is available at http://wwwn.cdc.gov/nndss/document/5yearweeklyaverage.pdf.
§ Not reportable in all states. Data from states where the condition is not reportable are excluded from this table except starting in 2007 for the arboviral diseases, STD data, TB data, and influenza-associated pediatric mortality, and in 2003 for SARS-CoV. Reporting exceptions are available at http://wwwn.cdc.gov/nndss/document/SRCA_FINAL_REPORT_2006-2012_final.xlsx.
¶ Includes both neuroinvasive and nonneuroinvasive. Updated weekly from reports to the Division of Vector-Borne Infectious Diseases, National Center for Zoonotic, Vector-Borne, and Enteric Diseases (ArboNET Surveillance). Data for West Nile virus are available in Table II.
** Data for H. influenzae (all ages, all serotypes) are available in Table II.
†† Updated weekly from reports to the Influenza Division, National Center for Immunization and Respiratory Diseases. Since September 30, 2012, 149 influenza-associated pediatric deaths occurring during the 2012-13 influenza season have been reported. One influenza-associated pediatric death occurring during the 2010-11 influenza season has been reported from Kansas.
§§ The one measles case reported for the current week was imported.
¶¶ Data for meningococcal disease (all serogroups) are available in Table II.
*** CDC discontinued reporting of individual confirmed and probable cases of 2009 pandemic influenza A (H1N1) virus infections on July 24, 2009. During 2009, four cases of human infection with novel influenza A viruses, different from the 2009 pandemic influenza A (H1N1) strain, were reported to CDC. The four cases of novel influenza A virus infection reported to CDC during 2010, the fourteen cases reported during 2011, and the 313 cases reported during 2012 are different from the 2009 pandemic influenza A (H1N1) virus. Total case counts are provided by the Influenza Division, National Center for Immunization and Respiratory Diseases (NCIRD).
††† No rubella cases were reported for the current week.
§§§ Updated weekly from reports to the Division of STD Prevention, National Center for HIV/AIDS, Viral Hepatitis, STD, and TB Prevention.
¶¶¶ There were no cases of viral hemorrhagic fever reported during the current week. See Table II for dengue hemorrhagic fever.
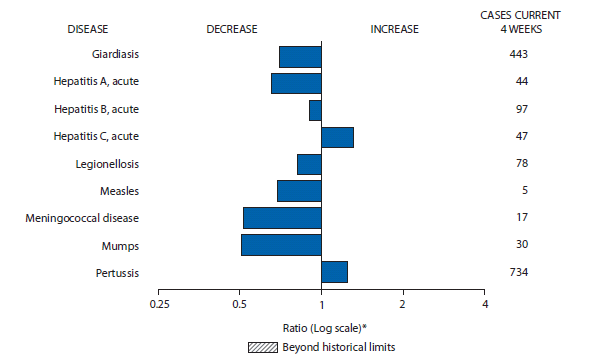
FIGURE I. Selected notifiable disease reports, United States, comparison of provisional 4-week totals May 25, 2013, with historical data
* Ratio of current 4-week total to mean of 15 4-week totals (from previous, comparable, and subsequent 4-week periods for the past 5 years). The point where the hatched area begins is based on the mean and two standard deviations of these 4-week totals.
Alternate Text: The figure above shows selected notifiable disease reports for the United States, with comparison of provisional 4-week totals through May 25, 2013, with historical data. Reports of acute hepatitis C and pertussis increased. Reports of giardiasis, acute hepatitis A, acute hepatitis B, legionellosis, measles, meningococcal disease, and mumps all decreased.
TABLE II. Provisional cases of selected notifiable diseases, United States, weeks ending May 25, 2013, and May 26, 2012 (21st week)*
Reporting area
Chlamydia trachomatis infection
Coccidioidomycosis
Cryptosporidiosis
Current week
Previous 52 weeks
Cum 2013
Cum 2012
Current week
Previous 52 weeks
Cum 2013
Cum 2012
Current week
Previous 52 weeks
Cum 2013
Cum 2012
Med
Max
Med
Max
Med
Max
United States
10,577
26,879
30,877
515,608
580,244
69
238
473
2,677
8,670
34
110
302
1,679
2,547
New England
472
927
1,340
17,326
19,714
—
0
1
1
1
1
7
19
73
116
Connecticut
—
231
560
3,806
5,131
N
0
0
N
N
—
0
3
6
15
Maine
—
62
102
809
1,337
N
0
0
N
N
—
1
4
11
18
Massachusetts
383
470
706
9,152
9,386
—
0
0
—
—
—
2
8
35
53
New Hampshire
10
57
81
1,158
1,320
—
0
1
1
—
—
1
4
9
13
Rhode Island
79
79
160
1,734
1,981
—
0
0
—
1
1
0
3
2
3
Vermont
—
33
110
667
559
N
0
0
N
N
—
1
6
10
14
Mid. Atlantic
1,633
3,495
4,483
70,991
74,896
—
0
1
—
3
4
12
41
169
227
New Jersey
181
538
647
11,040
11,406
N
0
0
N
N
—
1
4
11
12
New York (Upstate)
638
735
1,909
14,262
14,049
N
0
0
N
N
—
3
16
44
36
New York City
—
1,166
1,315
21,492
26,850
N
0
0
N
N
—
2
7
18
38
Pennsylvania
814
1,053
1,993
24,197
22,591
—
0
1
—
3
4
6
20
96
141
E.N. Central
1,151
4,183
4,755
74,238
90,112
—
1
3
9
25
7
25
110
364
625
Illinois
35
1,261
1,482
17,197
27,716
N
0
0
N
N
—
2
8
35
71
Indiana
77
567
838
10,571
11,467
N
0
0
N
N
—
2
6
33
77
Michigan
491
895
1,303
17,096
19,555
—
0
2
4
14
1
5
40
67
114
Ohio
296
1,047
1,210
19,973
21,614
—
0
2
3
10
6
8
28
117
199
Wisconsin
252
460
554
9,401
9,760
—
0
1
2
1
—
7
43
112
164
W.N. Central
88
1,538
1,794
25,297
33,398
—
2
7
16
86
2
15
60
229
422
Iowa
15
210
256
3,872
4,810
N
0
0
N
N
—
5
22
70
106
Kansas
—
207
256
3,619
4,644
N
0
0
N
N
—
2
6
26
50
Minnesota
—
340
436
4,384
7,081
—
1
6
13
65
—
4
21
—
103
Missouri
66
538
645
9,997
11,269
—
0
1
3
6
2
4
12
60
74
Nebraska
—
112
185
1,141
2,881
—
0
0
—
1
—
2
10
31
32
North Dakota
—
55
74
745
1,129
—
0
4
—
14
—
0
4
7
14
South Dakota
7
78
109
1,539
1,584
N
0
0
N
N
—
2
6
35
43
S. Atlantic
3,404
5,420
6,524
110,512
119,163
1
0
1
2
3
11
18
54
349
466
Delaware
103
91
322
2,175
1,549
—
0
1
—
—
—
0
2
2
7
District of Columbia
89
129
284
3,016
2,895
—
0
0
—
—
N
0
0
N
N
Florida
728
1,524
1,777
30,739
32,196
N
0
0
N
N
8
8
24
116
179
Georgia
787
956
1,246
18,379
22,686
N
0
0
N
N
—
4
14
86
117
Maryland
285
480
1,211
8,890
8,659
1
0
1
2
3
1
1
5
22
39
North Carolina
703
969
1,770
20,572
23,023
N
0
0
N
N
—
0
28
49
35
South Carolina
—
512
872
10,622
11,380
N
0
0
N
N
1
1
4
29
29
Virginia
639
637
1,018
14,098
14,874
N
0
0
N
N
1
2
7
40
56
West Virginia
70
93
149
2,021
1,901
N
0
0
N
N
—
0
3
5
4
E.S. Central
917
1,936
2,545
36,016
43,224
—
0
0
—
—
1
4
14
82
114
Alabama
—
563
871
10,825
12,572
N
0
0
N
N
—
2
6
37
44
Kentucky
345
329
773
6,863
6,533
N
0
0
N
N
1
1
4
17
16
Mississippi
356
368
678
7,900
10,356
N
0
0
N
N
—
0
4
13
17
Tennessee
216
606
735
10,428
13,763
N
0
0
N
N
—
1
4
15
37
W.S. Central
443
3,523
8,645
68,009
71,510
—
0
1
2
—
1
10
46
148
165
Arkansas
217
330
394
6,699
6,919
N
0
0
N
N
—
1
5
8
13
Louisiana
174
442
2,110
5,793
8,325
—
0
1
2
—
—
3
8
53
44
Oklahoma
52
140
5,044
7,588
5,193
N
0
0
N
N
—
1
13
20
30
Texas
—
2,444
3,700
47,929
51,073
N
0
0
N
N
1
5
28
67
78
Mountain
799
1,758
2,048
32,250
38,531
49
169
398
1,810
6,553
—
10
48
124
204
Arizona
—
525
755
7,749
12,596
47
166
394
1,766
6,451
—
1
4
11
12
Colorado
416
419
584
8,745
8,887
N
0
0
N
N
—
1
7
6
25
Idaho
—
85
198
1,592
1,825
N
0
0
N
N
—
3
25
36
41
Montana
60
70
108
1,453
1,631
—
0
1
1
2
—
1
5
21
35
Nevada
201
219
325
4,536
4,572
2
1
6
27
53
—
0
2
7
8
New Mexico
89
214
401
5,038
5,064
—
0
3
8
21
—
1
4
9
47
Utah
33
148
179
2,706
3,138
—
0
4
6
23
—
2
22
33
23
Wyoming
—
35
67
431
818
—
0
1
2
3
—
0
4
1
13
Pacific
1,670
4,112
5,231
80,969
89,696
19
63
89
837
1,999
7
10
25
141
208
Alaska
30
105
149
2,215
2,300
N
0
0
N
N
—
0
1
—
2
California
1,020
3,166
4,239
61,624
69,127
19
63
89
836
1,999
6
6
14
85
103
Hawaii
—
123
153
2,068
2,499
N
0
0
N
N
—
0
1
—
2
Oregon
285
259
471
5,973
5,778
—
0
1
1
—
1
3
10
34
75
Washington
335
466
632
9,089
9,992
—
0
7
—
—
—
1
16
22
26
Territories
American Samoa
—
12
59
—
—
N
0
0
N
N
N
0
0
N
N
C.N.M.I.
—
—
—
—
—
—
—
—
—
—
—
—
—
—
—
Guam
—
—
—
—
—
—
—
—
—
—
—
—
—
—
—
Puerto Rico
91
111
307
2,350
2,821
N
0
0
N
N
N
0
0
N
N
U.S. Virgin Islands
—
14
25
159
324
—
0
0
—
—
—
0
0
—
—
C.N.M.I.: Commonwealth of Northern Mariana Islands.
U: Unavailable. —: No reported cases. N: Not reportable. NN: Not Nationally Notifiable. Cum: Cumulative year-to-date counts. Med: Median. Max: Maximum.
† Data for meningococcal disease, invasive caused by serogroups A, C, Y, and W-135; serogroup B; other serogroup; and unknown serogroup are available in Table I.
TABLE II. (Continued) Provisional cases of selected notifiable diseases, United States, weeks ending May 25, 2013, and May 26, 2012 (21st week)*
Reporting area
Rabies, animal
Salmonellosis
Shiga toxin-producing E. coli (STEC)†
Current week
Previous 52 weeks
Cum 2013
Cum 2012
Current week
Previous 52 weeks
Cum 2013
Cum 2012
Current week
Previous 52 weeks
Cum 2013
Cum 2012
Med
Max
Med
Max
Med
Max
United States
31
71
140
1,003
1,498
383
1,017
1,723
10,744
13,574
50
110
212
1,158
1,626
New England
4
6
16
116
162
2
38
73
554
607
—
4
9
59
48
Connecticut
1
3
8
47
77
—
7
19
102
145
—
1
5
16
13
Maine
1
1
4
22
48
1
3
11
45
43
—
0
4
8
1
Massachusetts
—
0
0
—
—
—
21
54
311
317
—
2
6
19
26
New Hampshire
2
1
3
15
7
—
3
9
42
39
—
0
4
9
3
Rhode Island
—
0
5
9
9
—
1
7
28
35
—
0
1
—
—
Vermont
—
1
7
23
21
1
1
7
26
28
—
0
3
7
5
Mid. Atlantic
3
12
32
113
273
27
84
187
1,215
1,517
5
11
26
141
180
New Jersey
—
0
0
—
—
—
15
48
184
353
—
2
7
19
51
New York (Upstate)
3
6
20
113
119
—
23
74
308
366
—
4
15
54
49
New York City
—
0
2
—
—
4
19
49
319
338
—
1
7
25
33
Pennsylvania
—
6
15
—
154
23
29
62
404
460
5
3
12
43
47
E.N. Central
1
1
7
13
24
38
88
239
1,172
1,680
6
16
77
167
274
Illinois
1
0
1
5
—
—
30
79
345
534
—
3
16
24
47
Indiana
—
0
2
—
—
—
10
41
126
209
—
2
23
18
61
Michigan
—
0
5
3
19
2
15
46
266
308
1
3
41
39
70
Ohio
—
0
7
5
5
36
24
50
361
368
4
4
20
65
39
Wisconsin
N
0
0
N
N
—
12
36
74
261
1
3
21
21
57
W.N. Central
—
3
48
49
81
16
46
150
648
963
3
16
42
148
253
Iowa
—
0
5
—
8
2
10
32
141
138
—
3
15
23
26
Kansas
—
1
5
28
28
—
9
18
108
154
—
1
7
19
25
Minnesota
—
0
0
—
—
—
10
44
—
240
—
3
16
—
42
Missouri
—
0
2
16
13
11
18
46
239
274
3
5
18
79
114
Nebraska
—
0
0
—
—
3
4
26
84
87
—
1
6
16
22
North Dakota
—
0
46
—
6
—
1
5
23
22
—
0
3
4
10
South Dakota
—
0
4
5
26
—
3
9
53
48
—
1
4
7
14
S. Atlantic
3
19
34
320
451
172
270
622
2,884
3,865
8
10
72
189
147
Delaware
—
0
0
—
—
1
2
10
17
39
—
0
3
2
3
District of Columbia
—
0
0
—
—
—
0
3
10
21
—
0
1
1
3
Florida
—
0
20
42
103
100
110
272
1,412
1,462
5
2
10
76
30
Georgia
—
0
0
—
—
5
41
110
370
641
1
3
6
45
44
Maryland
—
6
17
99
119
12
14
40
234
305
2
1
5
18
16
North Carolina
—
0
0
—
—
31
24
164
319
703
—
1
61
21
23
South Carolina
—
0
0
—
—
9
20
72
213
329
—
0
7
3
8
Virginia
—
11
23
157
195
14
22
46
281
305
—
1
6
16
18
West Virginia
3
1
4
22
34
—
3
15
28
60
—
0
2
7
2
E.S. Central
—
1
5
15
32
14
60
210
648
920
5
5
13
74
112
Alabama
—
0
5
10
27
2
17
59
181
272
—
1
5
18
23
Kentucky
—
0
3
4
4
—
11
53
129
143
1
1
9
17
20
Mississippi
—
0
1
1
1
—
14
65
138
240
—
0
3
6
7
Tennessee
—
0
0
—
—
12
17
63
200
265
4
2
5
33
62
W.S. Central
20
12
60
351
357
56
157
432
1,325
1,839
15
10
126
137
208
Arkansas
1
0
34
92
75
12
16
229
117
149
1
1
10
19
25
Louisiana
—
0
1
—
1
—
25
62
206
375
—
0
3
3
11
Oklahoma
—
0
23
22
25
11
15
34
185
175
4
1
11
22
27
Texas
19
11
40
237
256
33
87
329
817
1,140
10
7
105
93
145
Mountain
—
1
16
5
42
12
45
82
640
752
3
9
45
79
152
Arizona
N
0
0
N
N
4
15
31
234
236
—
2
8
13
43
Colorado
—
0
0
—
—
—
9
19
59
186
—
2
9
2
39
Idaho
—
0
15
—
—
2
2
7
37
49
2
1
30
18
22
Montana
N
0
0
N
N
2
2
7
28
26
—
1
5
12
8
Nevada
—
0
4
4
1
4
3
12
66
63
1
0
5
10
10
New Mexico
—
0
3
1
34
—
6
20
111
80
—
1
5
6
14
Utah
—
0
2
—
2
—
4
15
91
90
—
1
15
16
11
Wyoming
—
0
6
—
5
—
1
8
14
22
—
0
3
2
5
Pacific
—
3
14
21
76
46
96
181
1,658
1,431
5
13
44
164
252
Alaska
—
0
2
6
5
2
1
5
21
22
N
0
0
N
N
California
—
2
12
13
70
35
74
134
1,255
964
1
7
21
81
150
Hawaii
—
0
0
—
—
—
5
58
86
104
—
0
5
13
5
Oregon
—
0
2
2
1
—
8
15
109
123
1
3
11
33
56
Washington
—
0
9
—
—
9
13
70
187
218
3
3
24
37
41
Territories
American Samoa
—
0
0
—
—
—
1
2
—
1
—
0
0
—
—
C.N.M.I.
—
—
—
—
—
—
—
—
—
—
—
—
—
—
—
Guam
—
—
—
—
—
—
—
—
—
—
—
—
—
—
—
Puerto Rico
—
0
0
—
27
—
0
4
—
23
—
0
2
—
—
U.S. Virgin Islands
—
0
0
—
—
—
0
0
—
—
—
0
0
—
—
C.N.M.I.: Commonwealth of Northern Mariana Islands.
U: Unavailable. —: No reported cases. N: Not reportable. NN: Not Nationally Notifiable. Cum: Cumulative year-to-date counts. Med: Median. Max: Maximum.
† Illnesses with similar clinical presentation that result from Spotted fever group rickettsia infections are reported as Spotted fever rickettsioses. Rocky Mountain spotted fever (RMSF) caused by Rickettsia rickettsii, is the most common and well-known spotted fever.
TABLE II. (Continued) Provisional cases of selected notifiable diseases, United States, weeks ending May 25, 2013, and May 26, 2012 (21st week)*
Reporting area
Streptococcus pneumoniae,† invasive disease
Syphilis, primary and secondary
All ages
Age <5
Current week
Previous 52 weeks
Cum 2013
Cum 2012
Current week
Previous 52 weeks
Cum 2013
Cum 2012
Current week
Previous 52 weeks
Cum 2013
Cum 2012
Med
Max
Med
Max
Med
Max
United States
134
261
950
7,705
7,546
14
22
55
496
582
76
307
391
5,316
5,947
New England
2
11
55
313
339
—
1
4
15
32
3
8
16
173
204
Connecticut
—
5
21
169
162
—
0
2
6
10
—
0
4
7
28
Maine
2
2
8
63
56
—
0
1
3
1
—
0
5
2
9
Massachusetts
—
0
4
8
21
—
0
3
5
16
2
6
16
135
127
New Hampshire
—
1
5
39
46
—
0
1
1
4
—
0
4
11
14
Rhode Island
—
0
29
1
26
—
0
0
—
1
1
0
4
16
23
Vermont
—
1
6
33
28
—
0
0
—
—
—
0
2
2
3
Mid. Atlantic
—
39
196
883
1,110
—
2
13
39
51
14
39
59
734
715
New Jersey
—
5
27
8
308
—
0
3
—
17
—
4
10
55
83
New York (Upstate)
—
18
145
493
454
—
1
9
25
24
8
5
32
110
73
New York City
—
13
36
382
348
—
0
3
14
10
—
20
32
378
367
Pennsylvania
N
—
—
N
N
N
0
0
N
N
6
9
19
191
192
E.N. Central
41
56
132
1,632
1,573
4
4
9
86
119
2
31
61
491
708
Illinois
N
0
0
N
N
—
1
3
19
23
—
11
25
148
331
Indiana
—
13
50
307
347
—
1
3
13
14
2
4
10
85
81
Michigan
3
13
30
368
327
—
0
3
22
24
—
5
14
103
113
Ohio
35
21
63
711
639
4
1
6
23
40
—
8
15
133
155
Wisconsin
3
9
26
246
260
—
0
2
9
18
—
2
5
22
28
W.N. Central
3
13
35
318
374
—
2
5
47
44
—
8
18
162
135
Iowa
N
0
0
N
N
N
0
0
N
N
—
1
5
19
18
Kansas
N
0
0
N
N
N
0
0
N
N
—
0
2
9
9
Minnesota
—
8
24
186
210
—
1
3
15
13
—
2
5
42
40
Missouri
N
0
0
N
N
—
1
3
17
18
—
3
9
80
59
Nebraska
2
2
7
75
76
—
0
1
7
5
—
0
2
7
2
North Dakota
—
1
7
2
40
—
0
1
2
—
—
0
1
1
2
South Dakota
1
2
6
55
48
—
0
1
6
8
—
0
2
4
5
S. Atlantic
48
60
143
1,887
1,615
8
5
14
138
122
31
70
184
1,252
1,449
Delaware
—
0
3
17
21
—
0
1
—
—
—
0
5
7
20
District of Columbia
2
1
7
42
34
—
0
1
—
1
4
3
8
81
82
Florida
18
20
59
612
498
3
1
6
45
39
4
25
39
467
565
Georgia
11
18
56
568
439
2
2
6
41
32
5
14
110
222
299
Maryland
7
7
26
253
259
1
0
4
19
16
7
8
14
161
164
North Carolina
N
0
0
N
N
N
0
0
N
N
2
4
34
72
141
South Carolina
9
7
21
258
194
1
0
3
11
12
—
5
10
108
88
Virginia
N
0
0
N
N
—
0
4
15
17
9
5
40
127
87
West Virginia
1
5
23
137
170
1
0
2
7
5
—
0
2
7
3
E.S. Central
11
24
60
783
664
—
2
5
46
45
8
12
25
189
312
Alabama
—
2
10
94
59
—
0
3
11
5
—
3
10
45
89
Kentucky
5
4
12
147
107
—
0
1
5
4
3
2
10
50
44
Mississippi
—
4
12
118
89
—
0
2
10
12
4
1
11
37
71
Tennessee
6
13
41
424
409
—
0
3
20
24
1
4
9
57
108
W.S. Central
19
31
368
970
862
2
3
24
69
87
1
42
66
741
851
Arkansas
—
3
24
100
87
—
0
1
2
10
1
2
13
64
88
Louisiana
—
5
14
128
102
—
0
4
8
8
—
6
20
94
117
Oklahoma
N
0
0
N
N
—
0
2
10
15
—
2
5
36
25
Texas
19
23
340
742
673
2
2
23
49
54
—
32
47
547
621
Mountain
9
29
73
846
933
—
2
7
45
74
3
14
26
236
221
Arizona
7
12
42
486
389
—
1
4
24
26
—
4
8
72
77
Colorado
—
5
22
79
219
—
0
3
4
14
—
4
12
60
59
Idaho
N
0
0
N
N
—
0
1
3
1
—
0
4
2
11
Montana
—
0
3
17
20
—
0
1
3
1
—
0
1
3
—
Nevada
1
2
7
67
55
—
0
1
2
7
3
2
8
55
36
New Mexico
1
5
17
168
149
—
0
2
7
13
—
2
6
27
31
Utah
—
2
11
17
89
—
0
3
2
11
—
1
3
16
7
Wyoming
—
0
3
12
12
—
0
1
—
1
—
0
1
1
—
Pacific
1
4
10
73
76
—
1
2
11
8
14
69
103
1,338
1,352
Alaska
1
2
7
46
51
—
0
1
9
8
—
0
2
7
4
California
N
0
0
N
N
N
0
0
N
N
7
60
85
1,146
1,126
Hawaii
—
1
6
27
25
—
0
2
2
—
—
0
3
7
6
Oregon
N
0
0
N
N
N
0
0
N
N
3
4
15
100
84
Washington
N
0
0
N
N
N
0
0
N
N
4
4
13
78
132
Territories
American Samoa
N
0
0
N
N
—
0
0
—
—
—
0
0
—
—
C.N.M.I.
—
—
—
—
—
—
—
—
—
—
—
—
—
—
—
Guam
—
—
—
—
—
—
—
—
—
—
—
—
—
—
—
Puerto Rico
—
0
0
—
—
—
0
0
—
—
10
7
17
160
101
U.S. Virgin Islands
—
0
0
—
—
—
0
0
—
—
—
0
0
—
—
C.N.M.I.: Commonwealth of Northern Mariana Islands.
U: Unavailable. —: No reported cases. N: Not reportable. NN: Not Nationally Notifiable. Cum: Cumulative year-to-date counts. Med: Median. Max: Maximum.
† Includes drug resistant and susceptible cases of invasive Streptococcus pneumoniae disease among children <5 years and among all ages. Case definition: Isolation of S. pneumoniae from a normally sterile body site (e.g., blood or cerebrospinal fluid).
TABLE II. (Continued) Provisional cases of selected notifiable diseases, United States, weeks ending May 25, 2013, and May 26, 2012 (21st week)*
Reporting area
Varicella (chickenpox)
West Nile virus disease†
Neuroinvasive
Nonneuroinvasive§
Current week
Previous 52 weeks
Cum 2013
Cum 2012
Current week
Previous 52 weeks
Cum 2013
Cum 2012
Current week
Previous 52 weeks
Cum 2013
Cum 2012
Med
Max
Med
Max
Med
Max
United States
91
182
371
3,658
6,848
—
4
323
—
4
—
4
342
1
6
New England
4
19
54
318
720
—
0
8
—
—
—
0
5
—
—
Connecticut
2
5
11
85
108
—
0
2
—
—
—
0
3
—
—
Maine
2
3
10
62
139
—
0
1
—
—
—
0
0
—
—
Massachusetts
—
7
21
128
285
—
0
7
—
—
—
0
3
—
—
New Hampshire
—
1
8
9
69
—
0
1
—
—
—
0
0
—
—
Rhode Island
—
0
10
6
36
—
0
1
—
—
—
0
1
—
—
Vermont
—
1
13
28
83
—
0
1
—
—
—
0
1
—
—
Mid. Atlantic
11
18
44
367
700
—
0
19
—
—
—
0
18
—
—
New Jersey
—
5
19
70
275
—
0
5
—
—
—
0
5
—
—
New York (Upstate)
N
0
0
N
N
—
0
6
—
—
—
0
8
—
—
New York City
—
0
0
—
—
—
0
5
—
—
—
0
2
—
—
Pennsylvania
11
14
34
297
425
—
0
5
—
—
—
0
4
—
—
E.N. Central
23
56
144
1,133
1,808
—
0
91
—
—
—
0
39
—
1
Illinois
3
15
32
307
459
—
0
31
—
—
—
0
18
—
1
Indiana
1
6
26
120
188
—
0
8
—
—
—
0
6
—
—
Michigan
6
15
61
249
469
—
0
33
—
—
—
0
12
—
—
Ohio
12
14
33
323
439
—
0
19
—
—
—
0
12
—
—
Wisconsin
1
6
12
134
253
—
0
11
—
—
—
0
3
—
—
W.N. Central
—
7
46
115
340
—
0
36
—
1
—
0
60
—
2
Iowa
N
0
0
N
N
—
0
3
—
—
—
0
5
—
—
Kansas
—
0
0
—
85
—
0
3
—
1
—
0
6
—
1
Minnesota
—
0
0
—
—
—
0
6
—
—
—
0
7
—
—
Missouri
—
5
42
88
203
—
0
4
—
—
—
0
1
—
—
Nebraska
—
0
1
—
22
—
0
8
—
—
—
0
22
—
—
North Dakota
—
0
5
12
15
—
0
8
—
—
—
0
11
—
—
South Dakota
—
0
4
15
15
—
0
17
—
—
—
0
28
—
1
S. Atlantic
4
25
43
539
878
—
0
21
—
—
—
0
21
—
—
Delaware
—
0
2
8
2
—
0
1
—
—
—
0
2
—
—
District of Columbia
—
0
2
—
9
—
0
3
—
—
—
0
1
—
—
Florida
—
12
24
302
492
—
0
5
—
—
—
0
5
—
—
Georgia
—
1
6
29
20
—
0
6
—
—
—
0
10
—
—
Maryland
N
0
0
N
N
—
0
5
—
—
—
0
4
—
—
North Carolina
N
0
0
N
N
—
0
3
—
—
—
0
0
—
—
South Carolina
4
0
13
73
3
—
0
5
—
—
—
0
2
—
—
Virginia
—
8
21
92
219
—
0
4
—
—
—
0
3
—
—
West Virginia
—
2
12
35
133
—
0
1
—
—
—
0
3
—
—
E.S. Central
2
2
9
74
111
—
0
20
—
1
—
0
22
1
1
Alabama
2
2
9
73
106
—
0
7
—
—
—
0
4
—
1
Kentucky
N
0
0
N
N
—
0
4
—
1
—
0
2
—
—
Mississippi
—
0
1
1
5
—
0
12
—
—
—
0
17
1
—
Tennessee
N
0
0
N
N
—
0
4
—
—
—
0
2
—
—
W.S. Central
45
41
212
801
1,352
—
2
144
—
1
—
1
166
—
1
Arkansas
1
3
20
76
96
—
0
9
—
—
—
0
3
—
—
Louisiana
—
1
6
18
31
—
0
18
—
—
—
0
26
—
—
Oklahoma
N
0
0
N
N
—
0
24
—
—
—
0
22
—
—
Texas
44
34
209
707
1,225
—
2
104
—
1
—
1
131
—
1
Mountain
1
18
44
280
877
—
0
37
—
1
—
0
22
—
—
Arizona
—
2
21
14
317
—
0
10
—
1
—
0
7
—
—
Colorado
—
7
15
85
253
—
0
17
—
—
—
0
13
—
—
Idaho
N
0
0
N
N
—
0
1
—
—
—
0
3
—
—
Montana
1
2
8
41
59
—
0
1
—
—
—
0
2
—
—
Nevada
N
0
0
N
N
—
0
1
—
—
—
0
2
—
—
New Mexico
—
1
5
26
60
—
0
9
—
—
—
0
5
—
—
Utah
—
5
13
110
179
—
0
1
—
—
—
0
1
—
—
Wyoming
—
0
3
4
9
—
0
1
—
—
—
0
2
—
—
Pacific
1
2
8
31
62
—
0
33
—
—
—
0
26
—
1
Alaska
1
1
4
16
34
—
0
0
—
—
—
0
0
—
—
California
—
0
4
5
11
—
0
33
—
—
—
0
25
—
1
Hawaii
—
1
4
10
17
—
0
0
—
—
—
0
0
—
—
Oregon
N
0
0
N
N
—
0
0
—
—
—
0
2
—
—
Washington
N
0
0
N
N
—
0
4
—
—
—
0
0
—
—
Territories
American Samoa
N
0
0
N
N
—
0
0
—
—
—
0
0
—
—
C.N.M.I.
—
—
—
—
—
—
—
—
—
—
—
—
—
—
—
Guam
—
—
—
—
—
—
—
—
—
—
—
—
—
—
—
Puerto Rico
—
0
4
—
60
—
0
1
—
—
—
0
0
—
—
U.S. Virgin Islands
—
0
0
—
—
—
0
0
—
—
—
0
0
—
—
C.N.M.I.: Commonwealth of Northern Mariana Islands.
U: Unavailable. —: No reported cases. N: Not reportable. NN: Not Nationally Notifiable. Cum: Cumulative year-to-date counts. Med: Median. Max: Maximum.
† Updated weekly from reports to the Division of Vector-Borne Infectious Diseases, National Center for Zoonotic, Vector-Borne, and Enteric Diseases (ArboNET Surveillance). Data for California serogroup, eastern equine, Powassan, St. Louis, and western equine diseases are available in Table I.
§ Not reportable in all states. Data from states where the condition is not reportable are excluded from this table, except starting in 2007 for the domestic arboviral diseases and influenza-associated pediatric mortality, and in 2003 for SARS-CoV. Reporting exceptions are available at http://wwwn.cdc.gov/nndss/document/SRCA_FINAL_REPORT_2006-2012_final.xlsx.
TABLE III. Deaths in 122 U.S. cities,* week ending May 25, 2013 (21st week)
Reporting area
All causes, by age (years)
P&I† Total
Reporting area (Continued)
All causes, by age (years)
P&I† Total
All Ages
=65
45–64
25–44
1–24
<1
All Ages
=65
45–64
25–44
1–24
<1
New England
501
346
108
22
13
12
45
S. Atlantic
981
597
262
80
28
14
58
Boston, MA
128
86
30
4
5
3
14
Atlanta, GA
163
101
44
12
3
3
8
Bridgeport, CT
42
28
8
3
3
—
—
Baltimore, MD
173
98
56
14
2
3
14
Cambridge, MA
14
12
2
—
—
—
1
Charlotte, NC
128
92
22
7
6
1
5
Fall River, MA
22
16
4
2
—
—
6
Jacksonville, FL
130
77
39
10
4
—
5
Hartford, CT
46
31
11
2
1
1
4
Miami, FL
45
34
7
2
1
1
3
Lowell, MA
19
14
4
1
—
—
—
Norfolk, VA
34
21
8
3
2
—
1
Lynn, MA
5
5
—
—
—
—
1
Richmond, VA
69
32
27
4
5
1
3
New Bedford, MA
25
23
1
1
—
—
1
Savannah, GA
45
28
12
4
1
—
5
New Haven, CT
37
27
8
—
1
1
6
St. Petersburg, FL
44
34
10
—
—
—
3
Providence, RI
56
38
14
2
1
1
4
Tampa, FL
11
4
3
2
—
2
—
Somerville, MA
3
2
—
1
—
—
—
Washington, D.C.
133
71
33
22
4
3
11
Springfield, MA
35
20
7
2
1
5
2
Wilmington, DE
6
5
1
—
—
—
—
Waterbury, CT
19
11
7
—
1
—
2
E.S. Central
872
574
214
58
17
9
59
Worcester, MA
50
33
12
4
—
1
4
Birmingham, AL
188
117
51
9
9
2
16
Mid. Atlantic
1,614
1,170
369
45
16
14
81
Chattanooga, TN
111
75
29
4
1
2
8
Albany, NY
40
29
8
2
—
1
—
Knoxville, TN
102
75
21
5
1
—
3
Allentown, PA
29
23
4
2
—
—
1
Lexington, KY
81
61
15
4
—
1
10
Buffalo, NY
80
60
17
3
—
—
5
Memphis, TN
136
78
37
19
1
1
12
Camden, NJ
19
7
7
2
—
3
2
Mobile, AL
59
44
10
5
—
—
1
Elizabeth, NJ
10
6
4
—
—
—
—
Montgomery, AL
53
37
11
4
1
—
6
Erie, PA
58
47
10
—
—
1
2
Nashville, TN
142
87
40
8
4
3
3
Jersey City, NJ
20
12
8
—
—
—
4
W.S. Central
1,495
1,002
359
78
28
28
81
New York City, NY
1,000
724
233
23
14
6
40
Austin, TX
92
64
23
2
2
1
8
Newark, NJ
40
28
10
1
1
—
2
Baton Rouge, LA
80
56
19
2
1
2
3
Paterson, NJ
13
8
4
1
—
—
1
Corpus Christi, TX
62
42
16
3
1
—
6
Philadelphia, PA
U
U
U
U
U
U
U
Dallas, TX
205
119
60
11
8
7
10
Pittsburgh, PA§
56
48
7
1
—
—
3
El Paso, TX
88
67
19
—
—
2
4
Reading, PA
31
23
6
1
—
1
3
Fort Worth, TX
U
U
U
U
U
U
U
Rochester, NY
86
55
23
6
1
1
8
Houston, TX
446
297
109
28
8
4
13
Schenectady, NY
20
17
3
—
—
—
—
Little Rock, AR
90
64
18
4
—
4
7
Scranton, PA
14
9
5
—
—
—
1
New Orleans, LA
58
27
13
12
5
1
—
Syracuse, NY
51
42
8
1
—
—
6
San Antonio, TX
268
187
60
15
2
4
26
Trenton, NJ
18
11
5
1
—
1
—
Shreveport, LA
60
39
18
—
1
2
4
Utica, NY
13
10
2
1
—
—
2
Tulsa, OK
46
40
4
1
—
1
—
Yonkers, NY
16
11
5
—
—
—
1
Mountain
1,089
715
255
73
30
16
69
E.N. Central
1,943
1,261
464
124
48
46
115
Albuquerque, NM
128
76
32
11
5
4
13
Akron, OH
41
26
9
4
1
1
5
Boise, ID
72
45
18
6
2
1
5
Canton, OH
35
23
8
2
1
1
2
Colorado Springs, CO
85
57
22
5
—
1
2
Chicago, IL
228
139
58
21
8
2
14
Denver, CO
70
47
17
3
2
1
1
Cincinnati, OH
82
38
34
5
2
3
6
Las Vegas, NV
233
165
51
13
4
—
17
Cleveland, OH
275
182
62
13
6
12
18
Ogden, UT
36
28
7
—
1
—
3
Columbus, OH
206
135
52
10
3
6
7
Phoenix, AZ
156
89
42
16
6
3
10
Dayton, OH
141
103
31
5
1
1
8
Pueblo, CO
31
22
7
—
2
—
—
Detroit, MI
124
70
41
7
2
4
4
Salt Lake City, UT
114
72
24
8
6
4
9
Evansville, IN
41
31
9
1
—
—
4
Tucson, AZ
164
114
35
11
2
2
9
Fort Wayne, IN
60
42
12
4
1
1
1
Pacific
1,684
1,157
381
86
39
19
129
Gary, IN
18
12
6
—
—
—
1
Berkeley, CA
14
9
5
—
—
—
1
Grand Rapids, MI
64
42
14
3
5
—
5
Fresno, CA
134
90
28
13
1
2
11
Indianapolis, IN
204
111
48
25
11
9
12
Glendale, CA
30
20
9
—
1
—
5
Lansing, MI
52
40
7
3
—
2
6
Honolulu, HI
65
47
14
2
2
—
7
Milwaukee, WI
66
44
15
5
1
1
5
Long Beach, CA
55
35
16
1
2
1
2
Peoria, IL
44
28
10
3
1
2
1
Los Angeles, CA
232
151
55
15
7
4
24
Rockford, IL
52
35
12
4
1
—
1
Pasadena, CA
21
15
4
1
1
—
2
South Bend, IN
56
48
7
1
—
—
5
Portland, OR
131
93
25
5
7
1
5
Toledo, OH
84
57
20
5
2
—
6
Sacramento, CA
182
117
53
6
4
2
16
Youngstown, OH
70
55
9
3
2
1
4
San Diego, CA
178
122
37
12
4
1
15
W.N. Central
661
423
162
42
16
17
44
San Francisco, CA
98
64
26
6
1
1
9
Des Moines, IA
76
50
18
7
1
—
5
San Jose, CA
195
145
33
8
4
5
10
Duluth, MN
25
15
9
1
—
—
3
Santa Cruz, CA
40
32
7
—
1
—
6
Kansas City, KS
34
18
11
5
—
—
2
Seattle, WA
112
75
26
9
—
2
4
Kansas City, MO
113
72
32
7
1
1
5
Spokane, WA
60
43
14
2
1
—
2
Lincoln, NE
53
40
10
1
—
2
1
Tacoma, WA
137
99
29
6
3
—
10
Minneapolis, MN
66
41
15
4
3
3
7
Total¶
10,840
7,245
2,574
608
235
175
681
Omaha, NE
91
69
14
2
3
3
10
St. Louis, MO
61
29
18
4
5
4
1
St. Paul, MN
53
32
14
4
—
3
5
Wichita, KS
89
57
21
7
3
1
5
U: Unavailable. —: No reported cases.
* Mortality data in this table are voluntarily reported from 122 cities in the United States, most of which have populations of >100,000. A death is reported by the place of its occurrence and by the week that the death certificate was filed. Fetal deaths are not included.
† Pneumonia and influenza.
§ Because of changes in reporting methods in this Pennsylvania city, these numbers are partial counts for the current week. Complete counts will be available in 4 to 6 weeks.