Persons using assistive technology might not be able to fully access information in this file. For assistance, please send e-mail to: mmwrq@cdc.gov. Type 508 Accommodation and the title of the report in the subject line of e-mail.
Notifiable Diseases and Mortality Tables
Table I Summary of provisional cases of selected notifiable diseases, United States, cumulative, week ending June 1, 2013 (22nd Week)
Figure I Selected notifiable disease reports, United States, comparison of provisional 4-week totals ending June 1, 2013, with historical data
Table II Provisional cases of selected notifiable diseases, United States, weeks ending June 1, 2013 and June 2, 2012 (22nd Week)
Table III Deaths in 122 U.S. cities, week ending June 1, 2013 (22nd Week)
TABLE I. Provisional cases of infrequently reported notifiable diseases (<1,000 cases reported during the preceding year) — United States, week ending June 1, 2013 (22nd week)*
TABLE I. (Continued) Provisional cases of infrequently reported notifiable diseases (<1,000 cases reported during the preceding year) — United States, week ending June 1, 2013 (22nd week)*
—: No reported cases. N: Not reportable. NN: Not Nationally Notifiable. Cum: Cumulative year-to-date counts.
† Calculated by summing the incidence counts for the current week, the 2 weeks preceding the current week, and the 2 weeks following the current week, for a total of 5 preceding years. The total sum of incident cases is then divided by 25 weeks. Additional information is available at http://wwwn.cdc.gov/nndss/document/5yearweeklyaverage.pdf.
§ Not reportable in all states. Data from states where the condition is not reportable are excluded from this table except starting in 2007 for the arboviral diseases, STD data, TB data, and influenza-associated pediatric mortality, and in 2003 for SARS-CoV. Reporting exceptions are available at http://wwwn.cdc.gov/nndss/document/SRCA_FINAL_REPORT_2006-2012_final.xlsx.
¶ Includes both neuroinvasive and nonneuroinvasive. Updated weekly from reports to the Division of Vector-Borne Infectious Diseases, National Center for Zoonotic, Vector-Borne, and Enteric Diseases (ArboNET Surveillance). Data for West Nile virus are available in Table II.
** Data for H. influenzae (all ages, all serotypes) are available in Table II.
†† Updated weekly from reports to the Influenza Division, National Center for Immunization and Respiratory Diseases. Since September 30, 2012, 150 influenza-associated pediatric deaths occurring during the 2012-13 influenza season have been reported. One influenza-associated pediatric death occurring during the 2010-11 influenza season has been reported from Kansas.
§§ Of the four measles cases reported for the current week, one was indigenous and three were imported.
¶¶ Data for meningococcal disease (all serogroups) are available in Table II.
*** CDC discontinued reporting of individual confirmed and probable cases of 2009 pandemic influenza A (H1N1) virus infections on July 24, 2009. During 2009, four cases of human infection with novel influenza A viruses, different from the 2009 pandemic influenza A (H1N1) strain, were reported to CDC. The four cases of novel influenza A virus infection reported to CDC during 2010, the fourteen cases reported during 2011, and the 313 cases reported in 2012 are different from the 2009 pandemic influenza A (H1N1) virus. Total case counts are provided by the Influenza Division, National Center for Immunization and Respiratory Diseases (NCIRD).
††† No rubella cases were reported for the current week.
§§§ Updated weekly from reports to the Division of STD Prevention, National Center for HIV/AIDS, Viral Hepatitis, STD, and TB Prevention.
¶¶¶ There were no cases of viral hemorrhagic fever reported during the current week. See Table II for dengue hemorrhagic fever.
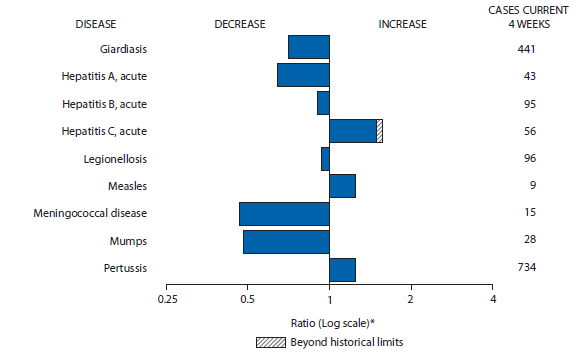
FIGURE I. Selected notifiable disease reports, United States, comparison of provisional 4-week totals June 1, 2013, with historical data
* Ratio of current 4-week total to mean of 15 4-week totals (from previous, comparable, and subsequent 4-week periods for the past 5 years). The point where the hatched area begins is based on the mean and two standard deviations of these 4-week totals.
Alternate Text: The figure above shows selected notifiable disease reports for the United States, with comparison of provisional 4-week totals through June 1, 2013, with historical data. Reports of acute hepatitis C, measles, and pertussis increased, with acute hepatitis C increasing beyond historical limits. Reports of giardiasis, acute hepatitis A, acute hepatitis B, legionellosis, meningococcal disease, and mumps all decreased.
TABLE II. Provisional cases of selected notifiable diseases, United States, weeks ending June 1, 2013, and June 2, 2012 (22nd week)*
Reporting area
Chlamydia trachomatis infection
Coccidioidomycosis
Cryptosporidiosis
Current week
Previous 52 weeks
Cum 2013
Cum 2012
Current week
Previous 52 weeks
Cum 2013
Cum 2012
Current week
Previous 52 weeks
Cum 2013
Cum 2012
Med
Max
Med
Max
Med
Max
United States
9,720
26,867
30,877
542,625
604,188
82
236
473
2,874
8,982
38
110
302
1,771
2,691
New England
675
941
1,340
19,578
20,429
—
0
1
1
1
—
6
19
74
120
Connecticut
138
251
560
5,453
5,309
N
0
0
N
N
—
0
3
6
17
Maine
—
62
102
809
1,393
N
0
0
N
N
—
1
4
11
18
Massachusetts
445
458
706
9,601
9,714
—
0
0
—
—
—
2
8
35
56
New Hampshire
—
57
81
1,158
1,365
—
0
1
1
—
—
1
4
9
14
Rhode Island
79
79
160
1,813
2,018
—
0
0
—
1
—
0
3
2
3
Vermont
13
34
110
744
630
N
0
0
N
N
—
1
6
11
12
Mid. Atlantic
1,492
3,505
4,479
74,339
77,917
—
0
1
—
3
8
12
41
178
237
New Jersey
101
537
646
11,425
11,849
N
0
0
N
N
—
1
4
11
14
New York (Upstate)
699
735
1,909
14,955
14,706
N
0
0
N
N
3
3
16
49
36
New York City
29
1,156
1,315
22,942
27,861
N
0
0
N
N
—
2
7
18
40
Pennsylvania
663
1,054
1,993
25,017
23,501
—
0
1
—
3
5
6
20
100
147
E.N. Central
879
4,146
4,755
77,652
93,311
—
1
3
9
22
2
25
110
387
654
Illinois
17
1,243
1,482
18,037
28,780
N
0
0
N
N
—
3
8
47
79
Indiana
186
564
838
11,234
11,955
N
0
0
N
N
—
2
6
35
79
Michigan
318
888
1,303
17,723
20,016
—
0
2
4
11
—
4
40
69
119
Ohio
171
1,051
1,210
20,845
22,398
—
0
2
3
10
1
8
28
119
209
Wisconsin
187
460
554
9,813
10,162
—
0
1
2
1
1
7
43
117
168
W.N. Central
38
1,538
1,794
26,391
34,655
1
2
7
17
81
2
15
60
242
460
Iowa
2
212
256
4,023
5,001
N
0
0
N
N
—
5
22
72
117
Kansas
18
208
256
3,934
4,831
N
0
0
N
N
—
2
6
28
54
Minnesota
—
341
436
4,384
7,347
—
1
6
13
67
—
4
21
—
110
Missouri
15
538
645
10,064
11,696
1
0
1
4
6
—
4
12
60
81
Nebraska
—
112
185
1,379
2,982
—
0
0
—
1
2
2
10
33
36
North Dakota
3
56
74
1,068
1,164
—
0
2
—
7
—
0
4
14
14
South Dakota
—
77
109
1,539
1,634
N
0
0
N
N
—
2
6
35
48
S. Atlantic
2,161
5,399
6,524
114,156
123,829
1
0
2
3
4
16
18
54
368
497
Delaware
96
92
322
2,271
1,586
—
0
1
—
—
—
0
2
2
7
District of Columbia
103
129
284
3,145
3,043
—
0
1
—
—
N
0
0
N
N
Florida
677
1,524
1,777
32,141
33,472
N
0
0
N
N
14
8
24
130
187
Georgia
604
953
1,246
19,157
23,499
N
0
0
N
N
1
4
14
88
125
Maryland
—
480
1,211
8,890
9,014
1
0
1
3
4
—
1
5
22
40
North Carolina
—
951
1,770
20,572
23,936
N
0
0
N
N
—
0
28
49
43
South Carolina
—
512
872
11,166
11,921
N
0
0
N
N
—
1
4
29
30
Virginia
604
642
1,018
14,702
15,396
N
0
0
N
N
1
2
7
41
61
West Virginia
77
93
149
2,112
1,962
N
0
0
N
N
—
0
3
7
4
E.S. Central
671
1,902
2,545
36,685
44,508
—
0
0
—
—
1
4
14
85
118
Alabama
—
561
871
10,825
13,058
N
0
0
N
N
—
2
6
37
47
Kentucky
232
334
773
7,094
6,689
N
0
0
N
N
1
1
4
20
17
Mississippi
286
366
678
8,185
10,495
N
0
0
N
N
—
0
4
13
17
Tennessee
153
603
735
10,581
14,266
N
0
0
N
N
—
1
4
15
37
W.S. Central
2,044
3,487
8,645
75,753
75,362
—
0
1
2
—
1
10
46
156
169
Arkansas
280
328
394
6,979
7,116
N
0
0
N
N
—
0
5
8
13
Louisiana
218
428
2,110
6,022
9,006
—
0
1
2
—
—
3
8
57
45
Oklahoma
35
155
5,044
7,828
6,041
N
0
0
N
N
—
1
13
20
30
Texas
1,511
2,498
3,700
54,924
53,199
N
0
0
N
N
1
5
28
71
81
Mountain
542
1,747
2,048
33,248
39,995
54
165
398
1,864
6,801
1
10
48
129
216
Arizona
—
516
755
7,749
13,066
54
164
394
1,820
6,691
—
1
4
11
12
Colorado
268
420
586
9,124
9,231
N
0
0
N
N
1
1
7
7
29
Idaho
—
85
198
1,592
1,957
N
0
0
N
N
—
3
25
38
45
Montana
—
69
108
1,453
1,722
—
0
1
1
2
—
1
5
21
35
Nevada
159
218
325
4,723
4,707
—
1
6
27
56
—
0
2
7
8
New Mexico
95
215
401
5,229
5,215
—
0
3
8
22
—
1
4
10
48
Utah
20
150
179
2,836
3,238
—
0
4
6
26
—
3
22
34
25
Wyoming
—
36
67
542
859
—
0
1
2
4
—
0
4
1
14
Pacific
1,218
4,118
5,231
84,823
94,182
26
63
89
978
2,070
7
10
25
152
220
Alaska
15
104
149
2,299
2,401
N
0
0
N
N
—
0
1
—
2
California
903
3,166
4,239
65,094
72,721
26
63
89
977
2,070
5
6
14
92
107
Hawaii
—
123
153
2,068
2,630
N
0
0
N
N
—
0
1
—
2
Oregon
—
261
471
5,973
6,026
—
0
1
1
—
—
3
10
36
81
Washington
300
465
632
9,389
10,404
—
0
7
—
—
2
1
16
24
28
Territories
American Samoa
—
12
59
—
—
N
0
0
N
N
N
0
0
N
N
C.N.M.I.
—
—
—
—
—
—
—
—
—
—
—
—
—
—
—
Guam
—
—
—
—
—
—
—
—
—
—
—
—
—
—
—
Puerto Rico
185
107
307
2,537
2,935
N
0
0
N
N
N
0
0
N
N
U.S. Virgin Islands
—
14
25
159
338
—
0
0
—
—
—
0
0
—
—
C.N.M.I.: Commonwealth of Northern Mariana Islands.
U: Unavailable. —: No reported cases. N: Not reportable. NN: Not Nationally Notifiable. Cum: Cumulative year-to-date counts. Med: Median. Max: Maximum.
† Data for meningococcal disease, invasive caused by serogroups A, C, Y, and W-135; serogroup B; other serogroup; and unknown serogroup are available in Table I.
TABLE II. (Continued) Provisional cases of selected notifiable diseases, United States, weeks ending June 1, 2013, and June 2, 2012 (22nd week)*
Reporting area
Rabies, animal
Salmonellosis
Shiga toxin-producing E. coli (STEC)†
Current week
Previous 52 weeks
Cum 2013
Cum 2012
Current week
Previous 52 weeks
Cum 2013
Cum 2012
Current week
Previous 52 weeks
Cum 2013
Cum 2012
Med
Max
Med
Max
Med
Max
United States
33
70
140
1,084
1,603
443
987
1,723
11,637
14,610
31
110
212
1,283
1,739
New England
4
6
16
123
168
4
36
73
575
659
—
4
9
59
55
Connecticut
—
3
8
49
79
—
7
19
110
158
—
1
5
16
16
Maine
—
1
4
23
49
4
3
11
53
47
—
0
4
8
2
Massachusetts
—
0
0
—
—
—
21
54
311
345
—
2
6
19
29
New Hampshire
—
1
3
15
8
—
3
9
42
43
—
0
4
9
3
Rhode Island
1
0
5
10
10
—
1
7
30
38
—
0
1
—
—
Vermont
3
1
7
26
22
—
1
7
29
28
—
0
3
7
5
Mid. Atlantic
8
11
32
121
287
49
82
187
1,316
1,621
5
11
26
151
190
New Jersey
—
0
0
—
—
—
14
48
194
383
—
2
7
25
53
New York (Upstate)
8
6
20
121
127
26
23
74
357
387
1
4
15
56
51
New York City
—
0
2
—
2
3
19
49
336
364
—
1
7
26
35
Pennsylvania
—
5
15
—
158
20
29
62
429
487
4
4
12
44
51
E.N. Central
2
1
7
15
28
32
86
239
1,294
1,801
4
16
77
184
285
Illinois
—
0
1
5
—
—
30
79
413
568
—
3
17
30
52
Indiana
—
0
2
—
—
—
10
41
134
228
—
1
23
21
62
Michigan
—
0
5
3
22
2
16
46
279
336
—
3
41
42
68
Ohio
2
0
7
7
6
30
24
50
391
396
4
4
20
69
40
Wisconsin
N
0
0
N
N
—
12
36
77
273
—
3
21
22
63
W.N. Central
1
3
48
50
87
16
46
150
717
1,043
5
16
42
172
278
Iowa
—
0
5
—
9
3
10
32
158
157
—
3
15
25
37
Kansas
1
1
5
29
32
2
9
18
135
167
—
2
7
26
27
Minnesota
—
0
0
—
—
—
9
44
—
260
—
3
16
—
45
Missouri
—
0
2
16
13
6
18
46
247
290
3
5
18
85
120
Nebraska
—
0
0
—
—
5
4
26
89
90
2
1
6
18
23
North Dakota
—
0
46
—
6
—
1
5
35
22
—
0
3
11
12
South Dakota
—
0
4
5
27
—
3
9
53
57
—
1
4
7
14
S. Atlantic
12
18
31
371
495
182
242
624
3,129
4,138
5
11
72
200
162
Delaware
—
0
0
—
—
—
2
10
17
40
—
0
3
2
3
District of Columbia
—
0
0
—
—
—
1
3
14
24
—
0
1
3
4
Florida
—
0
20
43
103
86
110
272
1,498
1,557
4
2
10
77
32
Georgia
—
0
0
—
—
12
34
110
396
696
—
3
6
46
47
Maryland
—
6
17
99
129
12
14
40
246
321
—
1
5
20
18
North Carolina
—
0
0
—
—
53
24
164
390
762
—
1
61
21
28
South Carolina
—
0
0
—
—
14
20
72
234
355
—
0
7
3
8
Virginia
12
11
21
207
229
5
22
46
298
319
1
1
6
21
20
West Virginia
—
1
4
22
34
—
3
15
36
64
—
0
2
7
2
E.S. Central
—
1
5
15
32
22
58
210
724
982
2
5
13
84
116
Alabama
—
0
5
10
27
1
17
59
190
285
—
1
5
18
24
Kentucky
—
0
3
4
4
1
11
53
140
155
1
1
9
22
23
Mississippi
—
0
1
1
1
4
14
65
171
251
—
0
3
9
7
Tennessee
—
0
0
—
—
16
16
63
223
291
1
2
5
35
62
W.S. Central
4
12
60
361
375
61
157
432
1,421
1,987
4
11
126
166
216
Arkansas
—
0
34
92
76
11
14
229
129
166
2
1
10
22
26
Louisiana
—
0
1
—
1
2
24
62
225
408
—
0
3
3
11
Oklahoma
—
0
23
22
25
14
15
34
199
187
1
1
11
23
29
Texas
4
11
40
247
273
34
87
329
868
1,226
1
7
105
118
150
Mountain
—
1
16
5
49
6
46
82
681
800
1
8
45
86
164
Arizona
N
0
0
N
N
2
16
31
252
247
—
2
8
15
46
Colorado
—
0
0
—
—
1
9
19
60
200
—
2
9
2
45
Idaho
—
0
15
—
—
2
2
7
40
55
1
1
30
21
23
Montana
N
0
0
N
N
1
2
9
31
27
—
1
5
12
8
Nevada
—
0
4
4
1
—
3
12
70
66
—
0
5
11
10
New Mexico
—
0
3
1
35
—
6
20
115
89
—
1
5
7
15
Utah
—
0
2
—
2
—
4
15
98
94
—
1
15
16
12
Wyoming
—
0
6
—
11
—
1
8
15
22
—
0
3
2
5
Pacific
2
3
14
23
82
71
96
181
1,780
1,579
5
14
44
181
273
Alaska
—
0
2
6
5
2
1
5
24
24
N
0
0
N
N
California
—
2
12
13
75
36
74
134
1,331
1,038
2
7
21
94
160
Hawaii
—
0
0
—
—
2
5
58
102
162
—
0
5
13
5
Oregon
2
0
2
4
2
—
8
15
111
132
—
3
11
34
57
Washington
—
0
9
—
—
31
13
70
212
223
3
3
24
40
51
Territories
American Samoa
—
0
0
—
—
—
1
2
—
1
—
0
0
—
—
C.N.M.I.
—
—
—
—
—
—
—
—
—
—
—
—
—
—
—
Guam
—
—
—
—
—
—
—
—
—
—
—
—
—
—
—
Puerto Rico
—
0
0
—
27
—
0
4
—
23
—
0
2
—
—
U.S. Virgin Islands
—
0
0
—
—
—
0
0
—
—
—
0
0
—
—
C.N.M.I.: Commonwealth of Northern Mariana Islands.
U: Unavailable. —: No reported cases. N: Not reportable. NN: Not Nationally Notifiable. Cum: Cumulative year-to-date counts. Med: Median. Max: Maximum.
† Illnesses with similar clinical presentation that result from Spotted fever group rickettsia infections are reported as Spotted fever rickettsioses. Rocky Mountain spotted fever (RMSF) caused by Rickettsia rickettsii, is the most common and well-known spotted fever.
TABLE II. (Continued) Provisional cases of selected notifiable diseases, United States, weeks ending June 1, 2013, and June 2, 2012 (22nd week)*
Reporting area
Streptococcus pneumoniae,† invasive disease
Syphilis, primary and secondary
All ages
Age <5
Current week
Previous 52 weeks
Cum 2013
Cum 2012
Current week
Previous 52 weeks
Cum 2013
Cum 2012
Current week
Previous 52 weeks
Cum 2013
Cum 2012
Med
Max
Med
Max
Med
Max
United States
135
261
953
7,976
7,782
14
21
55
519
604
60
308
391
5,646
6,211
New England
2
11
55
317
345
—
1
4
15
32
1
8
18
191
210
Connecticut
—
5
21
170
166
—
0
2
6
10
—
0
4
14
28
Maine
1
2
8
64
57
—
0
1
3
1
—
0
5
2
9
Massachusetts
—
0
4
8
21
—
0
3
5
16
1
6
18
145
130
New Hampshire
—
1
5
39
47
—
0
1
1
4
—
0
4
11
15
Rhode Island
—
0
29
1
26
—
0
0
—
1
—
0
4
16
25
Vermont
1
1
6
35
28
—
0
0
—
—
—
0
2
3
3
Mid. Atlantic
28
39
199
933
1,157
2
2
13
44
54
4
39
59
772
750
New Jersey
—
5
27
8
318
—
0
3
—
20
—
4
10
57
85
New York (Upstate)
24
18
148
535
470
2
1
9
28
24
2
5
32
112
78
New York City
4
13
36
390
369
—
0
3
16
10
—
21
32
410
388
Pennsylvania
N
—
—
N
N
N
0
0
N
N
2
9
19
193
199
E.N. Central
19
56
132
1,670
1,611
2
4
9
92
122
2
31
61
527
739
Illinois
N
0
0
N
N
—
1
3
22
24
—
11
25
167
345
Indiana
—
13
50
320
360
—
1
3
14
14
2
4
10
95
83
Michigan
2
13
30
375
333
—
0
3
22
24
—
5
14
105
115
Ohio
16
21
63
727
651
2
1
6
25
42
—
8
15
137
166
Wisconsin
1
8
26
248
267
—
0
2
9
18
—
1
5
23
30
W.N. Central
3
13
35
321
392
1
1
5
48
46
—
8
18
167
139
Iowa
N
0
0
N
N
N
0
0
N
N
—
1
5
19
20
Kansas
N
0
0
N
N
N
0
0
N
N
—
0
2
11
9
Minnesota
—
7
24
186
222
—
1
3
15
15
—
2
5
42
41
Missouri
N
0
0
N
N
1
1
3
18
18
—
3
9
80
60
Nebraska
3
2
7
78
77
—
0
1
7
5
—
0
2
9
2
North Dakota
—
1
7
2
44
—
0
1
2
—
—
0
1
2
2
South Dakota
—
2
6
55
49
—
0
1
6
8
—
0
2
4
5
S. Atlantic
41
60
143
1,971
1,667
6
5
14
145
130
12
70
184
1,288
1,501
Delaware
—
0
3
17
21
—
0
1
—
—
—
0
5
7
20
District of Columbia
1
1
7
44
35
—
0
1
—
1
2
3
8
83
82
Florida
18
20
59
630
517
3
1
6
48
45
1
25
39
483
587
Georgia
12
19
56
605
457
2
2
6
43
32
8
13
110
230
310
Maryland
5
7
26
260
271
—
0
4
19
18
—
8
14
161
173
North Carolina
N
0
0
N
N
N
0
0
N
N
—
3
34
72
148
South Carolina
5
7
21
265
196
1
0
3
13
12
—
5
10
117
89
Virginia
N
0
0
N
N
—
0
4
15
17
1
5
40
128
89
West Virginia
—
5
23
150
170
—
0
2
7
5
—
0
2
7
3
E.S. Central
14
27
60
823
679
—
2
5
47
47
2
12
25
190
319
Alabama
—
2
10
98
59
—
0
3
11
5
—
3
10
45
90
Kentucky
—
5
12
147
107
—
0
1
5
4
1
2
10
51
46
Mississippi
3
4
12
137
93
—
0
2
10
12
1
1
11
37
71
Tennessee
11
13
41
441
420
—
0
3
21
26
—
4
9
57
112
W.S. Central
18
32
368
1,007
885
2
3
24
71
87
22
42
66
849
885
Arkansas
—
3
24
100
90
—
0
1
2
10
4
2
13
68
89
Louisiana
—
5
14
133
105
—
0
4
8
8
—
6
20
99
119
Oklahoma
N
0
0
N
N
1
0
2
11
15
—
2
5
38
25
Texas
18
24
340
774
690
1
2
23
50
54
18
31
47
644
652
Mountain
7
29
64
854
969
—
2
7
45
77
3
14
26
241
233
Arizona
4
12
42
485
403
—
1
4
23
27
—
4
8
72
79
Colorado
—
5
22
79
230
—
0
3
4
15
—
4
12
61
61
Idaho
N
0
0
N
N
—
0
1
3
1
—
0
4
2
11
Montana
1
0
3
18
20
—
0
1
3
1
—
0
1
3
—
Nevada
1
2
7
69
58
—
0
1
2
7
3
3
8
58
39
New Mexico
1
5
17
174
153
—
0
2
8
13
—
2
6
27
36
Utah
—
2
11
17
91
—
0
3
2
12
—
1
3
17
7
Wyoming
—
0
3
12
14
—
0
1
—
1
—
0
1
1
—
Pacific
3
4
10
80
77
1
1
2
12
9
14
68
103
1,421
1,435
Alaska
2
2
7
48
52
1
0
1
10
9
—
0
2
7
4
California
N
0
0
N
N
N
0
0
N
N
13
60
85
1,228
1,197
Hawaii
1
1
6
32
25
—
0
2
2
—
—
0
3
7
6
Oregon
N
0
0
N
N
N
0
0
N
N
—
4
15
100
89
Washington
N
0
0
N
N
N
0
0
N
N
1
4
13
79
139
Territories
American Samoa
N
0
0
N
N
—
0
0
—
—
—
0
0
—
—
C.N.M.I.
—
—
—
—
—
—
—
—
—
—
—
—
—
—
—
Guam
—
—
—
—
—
—
—
—
—
—
—
—
—
—
—
Puerto Rico
—
0
0
—
—
—
0
0
—
—
—
7
17
160
105
U.S. Virgin Islands
—
0
0
—
—
—
0
0
—
—
—
0
0
—
—
C.N.M.I.: Commonwealth of Northern Mariana Islands.
U: Unavailable. —: No reported cases. N: Not reportable. NN: Not Nationally Notifiable. Cum: Cumulative year-to-date counts. Med: Median. Max: Maximum.
† Includes drug resistant and susceptible cases of invasive Streptococcus pneumoniae disease among children <5 years and among all ages. Case definition: Isolation of S. pneumoniae from a normally sterile body site (e.g., blood or cerebrospinal fluid).
TABLE II. (Continued) Provisional cases of selected notifiable diseases, United States, weeks ending June 1, 2013, and June 2, 2012 (22nd week)*
Reporting area
Varicella (chickenpox)
West Nile virus disease†
Neuroinvasive
Nonneuroinvasive§
Current week
Previous 52 weeks
Cum 2013
Cum 2012
Current week
Previous 52 weeks
Cum 2013
Cum 2012
Current week
Previous 52 weeks
Cum 2013
Cum 2012
Med
Max
Med
Max
Med
Max
United States
88
178
315
3,837
7,103
—
4
323
2
7
—
4
342
1
11
New England
3
19
45
325
764
—
0
8
—
—
—
0
5
—
—
Connecticut
—
5
11
85
118
—
0
2
—
—
—
0
3
—
—
Maine
3
3
10
68
139
—
0
1
—
—
—
0
0
—
—
Massachusetts
—
6
17
128
302
—
0
7
—
—
—
0
3
—
—
New Hampshire
—
1
8
9
72
—
0
1
—
—
—
0
0
—
—
Rhode Island
—
0
10
6
42
—
0
1
—
—
—
0
1
—
—
Vermont
—
1
8
29
91
—
0
1
—
—
—
0
1
—
—
Mid. Atlantic
18
18
44
395
737
—
0
19
—
—
—
0
18
—
—
New Jersey
—
5
18
77
284
—
0
5
—
—
—
0
5
—
—
New York (Upstate)
N
0
0
N
N
—
0
6
—
—
—
0
8
—
—
New York City
—
0
0
—
—
—
0
5
—
—
—
0
2
—
—
Pennsylvania
18
13
34
318
453
—
0
5
—
—
—
0
4
—
—
E.N. Central
26
55
145
1,176
1,864
—
0
91
—
—
—
0
39
—
1
Illinois
1
14
32
314
472
—
0
31
—
—
—
0
18
—
1
Indiana
3
6
26
124
180
—
0
8
—
—
—
0
6
—
—
Michigan
4
13
62
261
491
—
0
33
—
—
—
0
12
—
—
Ohio
13
13
33
333
458
—
0
19
—
—
—
0
12
—
—
Wisconsin
5
6
12
144
263
—
0
11
—
—
—
0
3
—
—
W.N. Central
—
7
46
117
354
—
0
36
—
2
—
0
60
—
2
Iowa
N
0
0
N
N
—
0
3
—
—
—
0
5
—
—
Kansas
—
0
0
—
85
—
0
3
—
1
—
0
6
—
1
Minnesota
—
0
0
—
—
—
0
6
—
1
—
0
7
—
—
Missouri
—
5
42
89
217
—
0
4
—
—
—
0
1
—
—
Nebraska
—
0
1
—
22
—
0
8
—
—
—
0
22
—
—
North Dakota
—
0
5
13
15
—
0
8
—
—
—
0
11
—
—
South Dakota
—
0
4
15
15
—
0
17
—
—
—
0
28
—
1
S. Atlantic
9
25
43
580
910
—
0
21
—
1
—
0
21
—
1
Delaware
—
0
2
9
3
—
0
1
—
—
—
0
2
—
—
District of Columbia
—
0
2
—
10
—
0
3
—
—
—
0
1
—
—
Florida
9
12
24
330
504
—
0
5
—
—
—
0
5
—
1
Georgia
—
1
6
30
20
—
0
6
—
1
—
0
10
—
—
Maryland
N
0
0
N
N
—
0
5
—
—
—
0
4
—
—
North Carolina
N
0
0
N
N
—
0
3
—
—
—
0
0
—
—
South Carolina
—
0
13
76
3
—
0
5
—
—
—
0
2
—
—
Virginia
—
8
19
92
235
—
0
4
—
—
—
0
3
—
—
West Virginia
—
2
12
43
135
—
0
1
—
—
—
0
3
—
—
E.S. Central
—
2
9
76
112
—
0
20
—
1
—
0
22
1
1
Alabama
—
2
9
73
107
—
0
7
—
—
—
0
4
—
1
Kentucky
N
0
0
N
N
—
0
4
—
1
—
0
2
—
—
Mississippi
—
0
1
3
5
—
0
12
—
—
—
0
17
1
—
Tennessee
N
0
0
N
N
—
0
4
—
—
—
0
2
—
—
W.S. Central
31
41
212
848
1,400
—
2
144
1
1
—
1
166
—
5
Arkansas
—
3
20
76
98
—
0
9
—
—
—
0
3
—
—
Louisiana
1
1
6
22
37
—
0
18
—
—
—
0
26
—
—
Oklahoma
N
0
0
N
N
—
0
24
—
—
—
0
22
—
—
Texas
30
34
209
750
1,265
—
2
104
1
1
—
1
131
—
5
Mountain
—
18
44
286
896
—
0
37
—
2
—
0
22
—
—
Arizona
—
2
21
14
322
—
0
10
—
2
—
0
7
—
—
Colorado
—
7
15
89
266
—
0
17
—
—
—
0
13
—
—
Idaho
N
0
0
N
N
—
0
1
—
—
—
0
3
—
—
Montana
—
2
8
42
59
—
0
1
—
—
—
0
2
—
—
Nevada
N
0
0
N
N
—
0
1
—
—
—
0
2
—
—
New Mexico
—
1
5
27
60
—
0
9
—
—
—
0
5
—
—
Utah
—
5
13
110
180
—
0
1
—
—
—
0
1
—
—
Wyoming
—
0
3
4
9
—
0
1
—
—
—
0
2
—
—
Pacific
1
2
6
34
66
—
0
33
1
—
—
0
26
—
1
Alaska
1
1
4
18
35
—
0
0
—
—
—
0
0
—
—
California
—
0
4
5
12
—
0
33
1
—
—
0
25
—
1
Hawaii
—
1
4
11
19
—
0
0
—
—
—
0
0
—
—
Oregon
N
0
0
N
N
—
0
0
—
—
—
0
2
—
—
Washington
N
0
0
N
N
—
0
4
—
—
—
0
0
—
—
Territories
American Samoa
N
0
0
N
N
—
0
0
—
—
—
0
0
—
—
C.N.M.I.
—
—
—
—
—
—
—
—
—
—
—
—
—
—
—
Guam
—
—
—
—
—
—
—
—
—
—
—
—
—
—
—
Puerto Rico
—
0
4
—
60
—
0
1
—
—
—
0
0
—
—
U.S. Virgin Islands
—
0
0
—
—
—
0
0
—
—
—
0
0
—
—
C.N.M.I.: Commonwealth of Northern Mariana Islands.
U: Unavailable. —: No reported cases. N: Not reportable. NN: Not Nationally Notifiable. Cum: Cumulative year-to-date counts. Med: Median. Max: Maximum.
† Updated weekly from reports to the Division of Vector-Borne Infectious Diseases, National Center for Zoonotic, Vector-Borne, and Enteric Diseases (ArboNET Surveillance). Data for California serogroup, eastern equine, Powassan, St. Louis, and western equine diseases are available in Table I.
§ Not reportable in all states. Data from states where the condition is not reportable are excluded from this table, except starting in 2007 for the domestic arboviral diseases and influenza-associated pediatric mortality, and in 2003 for SARS-CoV. Reporting exceptions are available at http://wwwn.cdc.gov/nndss/document/SRCA_FINAL_REPORT_2006-2012_final.xlsx.
TABLE III. Deaths in 122 U.S. cities,* week ending June 1, 2013 (22nd week)
Reporting area
All causes, by age (years)
P&I† Total
Reporting area (Continued)
All causes, by age (years)
P&I† Total
All Ages
=65
45–64
25–44
1–24
<1
All Ages
=65
45–64
25–44
1–24
<1
New England
504
348
112
21
12
11
42
S. Atlantic
809
514
206
60
19
10
37
Boston, MA
125
81
32
5
4
3
17
Atlanta, GA
110
68
29
8
3
2
7
Bridgeport, CT
27
18
5
2
1
1
—
Baltimore, MD
166
97
52
13
4
—
9
Cambridge, MA
11
9
2
—
—
—
1
Charlotte, NC
107
74
18
12
1
2
3
Fall River, MA
23
19
3
1
—
—
3
Jacksonville, FL
110
69
28
8
3
2
2
Hartford, CT
44
22
17
2
2
1
3
Miami, FL
51
34
12
3
2
—
—
Lowell, MA
18
15
2
1
—
—
2
Norfolk, VA
62
37
14
8
2
1
1
Lynn, MA
5
4
1
—
—
—
—
Richmond, VA
35
16
15
3
1
—
—
New Bedford, MA
16
11
4
—
1
—
1
Savannah, GA
46
32
9
2
1
2
1
New Haven, CT
37
24
9
2
—
2
5
St. Petersburg, FL
36
28
7
1
—
—
2
Providence, RI
75
60
9
3
1
2
—
Tampa, FL
9
5
2
1
1
—
1
Somerville, MA
U
U
U
U
U
U
U
Washington, D.C.
65
45
17
1
1
1
9
Springfield, MA
40
28
10
2
—
—
1
Wilmington, DE
12
9
3
—
—
—
2
Waterbury, CT
28
14
10
2
2
—
1
E.S. Central
723
451
185
56
19
12
43
Worcester, MA
55
43
8
1
1
2
8
Birmingham, AL
107
62
20
13
8
4
6
Mid. Atlantic
1,500
1,083
298
80
21
18
66
Chattanooga, TN
66
38
22
2
—
4
7
Albany, NY
36
27
7
2
—
—
3
Knoxville, TN
104
69
28
5
2
—
5
Allentown, PA
29
22
3
2
2
—
—
Lexington, KY
40
26
8
5
1
—
—
Buffalo, NY
78
54
12
8
3
1
4
Memphis, TN
159
101
41
13
3
1
19
Camden, NJ
22
15
5
2
—
—
3
Mobile, AL
72
44
22
5
1
—
1
Elizabeth, NJ
11
5
3
3
—
—
—
Montgomery, AL
33
24
4
5
—
—
2
Erie, PA
36
27
8
—
1
—
2
Nashville, TN
142
87
40
8
4
3
3
Jersey City, NJ
17
12
4
1
—
—
—
W.S. Central
1,130
746
268
82
20
13
58
New York City, NY
906
646
197
40
11
12
35
Austin, TX
60
40
14
5
—
1
2
Newark, NJ
43
25
10
6
1
1
2
Baton Rouge, LA
87
56
26
5
—
—
4
Paterson, NJ
19
17
—
2
—
—
—
Corpus Christi, TX
30
20
6
3
1
—
4
Philadelphia, PA
U
U
U
U
U
U
U
Dallas, TX
149
90
34
14
7
3
7
Pittsburgh, PA§
39
31
5
1
—
2
5
El Paso, TX
60
43
14
3
—
—
1
Reading, PA
27
19
4
3
1
—
1
Fort Worth, TX
U
U
U
U
U
U
U
Rochester, NY
69
55
9
3
—
2
4
Houston, TX
320
200
83
25
8
4
8
Schenectady, NY
21
16
3
2
—
—
4
Little Rock, AR
54
37
12
2
2
1
3
Scranton, PA
33
28
4
1
—
—
—
New Orleans, LA
44
28
13
2
1
—
3
Syracuse, NY
64
48
12
3
1
—
3
San Antonio, TX
229
156
48
20
1
4
22
Trenton, NJ
19
11
7
1
—
—
—
Shreveport, LA
46
35
11
—
—
—
3
Utica, NY
7
7
—
—
—
—
—
Tulsa, OK
51
41
7
3
—
—
1
Yonkers, NY
24
18
5
—
1
—
—
Mountain
1,069
729
240
62
19
17
55
E.N. Central
1,667
1,123
393
89
41
21
107
Albuquerque, NM
103
71
22
3
5
2
7
Akron, OH
53
34
11
5
1
2
3
Boise, ID
57
45
7
3
1
1
1
Canton, OH
33
23
9
—
1
—
5
Colorado Springs, CO
59
38
13
6
1
1
1
Chicago, IL
228
158
49
9
9
3
17
Denver, CO
78
53
18
4
—
3
2
Cincinnati, OH
54
33
9
8
1
3
3
Las Vegas, NV
314
217
75
17
3
2
13
Cleveland, OH
222
155
52
12
3
—
8
Ogden, UT
39
30
2
4
1
2
4
Columbus, OH
178
116
51
6
2
3
11
Phoenix, AZ
150
85
47
12
3
2
9
Dayton, OH
93
71
16
4
2
—
6
Pueblo, CO
21
17
4
—
—
—
—
Detroit, MI
108
63
30
10
4
1
3
Salt Lake City, UT
124
92
22
7
2
1
12
Evansville, IN
55
42
13
—
—
—
9
Tucson, AZ
124
81
30
6
3
3
6
Fort Wayne, IN
61
46
9
3
2
1
4
Pacific
1,462
993
346
77
28
18
117
Gary, IN
7
3
3
1
—
—
—
Berkeley, CA
12
7
3
2
—
—
—
Grand Rapids, MI
40
27
11
1
1
—
5
Fresno, CA
111
69
29
7
4
2
12
Indianapolis, IN
158
85
57
10
4
2
12
Glendale, CA
22
19
1
2
—
—
5
Lansing, MI
40
29
5
3
3
—
2
Honolulu, HI
54
45
7
2
—
—
11
Milwaukee, WI
67
40
21
3
2
1
3
Long Beach, CA
41
25
12
3
1
—
6
Peoria, IL
52
37
12
3
—
—
3
Los Angeles, CA
199
118
52
14
9
6
19
Rockford, IL
49
37
8
1
1
2
3
Pasadena, CA
28
21
5
1
—
1
3
South Bend, IN
49
38
5
4
1
1
3
Portland, OR
117
81
29
5
—
2
7
Toledo, OH
59
38
14
3
2
2
4
Sacramento, CA
201
143
45
12
1
—
10
Youngstown, OH
61
48
8
3
2
—
3
San Diego, CA
122
73
38
7
2
2
7
W.N. Central
541
355
129
24
22
11
29
San Francisco, CA
80
49
23
3
4
1
5
Des Moines, IA
77
61
13
1
2
—
9
San Jose, CA
173
130
35
4
3
1
9
Duluth, MN
31
24
6
1
—
—
2
Santa Cruz, CA
36
27
8
1
—
—
3
Kansas City, KS
29
18
6
2
2
1
1
Seattle, WA
90
59
20
7
1
3
7
Kansas City, MO
71
42
20
5
2
2
2
Spokane, WA
54
40
12
2
—
—
3
Lincoln, NE
31
25
5
1
—
—
1
Tacoma, WA
122
87
27
5
3
—
10
Minneapolis, MN
60
35
15
7
1
2
5
Total¶
9,405
6,342
2,177
551
201
131
554
Omaha, NE
65
49
13
—
2
1
4
St. Louis, MO
61
22
24
6
7
2
1
St. Paul, MN
54
40
10
—
2
2
3
Wichita, KS
62
39
17
1
4
1
1
U: Unavailable. —: No reported cases.
* Mortality data in this table are voluntarily reported from 122 cities in the United States, most of which have populations of >100,000. A death is reported by the place of its occurrence and by the week that the death certificate was filed. Fetal deaths are not included.
† Pneumonia and influenza.
§ Because of changes in reporting methods in this Pennsylvania city, these numbers are partial counts for the current week. Complete counts will be available in 4 to 6 weeks.