Persons using assistive technology might not be able to fully access information in this file. For assistance, please send e-mail to: mmwrq@cdc.gov. Type 508 Accommodation and the title of the report in the subject line of e-mail.
Notifiable Diseases and Mortality Tables
Table I Summary of provisional cases of selected notifiable diseases, United States, cumulative, week ending June 15, 2013 (24th Week)
Figure I Selected notifiable disease reports, United States, comparison of provisional 4-week totals ending June 15, 2013, with historical data
Table II Provisional cases of selected notifiable diseases, United States, weeks ending June 15, 2013 and June 16, 2012 (24th Week)
Table III Deaths in 122 U.S. cities, week ending June 15, 2013 (24th Week)
TABLE I. Provisional cases of infrequently reported notifiable diseases (<1,000 cases reported during the preceding year) — United States, week ending June 15, 2013 (24th week)*
TABLE I. (Continued) Provisional cases of infrequently reported notifiable diseases (<1,000 cases reported during the preceding year) — United States, week ending June 15, 2013 (24th week)*
—: No reported cases. N: Not reportable. NN: Not Nationally Notifiable. Cum: Cumulative year-to-date counts.
† Calculated by summing the incidence counts for the current week, the 2 weeks preceding the current week, and the 2 weeks following the current week, for a total of 5 preceding years. The total sum of incident cases is then divided by 25 weeks. Additional information is available at http://wwwn.cdc.gov/nndss/document/5yearweeklyaverage.pdf.
§ Not reportable in all states. Data from states where the condition is not reportable are excluded from this table except starting in 2007 for the arboviral diseases, STD data, TB data, and influenza-associated pediatric mortality, and in 2003 for SARS-CoV. Reporting exceptions are available at http://wwwn.cdc.gov/nndss/document/SRCA_FINAL_REPORT_2006-2012_final.xlsx.
¶ Includes both neuroinvasive and nonneuroinvasive. Updated weekly from reports to the Division of Vector-Borne Infectious Diseases, National Center for Zoonotic, Vector-Borne, and Enteric Diseases (ArboNET Surveillance). Data for West Nile virus are available in Table II.
** Data for H. influenzae (all ages, all serotypes) are available in Table II.
†† Updated weekly from reports to the Influenza Division, National Center for Immunization and Respiratory Diseases. Since September 30, 2012, 153 influenza-associated pediatric deaths occurring during the 2012-13 influenza season have been reported. One influenza-associated pediatric death occurring during the 2010-11 influenza season has been reported from Kansas.
§§ No measles cases were reported for the current week.
¶¶ Data for meningococcal disease (all serogroups) are available in Table II.
*** CDC discontinued reporting of individual confirmed and probable cases of 2009 pandemic influenza A (H1N1) virus infections on July 24, 2009. During 2009, four cases of human infection with novel influenza A viruses, different from the 2009 pandemic influenza A (H1N1) strain, were reported to CDC. The four cases of novel influenza A virus infection reported to CDC during 2010, the fourteen cases reported during 2011, and the 313 cases reported in 2012 are different from the 2009 pandemic influenza A (H1N1) virus. Total case counts are provided by the Influenza Division, National Center for Immunization and Respiratory Diseases (NCIRD).
††† No rubella cases were reported for the current week.
§§§ Updated weekly from reports to the Division of STD Prevention, National Center for HIV/AIDS, Viral Hepatitis, STD, and TB Prevention.
¶¶¶ There were no cases of viral hemorrhagic fever reported during the current week. See Table II for dengue hemorrhagic fever.
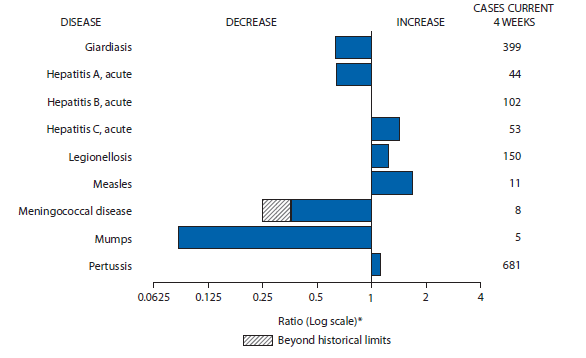
FIGURE I. Selected notifiable disease reports, United States, comparison of provisional 4-week totals June 15, 2013, with historical data
* Ratio of current 4-week total to mean of 15 4-week totals (from previous, comparable, and subsequent 4-week periods for the past 5 years). The point where the hatched area begins is based on the mean and two standard deviations of these 4-week totals.
Alternate Text: The figure above shows selected notifiable disease reports for the United States, with comparison of provisional 4-week totals through June 15, 2013, with historical data. Reports of acute hepatitis C, legionellosis, measles, and pertussis increased. Reports of acute hepatitis B were unchanged. Reports of giardiasis, acute hepatitis A, meningococcal disease, and mumps all decreased, with meningococcal disease decreasing beyond historical limits.
TABLE II. Provisional cases of selected notifiable diseases, United States, weeks ending June 15, 2013, and June 16, 2012 (24th week)*
Reporting area
Chlamydia trachomatis infection
Coccidioidomycosis
Cryptosporidiosis
Current week
Previous 52 weeks
Cum 2013
Cum 2012
Current week
Previous 52 weeks
Cum 2013
Cum 2012
Current week
Previous 52 weeks
Cum 2013
Cum 2012
Med
Max
Med
Max
Med
Max
United States
12,269
26,867
30,877
595,803
655,090
71
237
474
3,328
9,922
43
110
303
1,916
2,994
New England
904
944
1,340
21,873
22,257
—
0
1
1
1
1
5
19
83
135
Connecticut
199
251
560
5,909
5,761
N
0
0
N
N
—
0
3
7
17
Maine
—
65
111
1,384
1,523
N
0
0
N
N
—
0
4
11
23
Massachusetts
655
450
706
10,661
10,698
—
0
0
—
—
—
2
8
42
62
New Hampshire
—
57
81
1,222
1,467
—
0
1
1
—
—
1
4
9
15
Rhode Island
50
80
160
1,953
2,150
—
0
0
—
1
—
0
3
2
3
Vermont
—
31
110
744
658
N
0
0
N
N
1
1
6
12
15
Mid. Atlantic
1,504
3,489
4,483
80,664
84,908
—
0
1
—
3
11
13
41
198
271
New Jersey
179
543
646
12,558
12,926
N
0
0
N
N
—
1
3
16
19
New York (Upstate)
—
729
1,909
15,592
16,000
N
0
0
N
N
2
3
19
54
42
New York City
467
1,152
1,308
25,494
30,387
N
0
0
N
N
—
2
7
20
44
Pennsylvania
858
1,049
1,995
27,020
25,595
—
0
1
—
3
9
6
20
108
166
E.N. Central
1,205
4,180
4,755
85,899
100,165
1
1
3
11
25
8
24
108
430
706
Illinois
61
1,253
1,482
20,479
31,299
N
0
0
N
N
—
3
8
53
81
Indiana
190
562
838
12,355
13,405
N
0
0
N
N
—
2
6
40
84
Michigan
437
893
1,303
19,483
20,016
1
0
2
6
13
—
4
38
78
129
Ohio
246
1,053
1,212
22,907
24,450
—
0
2
3
11
4
8
28
125
228
Wisconsin
271
460
554
10,675
10,995
—
0
1
2
1
4
8
43
134
184
W.N. Central
31
1,536
1,794
28,598
37,740
—
2
7
21
85
4
15
60
266
517
Iowa
5
212
256
4,369
5,416
N
0
0
N
N
—
5
22
81
129
Kansas
—
208
256
4,081
5,227
N
0
0
N
N
—
2
6
29
58
Minnesota
—
341
436
4,384
8,033
—
1
6
13
70
—
4
21
—
117
Missouri
—
537
645
10,992
12,770
—
0
3
8
7
2
4
12
65
98
Nebraska
—
112
185
1,890
3,264
—
0
0
—
1
1
1
10
35
45
North Dakota
2
56
74
1,152
1,291
—
0
2
—
7
—
0
4
15
15
South Dakota
24
77
109
1,730
1,739
N
0
0
N
N
1
2
6
41
55
S. Atlantic
4,237
5,409
6,524
126,570
133,900
—
0
2
3
4
15
18
54
392
536
Delaware
85
93
322
2,472
1,783
—
0
1
—
—
—
0
2
3
7
District of Columbia
128
125
284
3,331
3,250
—
0
1
—
—
N
0
0
N
N
Florida
833
1,527
1,777
35,428
36,246
N
0
0
N
N
13
8
24
144
201
Georgia
669
956
1,246
20,802
25,475
N
0
0
N
N
2
4
15
95
135
Maryland
383
483
1,211
10,257
9,664
—
0
1
3
4
—
1
5
22
48
North Carolina
1,124
969
1,772
23,536
26,072
N
0
0
N
N
—
0
28
50
43
South Carolina
495
512
872
12,697
12,822
N
0
0
N
N
—
1
4
30
30
Virginia
434
637
1,018
15,733
16,460
N
0
0
N
N
—
2
7
41
67
West Virginia
86
93
149
2,314
2,128
N
0
0
N
N
—
0
3
7
5
E.S. Central
1,302
1,936
2,545
42,325
47,769
—
0
0
—
—
—
4
14
87
129
Alabama
708
563
874
13,507
14,043
N
0
0
N
N
—
2
6
38
49
Kentucky
270
340
773
7,770
7,174
N
0
0
N
N
—
1
4
20
20
Mississippi
144
366
678
8,465
11,027
N
0
0
N
N
—
0
4
13
19
Tennessee
180
608
735
12,583
15,525
N
0
0
N
N
—
1
4
16
41
W.S. Central
859
3,478
8,645
80,062
82,303
—
0
1
2
—
3
10
46
167
187
Arkansas
308
328
394
7,609
7,693
N
0
0
N
N
—
0
5
8
17
Louisiana
513
415
2,110
6,830
10,402
—
0
1
2
—
1
3
8
60
47
Oklahoma
38
163
5,044
8,389
6,220
N
0
0
N
N
—
1
13
23
30
Texas
—
2,497
3,700
57,234
57,988
N
0
0
N
N
2
5
28
76
93
Mountain
1,128
1,758
2,048
38,159
43,480
66
165
398
2,233
7,448
—
10
48
132
234
Arizona
379
535
755
10,328
14,170
65
164
394
2,184
7,331
—
1
4
12
13
Colorado
288
420
585
9,785
10,021
N
0
0
N
N
—
1
7
7
32
Idaho
28
85
198
1,797
2,148
N
0
0
N
N
—
3
25
39
48
Montana
63
69
108
1,694
1,870
—
0
1
1
2
—
1
5
21
36
Nevada
226
219
325
5,245
5,147
1
1
6
31
59
—
0
2
7
9
New Mexico
124
217
402
5,663
5,695
—
0
3
8
24
—
1
4
11
52
Utah
16
151
179
3,086
3,497
—
0
4
7
28
—
3
22
34
27
Wyoming
4
34
67
561
932
—
0
1
2
4
—
0
4
1
17
Pacific
1,099
4,112
5,232
91,653
102,568
4
63
106
1,057
2,356
1
11
25
161
279
Alaska
20
105
149
2,543
2,606
N
0
0
N
N
—
0
1
—
2
California
462
3,144
4,240
70,261
79,245
4
63
106
1,055
2,355
1
6
14
99
155
Hawaii
—
122
153
2,068
2,866
N
0
0
N
N
—
0
1
—
2
Oregon
298
264
474
6,727
6,555
—
0
1
2
1
—
3
10
38
91
Washington
319
465
632
10,054
11,296
—
0
7
—
—
—
1
16
24
29
Territories
American Samoa
—
12
59
—
—
N
0
0
N
N
N
0
0
N
N
C.N.M.I.
—
—
—
—
—
—
—
—
—
—
—
—
—
—
—
Guam
—
0
0
—
—
—
0
0
—
—
—
0
0
—
—
Puerto Rico
70
109
307
2,720
3,143
N
0
0
N
N
N
0
0
N
N
U.S. Virgin Islands
—
14
25
159
381
—
0
0
—
—
—
0
0
—
—
C.N.M.I.: Commonwealth of Northern Mariana Islands.
U: Unavailable. —: No reported cases. N: Not reportable. NN: Not Nationally Notifiable. Cum: Cumulative year-to-date counts. Med: Median. Max: Maximum.
† Data for meningococcal disease, invasive caused by serogroups A, C, Y, and W-135; serogroup B; other serogroup; and unknown serogroup are available in Table I.
TABLE II. (Continued) Provisional cases of selected notifiable diseases, United States, weeks ending June 15, 2013, and June 16, 2012 (24th week)*
Reporting area
Rabies, animal
Salmonellosis
Shiga toxin-producing E. coli (STEC)†
Current week
Previous 52 weeks
Cum 2013
Cum 2012
Current week
Previous 52 weeks
Cum 2013
Cum 2012
Current week
Previous 52 weeks
Cum 2013
Cum 2012
Med
Max
Med
Max
Med
Max
United States
14
65
140
1,164
1,777
401
811
1,736
13,455
17,084
48
108
221
1,524
2,043
New England
2
6
16
135
177
4
36
73
733
780
2
4
11
82
65
Connecticut
2
3
8
60
85
—
7
19
128
182
—
1
5
22
16
Maine
—
1
4
24
51
—
3
11
58
64
—
0
4
11
3
Massachusetts
—
0
0
—
—
4
21
54
442
411
2
2
6
33
35
New Hampshire
—
1
3
15
9
—
3
9
42
52
—
0
4
9
4
Rhode Island
—
0
5
10
10
—
1
7
32
40
—
0
1
—
1
Vermont
—
1
7
26
22
—
1
7
31
31
—
0
3
7
6
Mid. Atlantic
—
10
32
128
323
57
81
187
1,495
1,893
13
11
29
188
213
New Jersey
—
0
0
—
—
—
13
48
199
432
—
2
7
30
58
New York (Upstate)
—
6
20
128
145
38
23
74
425
468
6
5
15
70
58
New York City
—
0
2
—
2
4
19
49
391
413
—
1
7
32
39
Pennsylvania
—
4
15
—
176
15
29
62
480
580
7
4
12
56
58
E.N. Central
1
1
7
22
39
31
84
239
1,520
2,038
2
17
77
226
325
Illinois
—
0
2
8
—
—
30
79
507
643
—
4
17
58
63
Indiana
—
0
2
—
1
—
9
41
167
275
—
2
23
27
65
Michigan
—
0
5
6
27
3
16
46
325
378
1
3
41
48
72
Ohio
1
0
7
8
11
28
24
50
444
432
1
4
20
71
46
Wisconsin
N
0
0
N
N
—
10
36
77
310
—
3
21
22
79
W.N. Central
2
2
48
56
100
27
46
150
823
1,211
8
15
42
204
334
Iowa
—
0
5
—
11
4
10
32
190
183
—
2
15
31
62
Kansas
—
1
5
30
38
—
9
18
142
191
—
2
7
31
28
Minnesota
—
0
0
—
—
—
7
44
—
292
—
3
16
—
56
Missouri
2
0
2
19
15
16
18
46
288
345
7
5
18
100
131
Nebraska
—
0
0
—
—
7
4
26
100
109
1
1
6
23
29
North Dakota
—
0
46
—
6
—
2
5
43
23
—
0
3
13
13
South Dakota
—
0
4
7
30
—
3
9
60
68
—
1
4
6
15
S. Atlantic
1
18
31
385
549
146
232
624
3,623
4,725
11
11
72
227
195
Delaware
—
0
0
—
—
—
2
10
19
46
—
0
3
2
4
District of Columbia
—
0
0
—
—
—
1
3
16
29
—
0
1
3
5
Florida
—
0
20
44
103
98
116
272
1,712
1,769
6
2
10
84
37
Georgia
—
0
0
—
—
14
28
110
486
818
4
2
6
56
56
Maryland
—
6
17
99
148
—
14
40
261
364
—
1
5
22
28
North Carolina
—
0
0
—
—
14
24
164
463
847
—
0
61
22
29
South Carolina
—
0
0
—
—
14
19
72
279
405
—
0
7
3
8
Virginia
—
11
21
213
261
6
22
46
338
366
1
1
6
27
23
West Virginia
1
1
6
29
37
—
3
15
49
81
—
0
2
8
5
E.S. Central
—
1
5
18
33
17
50
210
828
1,165
3
5
13
104
131
Alabama
—
0
5
10
28
—
16
59
208
321
—
1
5
18
25
Kentucky
—
0
3
7
4
5
11
53
166
183
—
1
9
29
30
Mississippi
—
0
1
1
1
—
14
65
194
315
1
0
3
11
7
Tennessee
—
0
0
—
—
12
17
63
260
346
2
2
7
46
69
W.S. Central
8
12
60
392
405
91
157
432
1,684
2,265
4
10
126
176
246
Arkansas
—
0
34
92
76
17
14
229
154
192
—
1
10
25
29
Louisiana
—
0
1
—
1
5
21
62
279
466
—
0
3
3
12
Oklahoma
—
0
23
22
26
12
15
34
226
220
4
1
11
28
31
Texas
8
11
40
278
302
57
86
329
1,025
1,387
—
7
105
120
174
Mountain
—
0
16
5
52
10
44
82
768
898
1
8
45
96
183
Arizona
N
0
0
N
N
7
16
31
288
275
—
2
8
15
49
Colorado
—
0
0
—
—
—
8
19
64
222
—
1
9
2
54
Idaho
—
0
15
—
1
—
2
7
43
64
—
1
30
21
25
Montana
N
0
0
N
N
—
2
9
33
33
—
1
5
12
8
Nevada
—
0
4
5
3
3
4
12
87
74
1
0
5
12
11
New Mexico
—
0
3
—
35
—
6
20
121
98
—
1
5
8
15
Utah
—
0
2
—
2
—
4
15
114
106
—
1
15
24
15
Wyoming
—
0
6
—
11
—
1
8
18
26
—
0
3
2
6
Pacific
—
2
14
23
99
18
111
247
1,981
2,109
4
15
44
221
351
Alaska
—
0
2
6
5
2
1
5
30
27
N
0
0
N
N
California
—
2
12
13
91
6
82
164
1,484
1,505
1
8
22
114
214
Hawaii
—
0
0
—
—
—
5
14
102
176
—
0
5
13
7
Oregon
—
0
2
4
3
2
7
15
126
153
1
3
11
38
70
Washington
—
0
9
—
—
8
14
70
239
248
2
3
24
56
60
Territories
American Samoa
—
0
0
—
—
—
1
2
—
1
—
0
0
—
—
C.N.M.I.
—
—
—
—
—
—
—
—
—
—
—
—
—
—
—
Guam
—
0
0
—
—
—
0
3
—
5
—
0
0
—
—
Puerto Rico
—
0
0
—
27
—
0
4
—
23
—
0
2
—
—
U.S. Virgin Islands
—
0
0
—
—
—
0
0
—
—
—
0
0
—
—
C.N.M.I.: Commonwealth of Northern Mariana Islands.
U: Unavailable. —: No reported cases. N: Not reportable. NN: Not Nationally Notifiable. Cum: Cumulative year-to-date counts. Med: Median. Max: Maximum.
† Illnesses with similar clinical presentation that result from Spotted fever group rickettsia infections are reported as Spotted fever rickettsioses. Rocky Mountain spotted fever (RMSF) caused by Rickettsia rickettsii, is the most common and well-known spotted fever.
TABLE II. (Continued) Provisional cases of selected notifiable diseases, United States, weeks ending June 15, 2013, and June 16, 2012 (24th week)*
Reporting area
Streptococcus pneumoniae,† invasive disease
Syphilis, primary and secondary
All ages
Age <5
Current week
Previous 52 weeks
Cum 2013
Cum 2012
Current week
Previous 52 weeks
Cum 2013
Cum 2012
Current week
Previous 52 weeks
Cum 2013
Cum 2012
Med
Max
Med
Max
Med
Max
United States
107
276
948
8,760
8,217
7
23
55
568
635
60
308
391
6,260
6,812
New England
—
11
55
324
370
—
1
4
17
33
2
8
18
212
230
Connecticut
—
5
21
170
182
—
0
2
6
10
—
1
6
24
28
Maine
—
2
8
67
61
—
0
1
3
1
—
0
5
3
10
Massachusetts
—
0
4
8
24
—
0
3
7
17
2
6
18
152
144
New Hampshire
—
1
5
39
47
—
0
1
1
4
—
1
4
14
16
Rhode Island
—
0
29
1
26
—
0
0
—
1
—
0
3
16
29
Vermont
—
1
6
39
30
—
0
0
—
—
—
0
2
3
3
Mid. Atlantic
20
41
198
1,287
1,252
—
2
13
65
60
7
40
59
867
831
New Jersey
—
10
30
305
339
—
1
3
19
21
—
4
10
65
95
New York (Upstate)
19
18
147
570
530
—
1
9
29
29
—
5
32
118
89
New York City
1
13
36
412
383
—
0
3
17
10
2
21
32
475
428
Pennsylvania
N
—
—
N
N
N
0
0
N
N
5
9
19
209
219
E.N. Central
13
55
132
1,770
1,660
—
4
9
93
125
2
32
61
600
792
Illinois
N
0
0
N
N
—
1
3
22
25
—
11
25
189
378
Indiana
—
14
50
350
375
—
1
3
14
16
2
4
10
110
90
Michigan
2
11
30
410
322
—
0
3
22
20
—
6
14
131
115
Ohio
10
21
63
749
689
—
1
6
25
46
—
8
15
142
177
Wisconsin
1
8
26
261
274
—
0
2
10
18
—
2
5
28
32
W.N. Central
2
12
35
328
416
—
1
5
49
47
—
8
18
176
150
Iowa
N
0
0
N
N
N
0
0
N
N
—
1
5
21
23
Kansas
N
0
0
N
N
N
0
0
N
N
—
0
2
12
10
Minnesota
—
7
24
186
235
—
1
3
15
16
—
2
5
42
45
Missouri
N
0
0
N
N
—
1
3
18
18
—
3
9
85
61
Nebraska
1
2
7
81
84
—
0
1
8
5
—
0
2
9
3
North Dakota
—
0
7
2
48
—
0
1
2
—
—
0
1
2
2
South Dakota
1
2
6
59
49
—
0
1
6
8
—
0
2
5
6
S. Atlantic
40
65
143
2,124
1,775
4
5
14
156
136
30
70
184
1,426
1,643
Delaware
—
0
3
17
21
—
0
1
—
—
—
0
9
16
20
District of Columbia
1
1
7
51
36
—
0
1
—
1
2
3
8
85
87
Florida
27
21
59
678
547
4
1
5
55
45
2
25
39
531
640
Georgia
8
19
56
662
489
—
2
6
47
35
8
14
110
256
345
Maryland
—
7
26
271
283
—
0
4
19
20
—
8
15
157
190
North Carolina
N
0
0
N
N
N
0
0
N
N
7
3
34
97
160
South Carolina
3
7
21
278
212
—
0
3
13
13
9
5
10
141
101
Virginia
N
0
0
N
N
—
0
4
15
17
2
5
40
136
97
West Virginia
1
5
23
167
187
—
0
2
7
5
—
0
2
7
3
E.S. Central
12
28
60
875
713
1
2
5
52
51
5
12
25
232
353
Alabama
—
2
10
104
61
—
0
3
12
5
1
3
10
65
97
Kentucky
4
5
12
160
113
—
0
1
6
4
1
2
10
54
55
Mississippi
4
4
12
145
95
1
0
2
11
13
2
1
11
39
76
Tennessee
4
14
41
466
444
—
0
4
23
29
1
4
9
74
125
W.S. Central
11
33
368
1,079
933
2
3
24
78
92
5
42
66
910
977
Arkansas
—
3
24
106
90
—
0
1
3
10
1
2
13
78
92
Louisiana
—
5
14
146
120
—
0
4
8
9
1
6
20
112
134
Oklahoma
N
0
0
N
N
—
0
2
11
15
3
2
5
44
26
Texas
11
26
340
827
723
2
2
23
56
58
—
31
47
676
725
Mountain
8
28
64
889
1,015
—
2
7
46
81
1
13
26
287
263
Arizona
7
12
42
506
422
—
1
4
23
29
—
4
8
100
88
Colorado
—
5
22
81
238
—
0
3
4
17
—
4
12
68
65
Idaho
N
0
0
N
N
—
0
1
3
1
—
0
4
4
12
Montana
—
0
3
19
21
—
0
1
3
1
—
0
1
3
—
Nevada
1
2
7
75
62
—
0
1
3
7
1
2
8
63
45
New Mexico
—
5
17
179
160
—
0
2
8
13
—
2
6
28
43
Utah
—
2
11
17
97
—
0
3
2
12
—
1
3
20
9
Wyoming
—
0
3
12
15
—
0
1
—
1
—
0
1
1
1
Pacific
1
4
10
84
83
—
0
2
12
10
8
68
103
1,550
1,573
Alaska
1
3
7
52
56
—
0
1
10
9
—
0
2
8
4
California
N
0
0
N
N
N
0
0
N
N
3
58
86
1,330
1,311
Hawaii
—
1
6
32
27
—
0
2
2
1
—
0
3
7
8
Oregon
N
0
0
N
N
N
0
0
N
N
1
4
16
114
97
Washington
N
0
0
N
N
N
0
0
N
N
4
4
13
91
153
Territories
American Samoa
N
0
0
N
N
—
0
0
—
—
—
0
0
—
—
C.N.M.I.
—
—
—
—
—
—
—
—
—
—
—
—
—
—
—
Guam
—
0
0
—
—
—
0
0
—
—
—
0
0
—
—
Puerto Rico
—
0
0
—
—
—
0
0
—
—
—
7
17
166
122
U.S. Virgin Islands
—
0
0
—
—
—
0
0
—
—
—
0
0
—
—
C.N.M.I.: Commonwealth of Northern Mariana Islands.
U: Unavailable. —: No reported cases. N: Not reportable. NN: Not Nationally Notifiable. Cum: Cumulative year-to-date counts. Med: Median. Max: Maximum.
† Includes drug resistant and susceptible cases of invasive Streptococcus pneumoniae disease among children <5 years and among all ages. Case definition: Isolation of S. pneumoniae from a normally sterile body site (e.g., blood or cerebrospinal fluid).
TABLE II. (Continued) Provisional cases of selected notifiable diseases, United States, weeks ending June 15, 2013, and June 16, 2012 (24th week)*
Reporting area
Varicella (chickenpox)
West Nile virus disease†
Neuroinvasive
Nonneuroinvasive§
Current week
Previous 52 weeks
Cum 2013
Cum 2012
Current week
Previous 52 weeks
Cum 2013
Cum 2012
Current week
Previous 52 weeks
Cum 2013
Cum 2012
Med
Max
Med
Max
Med
Max
United States
93
186
313
4,347
7,441
—
2
323
3
22
—
1
342
2
21
New England
7
19
42
392
824
—
0
8
—
—
—
0
5
—
—
Connecticut
2
4
11
93
134
—
0
2
—
—
—
0
3
—
—
Maine
3
3
10
74
139
—
0
1
—
—
—
0
0
—
—
Massachusetts
1
7
17
176
325
—
0
7
—
—
—
0
3
—
—
New Hampshire
—
1
8
9
75
—
0
1
—
—
—
0
0
—
—
Rhode Island
—
0
10
8
51
—
0
1
—
—
—
0
1
—
—
Vermont
1
1
5
32
100
—
0
1
—
—
—
0
1
—
—
Mid. Atlantic
11
19
44
500
777
—
0
19
—
—
—
0
18
—
—
New Jersey
—
5
19
142
294
—
0
5
—
—
—
0
5
—
—
New York (Upstate)
N
0
0
N
N
—
0
6
—
—
—
0
8
—
—
New York City
—
0
0
—
—
—
0
5
—
—
—
0
2
—
—
Pennsylvania
11
13
34
358
483
—
0
5
—
—
—
0
4
—
—
E.N. Central
26
55
128
1,277
1,979
—
0
91
—
—
—
0
39
—
1
Illinois
—
14
32
319
486
—
0
31
—
—
—
0
18
—
1
Indiana
2
6
26
130
202
—
0
8
—
—
—
0
6
—
—
Michigan
17
15
45
330
539
—
0
33
—
—
—
0
12
—
—
Ohio
5
13
33
341
472
—
0
19
—
—
—
0
12
—
—
Wisconsin
2
6
12
157
280
—
0
11
—
—
—
0
3
—
—
W.N. Central
1
6
43
122
261
—
0
36
—
2
—
0
60
—
4
Iowa
N
0
0
N
N
—
0
3
—
—
—
0
5
—
1
Kansas
—
0
0
—
85
—
0
3
—
1
—
0
6
—
1
Minnesota
—
0
0
—
—
—
0
6
—
1
—
0
7
—
—
Missouri
—
5
39
91
121
—
0
4
—
—
—
0
1
—
—
Nebraska
—
0
1
1
22
—
0
8
—
—
—
0
22
—
—
North Dakota
1
0
5
14
16
—
0
8
—
—
—
0
11
—
—
South Dakota
—
0
4
16
17
—
0
17
—
—
—
0
28
—
2
S. Atlantic
8
25
43
629
972
—
0
21
—
1
—
0
21
—
1
Delaware
—
0
2
11
3
—
0
1
—
—
—
0
2
—
—
District of Columbia
—
0
2
—
10
—
0
3
—
—
—
0
1
—
—
Florida
5
12
24
350
527
—
0
5
—
—
—
0
5
—
1
Georgia
—
1
6
30
21
—
0
6
—
1
—
0
10
—
—
Maryland
N
0
0
N
N
—
0
5
—
—
—
0
4
—
—
North Carolina
N
0
0
N
N
—
0
3
—
—
—
0
0
—
—
South Carolina
3
0
13
82
4
—
0
5
—
—
—
0
2
—
—
Virginia
—
7
19
107
254
—
0
4
—
—
—
0
3
—
—
West Virginia
—
2
12
49
153
—
0
1
—
—
—
0
3
—
—
E.S. Central
1
3
9
90
114
—
0
20
1
2
—
0
22
1
1
Alabama
1
3
9
87
109
—
0
7
—
1
—
0
4
—
1
Kentucky
N
0
0
N
N
—
0
4
—
1
—
0
2
—
—
Mississippi
—
0
1
3
5
—
0
12
—
—
—
0
17
1
—
Tennessee
N
0
0
N
N
—
0
4
1
—
—
0
2
—
—
W.S. Central
38
40
212
994
1,493
—
1
144
1
14
—
0
166
1
12
Arkansas
—
3
20
76
104
—
0
9
—
1
—
0
3
—
1
Louisiana
1
1
7
30
38
—
0
18
—
—
—
0
26
—
—
Oklahoma
N
0
0
N
N
—
0
24
—
1
—
0
22
—
1
Texas
37
34
209
888
1,351
—
1
104
1
12
—
0
131
1
10
Mountain
1
17
44
307
949
—
0
37
—
3
—
0
22
—
—
Arizona
1
2
21
15
336
—
0
10
—
3
—
0
7
—
—
Colorado
—
6
15
93
283
—
0
17
—
—
—
0
13
—
—
Idaho
N
0
0
N
N
—
0
1
—
—
—
0
3
—
—
Montana
—
2
8
51
67
—
0
1
—
—
—
0
2
—
—
Nevada
N
0
0
N
N
—
0
1
—
—
—
0
2
—
—
New Mexico
—
1
5
28
65
—
0
9
—
—
—
0
5
—
—
Utah
—
5
13
114
187
—
0
1
—
—
—
0
1
—
—
Wyoming
—
0
3
6
11
—
0
1
—
—
—
0
2
—
—
Pacific
—
2
6
36
72
—
0
33
1
—
—
0
26
—
2
Alaska
—
1
4
19
36
—
0
0
—
—
—
0
0
—
—
California
—
0
4
6
14
—
0
33
1
—
—
0
25
—
1
Hawaii
—
1
4
11
22
—
0
0
—
—
—
0
0
—
—
Oregon
N
0
0
N
N
—
0
0
—
—
—
0
2
—
1
Washington
N
0
0
N
N
—
0
4
—
—
—
0
0
—
—
Territories
American Samoa
N
0
0
N
N
—
0
0
—
—
—
0
0
—
—
C.N.M.I.
—
—
—
—
—
—
—
—
—
—
—
—
—
—
—
Guam
—
0
0
—
—
—
0
0
—
—
—
0
0
—
—
Puerto Rico
—
0
4
—
60
—
0
1
—
—
—
0
0
—
—
U.S. Virgin Islands
—
0
0
—
—
—
0
0
—
—
—
0
0
—
—
C.N.M.I.: Commonwealth of Northern Mariana Islands.
U: Unavailable. —: No reported cases. N: Not reportable. NN: Not Nationally Notifiable. Cum: Cumulative year-to-date counts. Med: Median. Max: Maximum.
† Updated weekly from reports to the Division of Vector-Borne Infectious Diseases, National Center for Zoonotic, Vector-Borne, and Enteric Diseases (ArboNET Surveillance). Data for California serogroup, eastern equine, Powassan, St. Louis, and western equine diseases are available in Table I.
§ Not reportable in all states. Data from states where the condition is not reportable are excluded from this table, except starting in 2007 for the domestic arboviral diseases and influenza-associated pediatric mortality, and in 2003 for SARS-CoV. Reporting exceptions are available at http://wwwn.cdc.gov/nndss/document/SRCA_FINAL_REPORT_2006-2012_final.xlsx.
TABLE III. Deaths in 122 U.S. cities,* week ending June 15, 2013 (24th week)
Reporting area
All causes, by age (years)
P&I† Total
Reporting area (Continued)
All causes, by age (years)
P&I† Total
All Ages
=65
45–64
25–44
1–24
<1
All Ages
=65
45–64
25–44
1–24
<1
New England
515
337
128
27
12
11
44
S. Atlantic
907
608
208
62
19
10
50
Boston, MA
137
86
40
4
3
4
8
Atlanta, GA
157
96
41
17
3
—
5
Bridgeport, CT
36
23
8
5
—
—
3
Baltimore, MD
137
75
42
15
4
1
13
Cambridge, MA
12
11
1
—
—
—
1
Charlotte, NC
127
88
28
7
1
3
11
Fall River, MA
26
19
6
1
—
—
2
Jacksonville, FL
119
76
33
5
3
2
5
Hartford, CT
55
31
15
2
6
1
3
Miami, FL
82
64
10
4
3
1
4
Lowell, MA
16
10
4
—
2
—
—
Norfolk, VA
27
14
8
2
—
3
—
Lynn, MA
5
4
1
—
—
—
2
Richmond, VA
62
40
15
4
3
—
—
New Bedford, MA
18
13
3
2
—
—
—
Savannah, GA
49
35
10
4
—
—
2
New Haven, CT
30
21
5
3
1
—
5
St. Petersburg, FL
39
32
7
—
—
—
—
Providence, RI
55
38
13
2
—
2
5
Tampa, FL
5
3
1
1
—
—
—
Somerville, MA
3
2
1
—
—
—
—
Washington, D.C.
97
79
13
3
2
—
10
Springfield, MA
35
18
11
3
—
3
2
Wilmington, DE
6
6
—
—
—
—
—
Waterbury, CT
23
14
7
2
—
—
1
E.S. Central
967
647
235
58
19
8
70
Worcester, MA
64
47
13
3
—
1
12
Birmingham, AL
234
152
58
18
4
2
13
Mid. Atlantic
1,584
1,111
328
87
30
28
93
Chattanooga, TN
92
65
17
7
2
1
10
Albany, NY
42
26
14
—
1
1
4
Knoxville, TN
106
77
23
4
—
2
3
Allentown, PA
30
24
3
2
—
1
3
Lexington, KY
72
52
15
3
2
—
—
Buffalo, NY
68
45
16
6
—
1
4
Memphis, TN
172
101
53
10
7
1
22
Camden, NJ
16
5
6
3
—
2
—
Mobile, AL
77
55
17
4
1
—
8
Elizabeth, NJ
15
9
4
2
—
—
2
Montgomery, AL
62
45
14
3
—
—
6
Erie, PA
46
37
8
1
—
—
2
Nashville, TN
152
100
38
9
3
2
8
Jersey City, NJ
21
16
3
2
—
—
2
W.S. Central
1,239
782
316
83
33
25
66
New York City, NY
963
682
200
50
18
13
59
Austin, TX
93
54
29
5
5
—
1
Newark, NJ
45
22
15
4
3
1
1
Baton Rouge, LA
92
61
18
9
3
1
5
Paterson, NJ
21
16
4
1
—
—
4
Corpus Christi, TX
47
30
14
1
—
2
3
Philadelphia, PA
U
U
U
U
U
U
U
Dallas, TX
188
106
57
12
9
4
14
Pittsburgh, PA§
47
34
5
3
—
5
—
El Paso, TX
106
71
26
7
—
2
5
Reading, PA
33
24
1
2
3
3
—
Fort Worth, TX
U
U
U
U
U
U
U
Rochester, NY
85
59
20
4
2
—
6
Houston, TX
207
115
57
29
1
5
4
Schenectady, NY
17
10
6
—
1
—
—
Little Rock, AR
75
54
13
3
2
3
4
Scranton, PA
24
21
—
3
—
—
2
New Orleans, LA
44
23
13
—
3
5
1
Syracuse, NY
52
41
8
2
1
—
2
San Antonio, TX
255
179
55
13
5
3
23
Trenton, NJ
28
18
8
1
1
—
—
Shreveport, LA
71
45
20
3
3
—
3
Utica, NY
12
7
3
1
—
1
—
Tulsa, OK
61
44
14
1
2
—
3
Yonkers, NY
19
15
4
—
—
—
2
Mountain
1,151
760
273
69
26
22
53
E.N. Central
1,957
1,275
498
111
41
32
136
Albuquerque, NM
91
53
25
8
2
3
7
Akron, OH
49
34
9
5
1
—
8
Boise, ID
69
42
21
1
3
2
2
Canton, OH
30
27
1
2
—
—
4
Colorado Springs, CO
78
52
19
4
2
1
5
Chicago, IL
228
131
66
22
6
3
17
Denver, CO
111
64
35
8
2
2
—
Cincinnati, OH
90
50
31
5
3
1
4
Las Vegas, NV
275
204
51
11
4
5
20
Cleveland, OH
267
176
71
14
3
3
16
Ogden, UT
43
34
8
1
—
—
5
Columbus, OH
231
150
60
12
6
3
12
Phoenix, AZ
184
106
53
16
4
5
8
Dayton, OH
122
91
19
7
2
3
7
Pueblo, CO
23
16
5
2
—
—
1
Detroit, MI
170
92
59
11
5
3
13
Salt Lake City, UT
146
100
28
11
5
2
3
Evansville, IN
55
41
11
2
1
—
5
Tucson, AZ
131
89
28
7
4
2
2
Fort Wayne, IN
70
49
15
1
3
2
3
Pacific
1,702
1,160
356
118
43
25
128
Gary, IN
12
6
5
1
—
—
1
Berkeley, CA
10
8
2
—
—
—
—
Grand Rapids, MI
75
54
13
2
2
4
5
Fresno, CA
140
91
27
14
4
4
12
Indianapolis, IN
160
95
51
9
1
4
16
Glendale, CA
25
19
4
1
—
1
4
Lansing, MI
56
41
10
3
2
—
4
Honolulu, HI
76
55
12
5
1
3
7
Milwaukee, WI
88
60
24
1
1
2
5
Long Beach, CA
75
55
11
6
1
2
11
Peoria, IL
U
U
U
U
U
U
U
Los Angeles, CA
255
162
63
15
11
4
22
Rockford, IL
52
38
12
1
1
—
7
Pasadena, CA
23
15
4
3
1
—
3
South Bend, IN
47
34
9
2
1
1
1
Portland, OR
130
82
31
12
5
—
8
Toledo, OH
86
56
20
6
1
3
6
Sacramento, CA
224
159
46
14
4
1
12
Youngstown, OH
69
50
12
5
2
—
2
San Diego, CA
151
102
33
11
4
1
15
W.N. Central
683
442
188
25
16
10
55
San Francisco, CA
90
57
21
7
2
3
6
Des Moines, IA
107
84
20
—
2
1
3
San Jose, CA
185
145
26
9
1
4
14
Duluth, MN
20
14
6
—
—
—
1
Santa Cruz, CA
31
24
6
1
—
—
1
Kansas City, KS
34
18
12
4
—
—
1
Seattle, WA
109
63
37
6
3
—
2
Kansas City, MO
90
51
26
3
5
4
4
Spokane, WA
63
39
15
5
2
2
2
Lincoln, NE
46
34
8
2
2
—
3
Tacoma, WA
115
84
18
9
4
—
9
Minneapolis, MN
60
42
11
4
1
1
3
Total¶
10,705
7,122
2,530
640
239
171
695
Omaha, NE
107
76
26
1
2
2
14
St. Louis, MO
95
48
39
6
1
1
11
St. Paul, MN
48
31
15
—
1
1
3
Wichita, KS
76
44
25
5
2
—
12
U: Unavailable. —: No reported cases.
* Mortality data in this table are voluntarily reported from 122 cities in the United States, most of which have populations of >100,000. A death is reported by the place of its occurrence and by the week that the death certificate was filed. Fetal deaths are not included.
† Pneumonia and influenza.
§ Because of changes in reporting methods in this Pennsylvania city, these numbers are partial counts for the current week. Complete counts will be available in 4 to 6 weeks.